You can download four high-resolution A3 JPG maps of Burnet County from this page in one ZIP file. Before downloading, the on-page previews let you compare the county road-and-place pattern, ranked cities, waterways, and elevation around Burnet, Marble Falls, Granite Shoals, and Bertram. The larger JPG files are intended for printing, classroom work, personal reference, or closer inspection when the smaller web images do not show enough detail.
The supplied county map immediately establishes several useful reference points. Burnet sits near the center, U.S. 281 runs north-south through Burnet toward Marble Falls, and State Highway 29 crosses the county from west to east through Burnet and Bertram. Briggs appears near U.S. 183 in the northeastern part of the map, while the southern cluster includes Marble Falls, Granite Shoals, Horseshoe Bay, Highland Haven, and Double Horn. Along the western side, the broad water edge and the Buchanan Dam label make the lake country an important visual reference before any smaller roads or streams are considered.
Table of Contents
Burnet gives the county map a clear road framework
Start with Burnet rather than trying to read every label at once. U.S. 281 passes through the central part of the county and continues south toward Marble Falls, creating a simple north-south line for orientation. State Highway 29 crosses that route near Burnet and continues toward Bertram to the east. With those two roads in place, the scattered outer communities make more sense because they can be judged by their relationship to the main crossroads rather than by straight-line distance alone.
The general county map also includes labels for the Burnet County Sheriff’s Office, Marble Falls Area Emergency Medical, Baylor Scott and White Medical, and Spicewood Airport. These are useful as local reference points because they appear near the more developed road corridors. They also show that activity is not represented by one central city only. Burnet is the county seat shown in the interior, but the map contains another substantial concentration of places and services around Marble Falls and the southern lakes area.
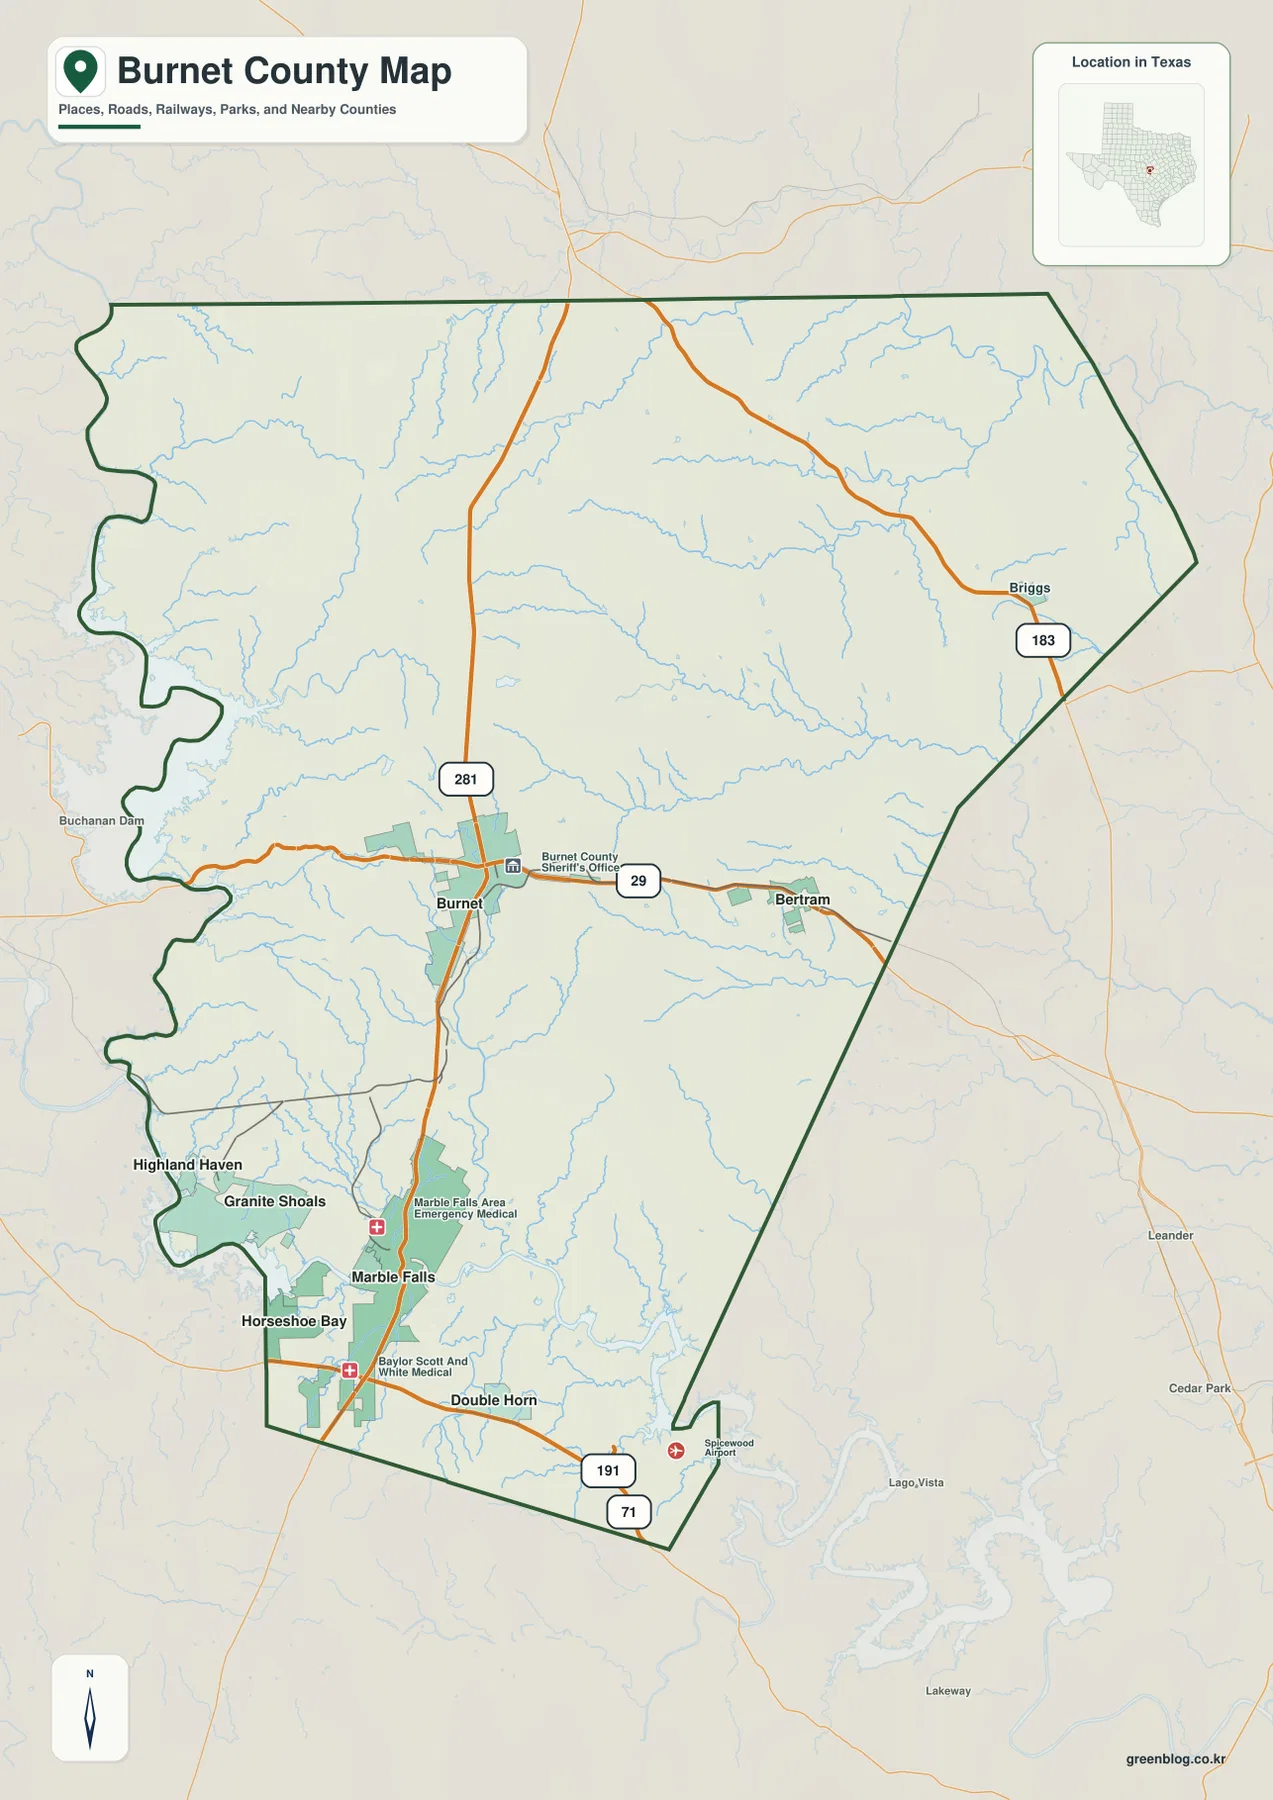
Buchanan Dam is labeled near the western edge, while Highland Haven, Granite Shoals, Horseshoe Bay, and Marble Falls form a much tighter group in the south and southwest. Double Horn appears farther south near the routes marked 191 and 71. By contrast, the northern half of the county has fewer large settlement labels on this map. That uneven distribution is important: the county is not shown as one continuous built-up area, and the southern lake corridor has a noticeably different visual character from the broad northern interior.
The ranked city map highlights a southern cluster
The city map identifies six major cities and provides a ranked value for each one. As printed on the supplied map, Marble Falls is listed first at 7,752, followed by Burnet at 6,732, Granite Shoals at 5,328, Bertram at 2,037, Meadowlakes at 1,861, and Cottonwood Shores at 1,859. Those figures are described here exactly as they appear in the map’s city index; this page does not assign them a census year that is not stated in the provided material.
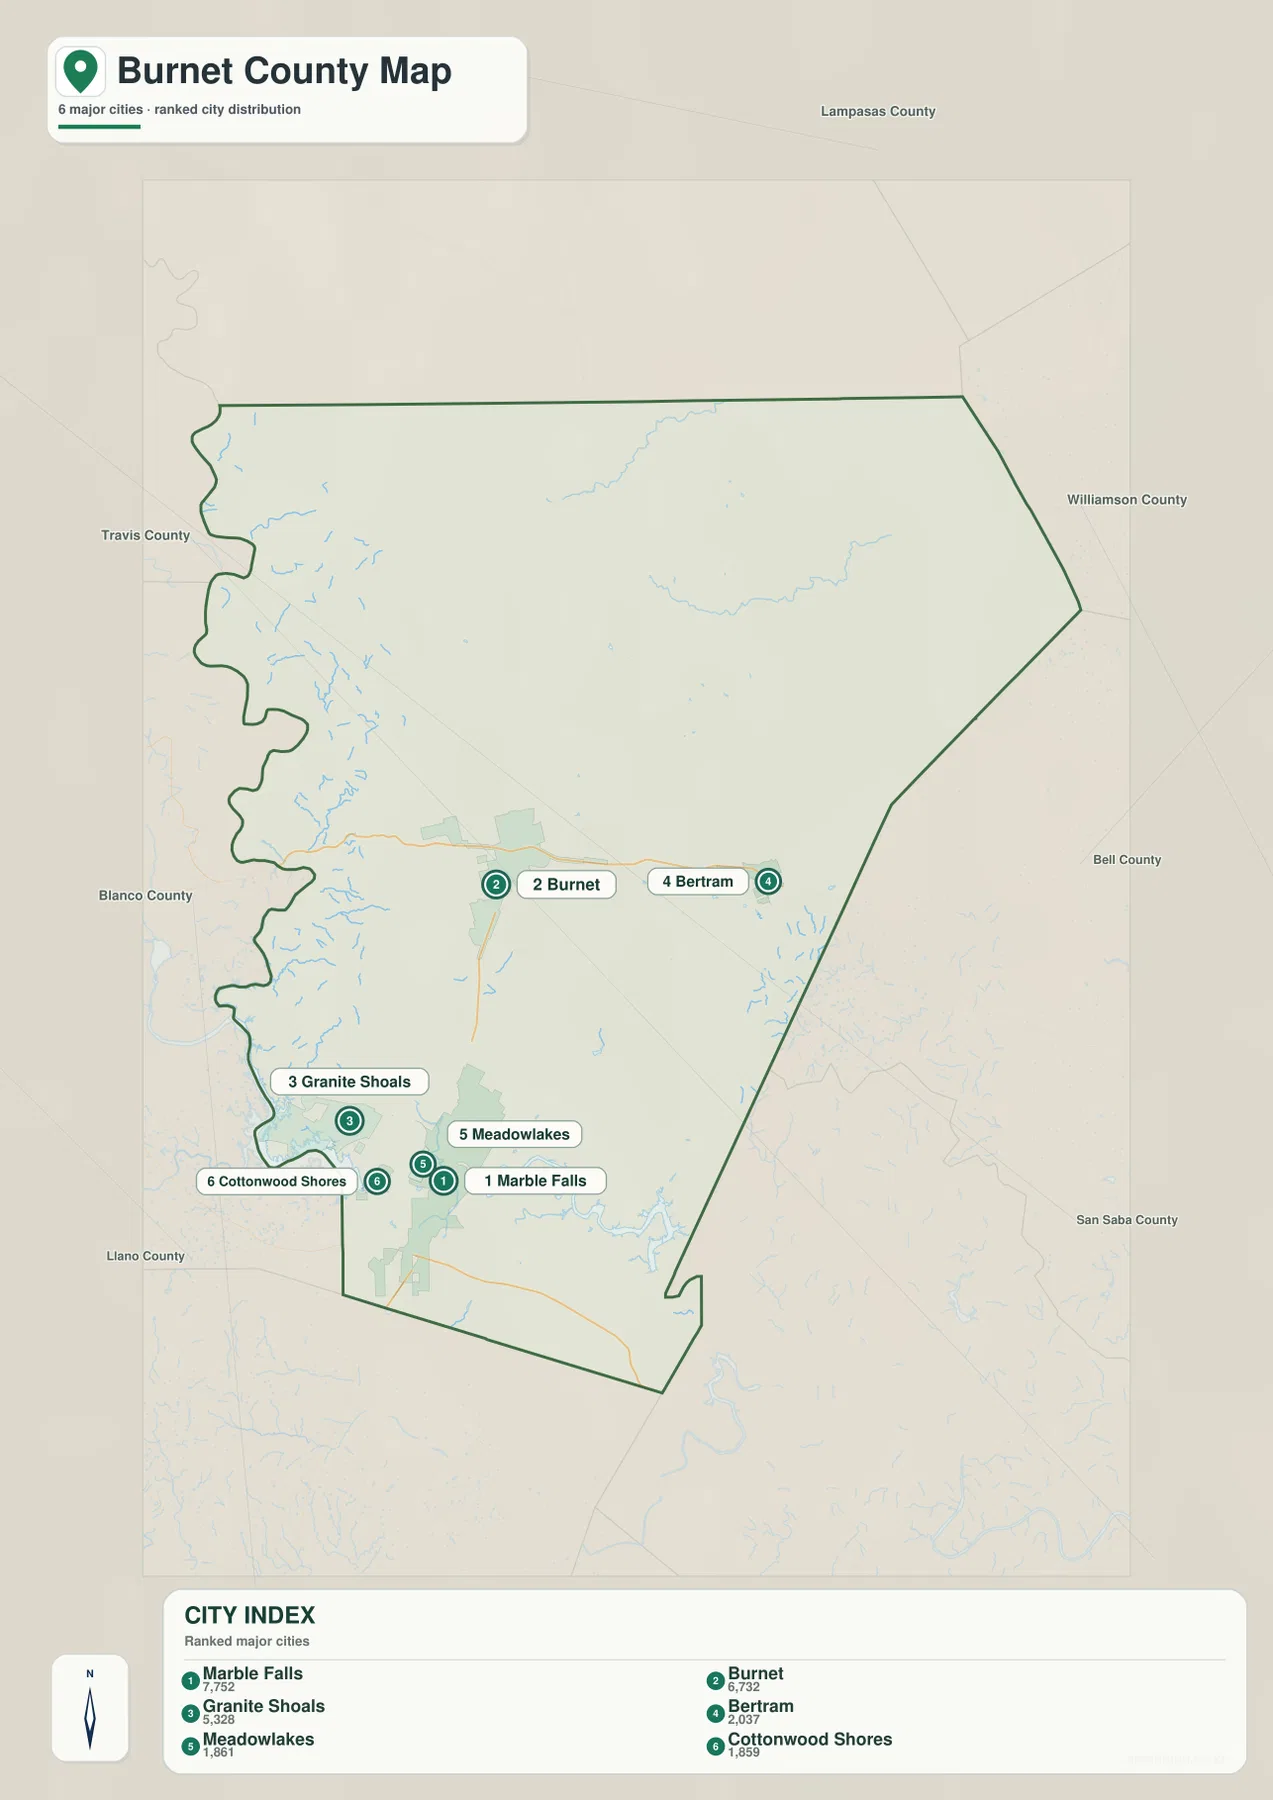
The location pattern is just as useful as the ranking. Burnet and Bertram occupy separate positions across the central part of the county, while Marble Falls, Granite Shoals, Meadowlakes, and Cottonwood Shores sit much closer together in the south and southwest. The concentration around Marble Falls is therefore visible without needing a dense street map. When the city map is compared with the general map, U.S. 281 helps explain the connection between Burnet and Marble Falls, while State Highway 29 provides the clearer east-west link toward Bertram.
The frame around the city map names Lampasas County, Williamson County, Bell County, Travis County, Blanco County, Llano County, and San Saba County. The safest use of those labels here is to recognize the neighboring county context shown by the supplied graphic rather than infer additional details that are not printed on it. They are particularly helpful when tracing a road beyond the Burnet County boundary, because a route that leaves the county can be followed toward another labeled area instead of seeming to stop at the border.
U.S. 281 and State Highway 29 organize most first readings
For practical orientation, U.S. 281 and State Highway 29 are the two most useful roads to locate first. U.S. 281 runs through Burnet and continues south toward Marble Falls, linking the central and southern settlement areas. State Highway 29 crosses through Burnet and Bertram, giving the county a strong east-west reference. Because the roads meet near Burnet, a visitor can use that junction to judge whether another place lies toward the lake country, toward Bertram, or toward the less densely labeled northern part of the county.
Other numbered routes add detail without replacing that basic framework. U.S. 183 is shown near Briggs in the northeast, and the southern edge includes route numbers 191 and 71 near Double Horn and the Spicewood Airport label. These roads matter most after the main U.S. 281–SH 29 pattern is understood. For a printed reference map or trip-planning worksheet, that reading order keeps the map from becoming a list of route numbers and instead connects each road with an identifiable town or edge of the county.
The road network also makes more sense once water and relief are considered. Numerous streams cross the county, and the elevation map shows substantial differences between high ridges and lower corridors. Roads do not pass through a blank, flat surface; they move through a landscape of hills, narrow valleys, and lake edges. Comparing the road map with the water and elevation views is therefore more informative than judging road spacing from the general map by itself.
Creeks and San Gabriel River branches cut across the interior
The water map supplies names that are difficult to see in the more general county view. South Mesquite Creek and South Rocky Creek appear in the northern part of the county. Russell Fork San Gabriel River runs across the central-to-eastern interior, while South Fork San Gabriel River is labeled farther south. Bear Creek is shown near that southern branch. In the southwest, the map adds Mill Creek, Backbone Creek, Dry Branch, Hamilton Creek, Sycamore Creek, and Double Horn Creek, revealing a much denser network of small drainage lines than the county road map alone suggests.
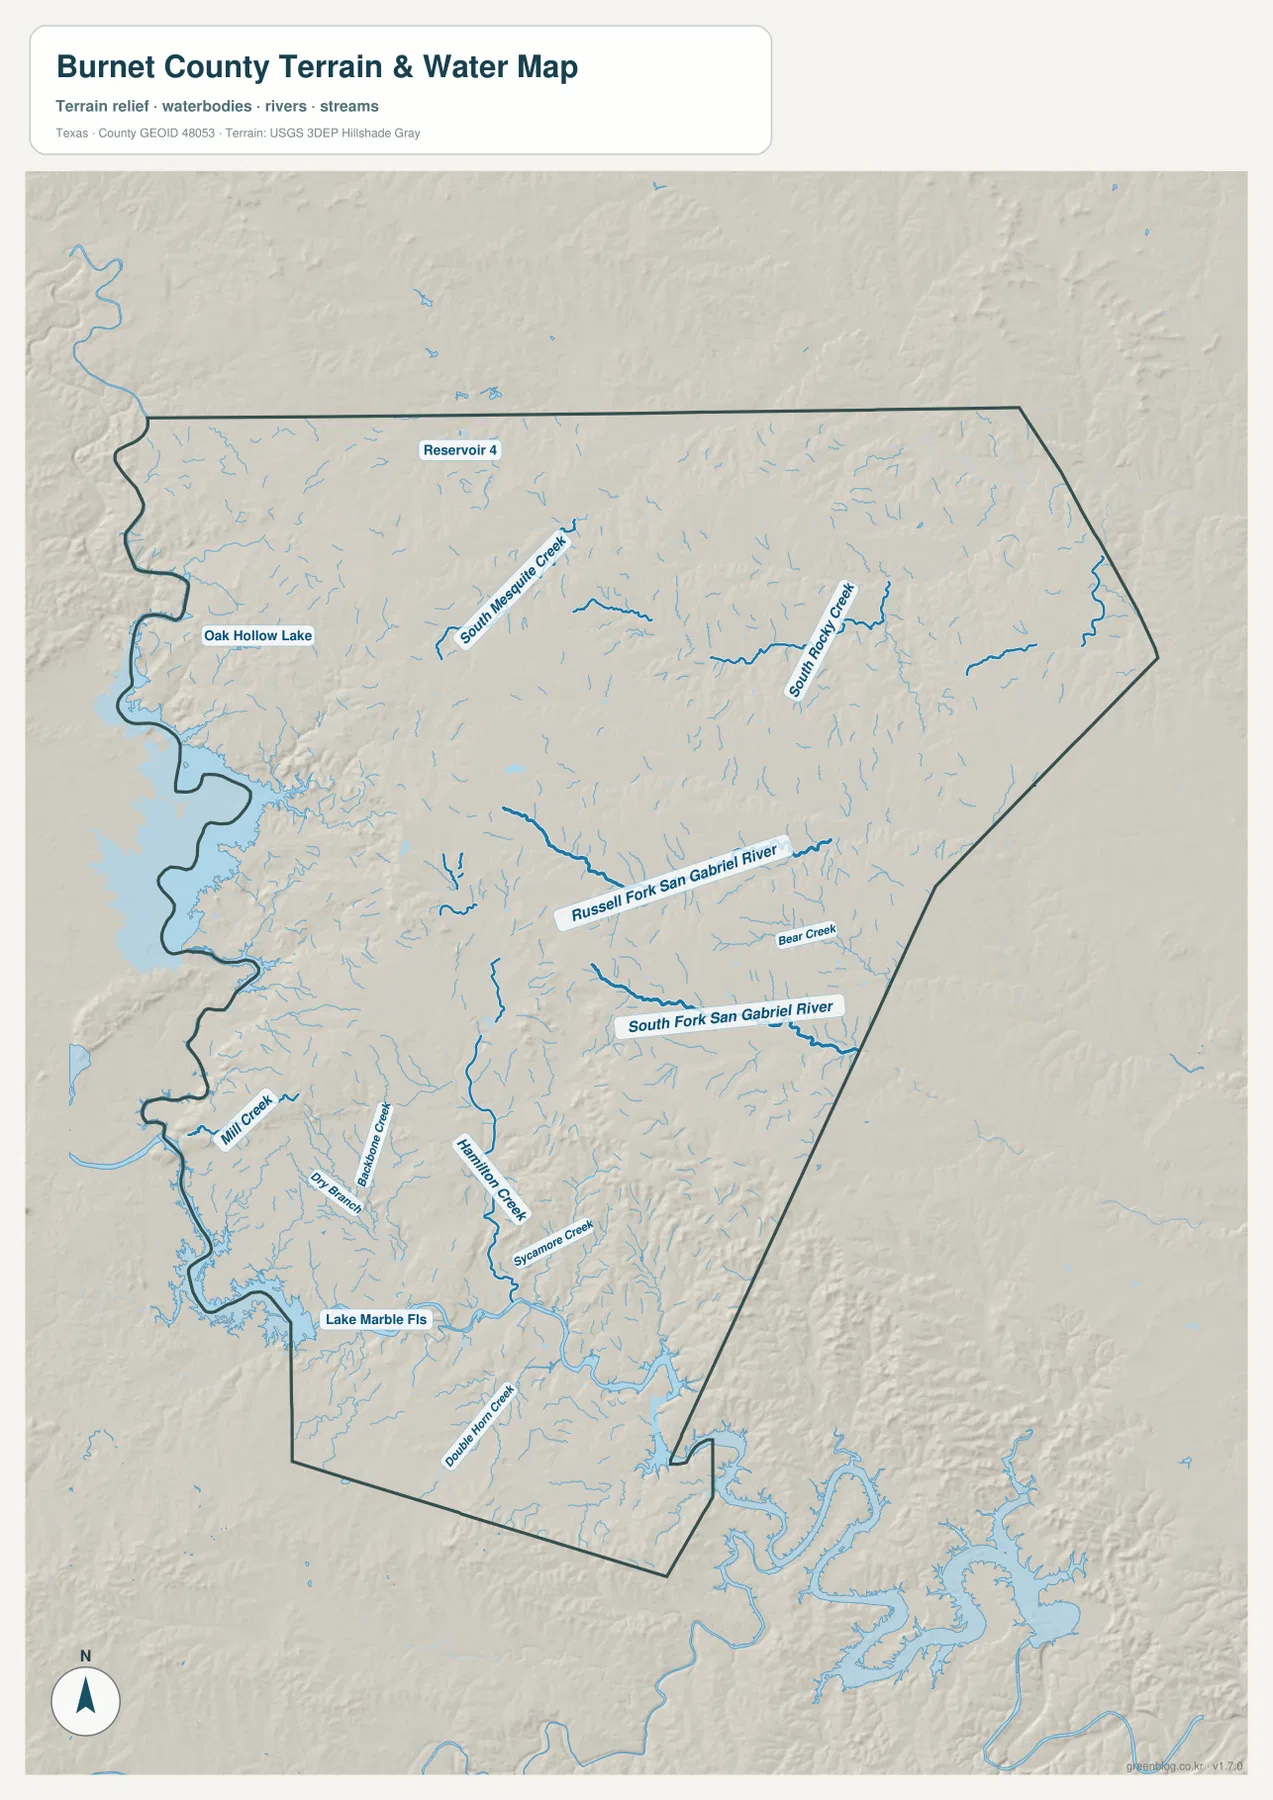
Lake Marble Falls is labeled in the southwest, Oak Hollow Lake appears near the western side, and Reservoir 4 is marked in the north. The large western water edge is especially prominent, and the separate county map places Buchanan Dam along that side. Taken together, those details make water a major organizing feature for the western and southern portions of the county. The close spacing of Marble Falls, Granite Shoals, Highland Haven, and other southern labels also becomes easier to understand when their positions are compared with the lake and stream network.
This water map includes shaded terrain beneath the blue waterways, which helps show that many streams occupy narrow lower corridors between higher surfaces. The channels do not all run in one direction, and the smaller creeks branch through several parts of the county. For a classroom exercise, local overview, or map-reading project, choosing one town and then tracing the nearest named creek is a more concrete way to explain the landscape than simply saying the county contains hills and lakes.
Elevation changes are strongest across the western and central hills
The elevation map gives a numeric range that can be compared directly with the shaded terrain. Its legend states an actual elevation range of 208 to 489 meters and a mean of 352 meters. Browns and darker tan tones mark higher ground, while green areas represent lower elevations. The strongest high-relief band appears across much of the western and central part of the county, with a series of ridges and dissected slopes rather than one isolated summit.
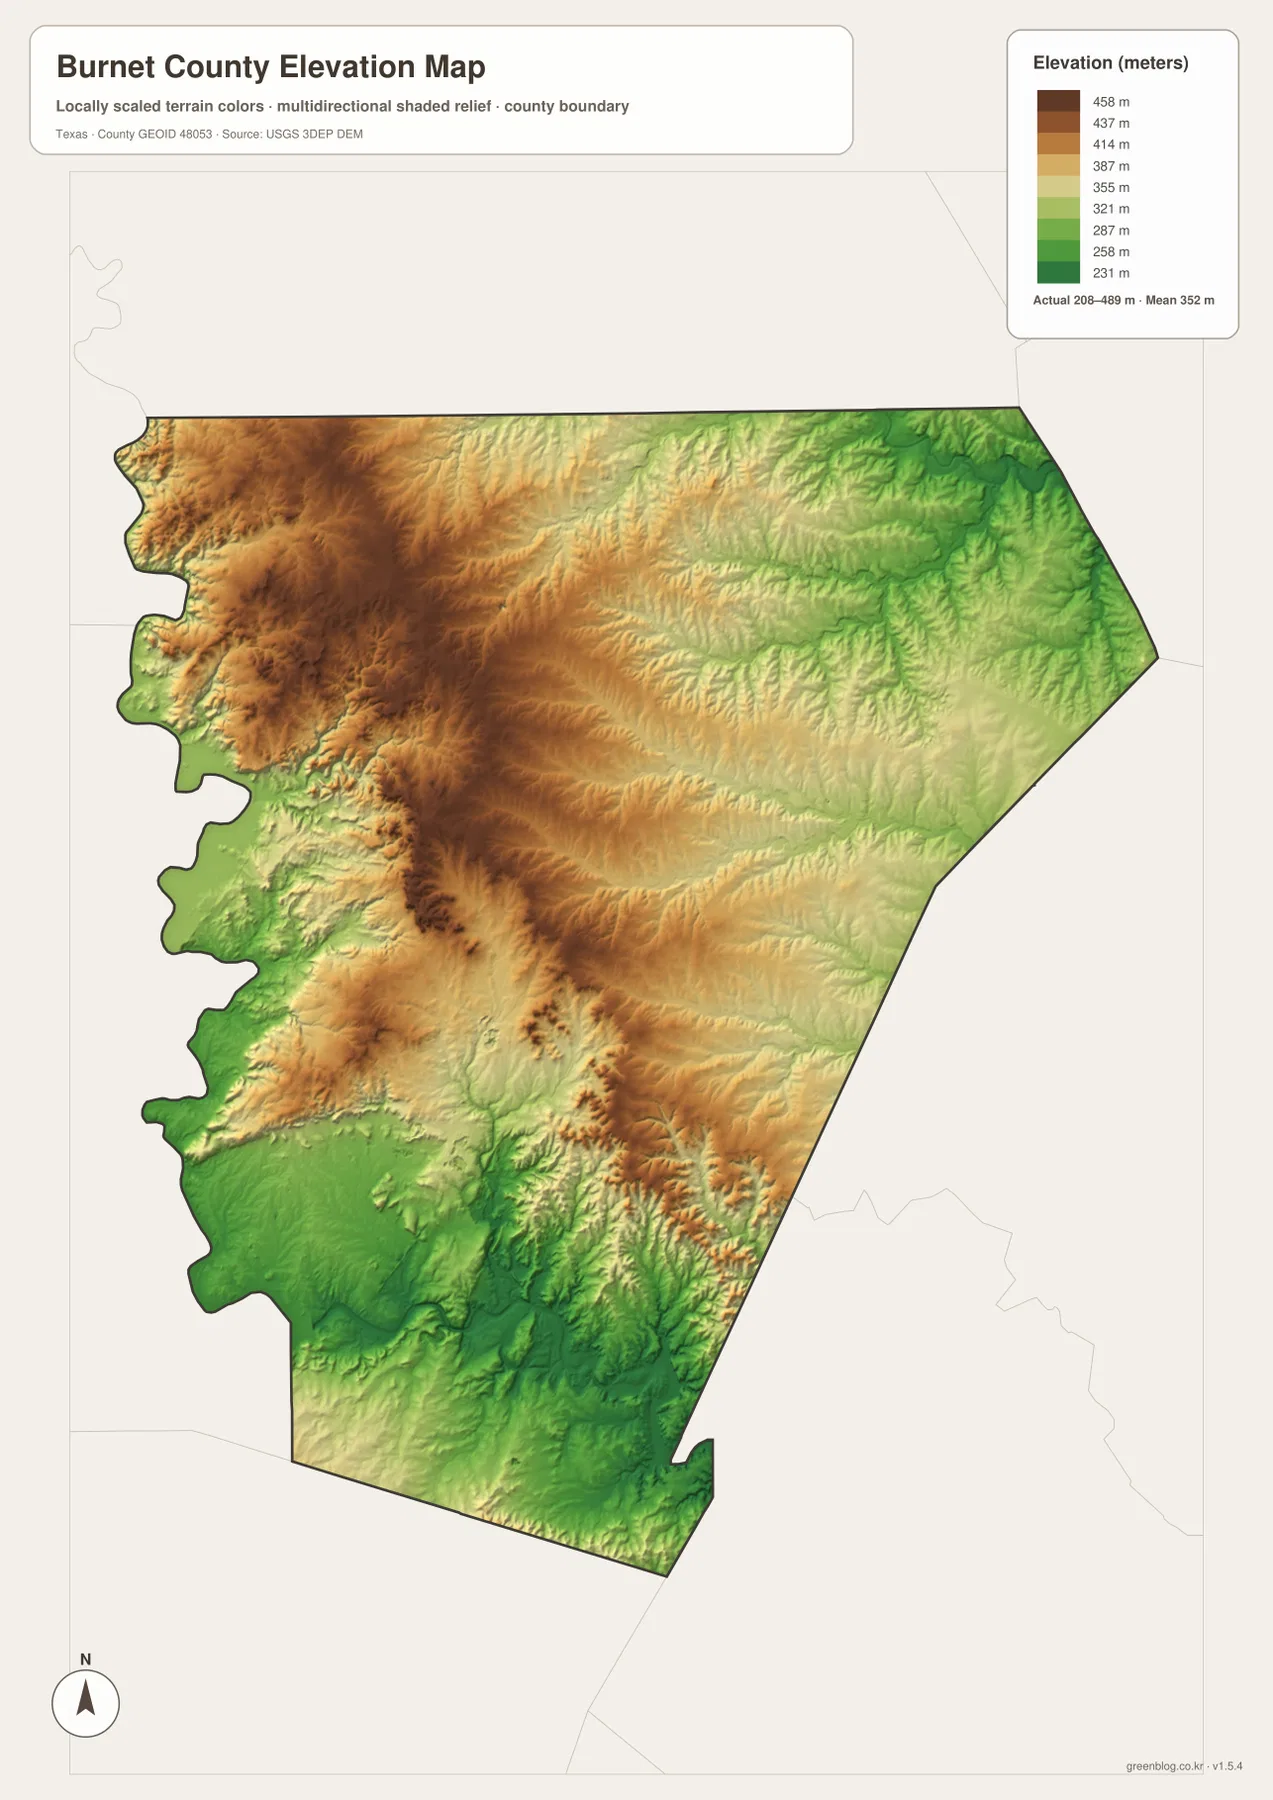
Lower green terrain is more extensive toward the eastern side and appears again along portions of the south, although the southern landscape still contains ridges and incised channels. This means the county should not be described as simply sloping in one direction. Instead, the map shows alternating high and low surfaces, especially where creeks cut through the hillier western half. The water map reinforces that interpretation because many of its named channels occupy the same kinds of narrow valleys visible in the shaded relief.
The elevation colors are best treated as a regional overview. They do not indicate legal land use, hiking difficulty, flood status, or property boundaries. Someone who needs a precise elevation for a parcel, road crossing, or engineering purpose should consult a more detailed official dataset. The reference section below includes the USGS 3D Elevation Program and The National Map Viewer for that purpose.
Comparing the four views keeps place names tied to real features
A useful sequence begins with the general county map. Locate Burnet, Marble Falls, Bertram, U.S. 281, and State Highway 29, then switch to the city map to see how the six ranked communities are distributed. The water map can then explain which towns sit close to lakes or named creeks, and the elevation map adds the higher ridges and lower valleys around those same places. This approach connects labels instead of treating each map as an unrelated illustration.
Different tasks can also start with different views. A visitor checking roads and facilities will probably prefer the general map, while someone comparing the larger named communities may find the city map faster. The water map is more useful when a river branch, creek, lake, or drainage feature is the main question. For relief and broad terrain differences, the elevation map removes most other labels and makes the 208–489 meter range much easier to see. Printing two maps side by side can be more readable than trying to place every road, city, stream, and elevation class on one crowded page.
The downloadable JPGs are larger than the on-page preview images, making small labels and narrow waterways easier to inspect. They are intended as reference maps based on the supplied map package. If a task requires current legal boundaries, surveying accuracy, engineering elevations, or another authoritative determination, use the appropriate official source in addition to these images.
A quick route through the map starts at Burnet and ends with terrain
If you only have a minute, find Burnet first and follow U.S. 281 south to Marble Falls. Next, return to Burnet and trace State Highway 29 east toward Bertram. Look southwest for Granite Shoals and Horseshoe Bay, then use Buchanan Dam and the broad western water edge as another reference. This short sequence establishes the central roads, the southern city group, and the lake side of the county without requiring every small label to be read.
After that, move to the water map and locate Russell Fork San Gabriel River and South Fork San Gabriel River. Finally, compare the same central and western areas with the elevation map. The shift from green lower terrain to brown higher ridges is much more obvious there, and the stream network can be seen in relation to valleys rather than as isolated blue lines. That layered reading is especially useful for students or visitors who need to explain why Burnet County looks different from a flat road-only diagram.
Frequently Asked Questions
What should I locate first on a Burnet County map?
Start with Burnet near the center and identify U.S. 281 and State Highway 29. Then follow U.S. 281 south toward Marble Falls and State Highway 29 toward Bertram. Those three places and two roads provide a clear framework for the rest of the county.
Which maps are best for comparing waterways with terrain?
Use the water map and elevation map together. The water view labels the San Gabriel River branches, several creeks, Lake Marble Falls, and other water features, while the elevation view shows an actual range of 208–489 meters with a mean of 352 meters. Comparing them makes it easier to see streams in relation to higher ridges and lower valleys.
What is included in the downloadable ZIP?
The ZIP contains four high-resolution A3 JPG images: a county map, city map, water map, and elevation map. The larger files are intended for visitors who need more detail than the page previews provide.
Map File Information
The download ZIP contains four high-resolution A3 JPG files for Burnet County: the county map, city map, water map, and elevation map. Use the larger files when you need clearer labels for printing, classroom material, personal reference, or close comparison.
- Printable Size: High-resolution A3 originals
- File Type: ZIP containing 4 JPG images
Related Maps
Sources and Reference Data
The geographic descriptions on this page are based on the Burnet County images and asset information supplied in the ZIP package. For more detailed boundary, hydrography, and elevation data, the official resources below provide additional reference material.
- USGS The National Map Viewer — an official map viewer for checking geographic layers such as terrain, hydrography, roads, and boundaries.
- U.S. Census Bureau TIGER/Line Shapefiles — official geographic files used for boundaries, roads, and related mapping work.
- USGS National Hydrography — official information for rivers, streams, lakes, and other hydrographic features.
- USGS 3D Elevation Program — official elevation data and program information for more detailed terrain work.
More Texas County Maps
Green Map creates custom-edited map images using open geographic data sources such as geoBoundaries, Natural Earth, OpenStreetMap, and government open data.
These maps are edited visual materials, not raw data files, and are provided for education, documents, presentations, and graphic reference.