Download the high-resolution A3 JPG map ZIP for Rock Island County directly from this page. The archive contains the same road-and-boundary, major-city, terrain-and-water, and elevation views shown below, while the embedded WebP versions are sized for faster reading in a browser. The county is especially useful to compare on several views because the Moline–Rock Island urban area, the long Mississippi River edge, the Rock River corridor, and the higher southern interior occupy very different parts of the same county.
A good starting point is the close pair of Rock Island and Moline. East Moline and Silvis extend the urban area to the east, while Milan and Coal Valley sit to the south. From there, the county narrows and reaches a long way north along the Mississippi River past Hampton, Rapids City, Port Byron, and Cordova. Looking south from the urban core produces the opposite impression: large community labels become less frequent, but tributary valleys and higher ridges become much more prominent.
Table of Contents
The Moline–Rock Island belt is the main map anchor
On the general county map, Rock Island and Moline form the most obvious center of activity. East Moline and Silvis continue eastward from that pair, Milan lies just south of Rock Island, and Coal Valley sits southeast of Moline. The road network is densest in this zone, and the built-up areas are much larger than those in the northern river communities. Andalusia to the west and Oak Grove to the south help mark where the compact urban cluster begins to give way to a more open interior.
The numbered routes make the arrangement easier to follow. The supplied map shows I-80, I-88, and I-280 along with routes 84, 92, 94, and 192. Around Moline and East Moline, several routes converge or pass close to the main city area. Route 84 follows the northern Mississippi River side toward Port Byron and Cordova, while 92 and 192 help orient the broader southern and western part of the county. The exact route number is less important than the pattern: roads are tightly grouped around the urban core and become more widely spaced toward the northern and southern edges.
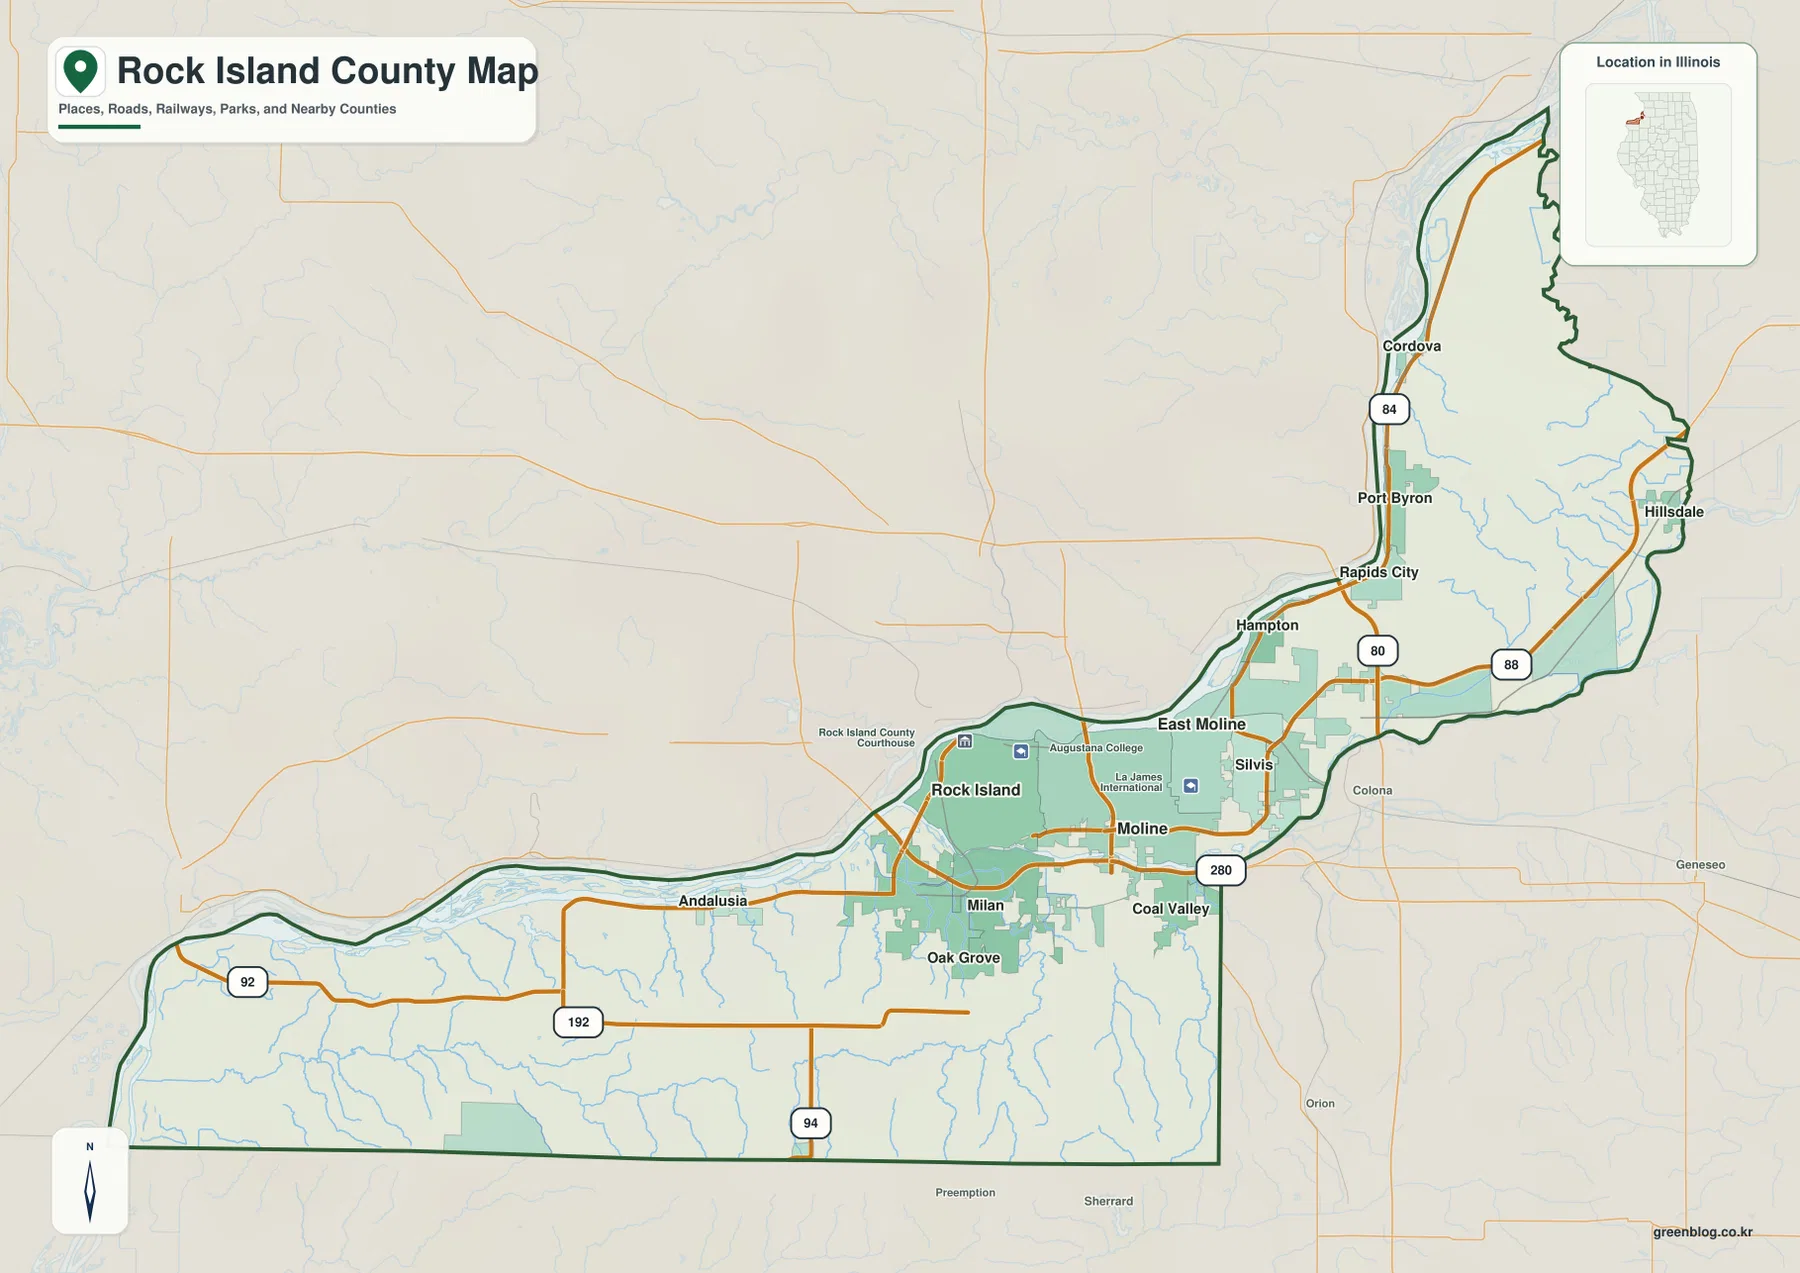
The county shape changes dramatically north of the urban area. Hampton and Rapids City appear first, followed by Port Byron and then Cordova as the boundary stretches along the Mississippi River. Hillsdale provides an inland reference near the northeastern side. This narrow northern extension explains why a map that only focuses on Rock Island and Moline can make the county feel smaller than it really is. The full county view shows that the administrative boundary includes both a compact metropolitan area and a long river corridor with much greater spacing between communities.
The six-city index shows how tightly the largest centers cluster
The city-index map removes most of the small-road detail and highlights six major places. The printed ranking is Moline first, Rock Island second, East Moline third, Silvis fourth, Milan fifth, and Coal Valley sixth. Values printed in the index are 42,197 for Moline, 36,151 for Rock Island, 20,904 for East Moline, 7,955 for Silvis, 5,034 for Milan, and 4,229 for Coal Valley. Those figures are treated here only as values printed on the supplied map rather than as newly verified current population counts.
The positions tell the more useful story. Moline and Rock Island are close enough to function as the central pair, East Moline and Silvis extend that cluster toward the east, and Milan and Coal Valley branch south of the main west-to-east belt. The six markers are therefore concentrated in a relatively small part of a county that is otherwise quite elongated. Port Byron and Cordova are important northern places, but they are not part of this simplified six-city index because the map is designed to emphasize the largest named centers rather than every settlement.
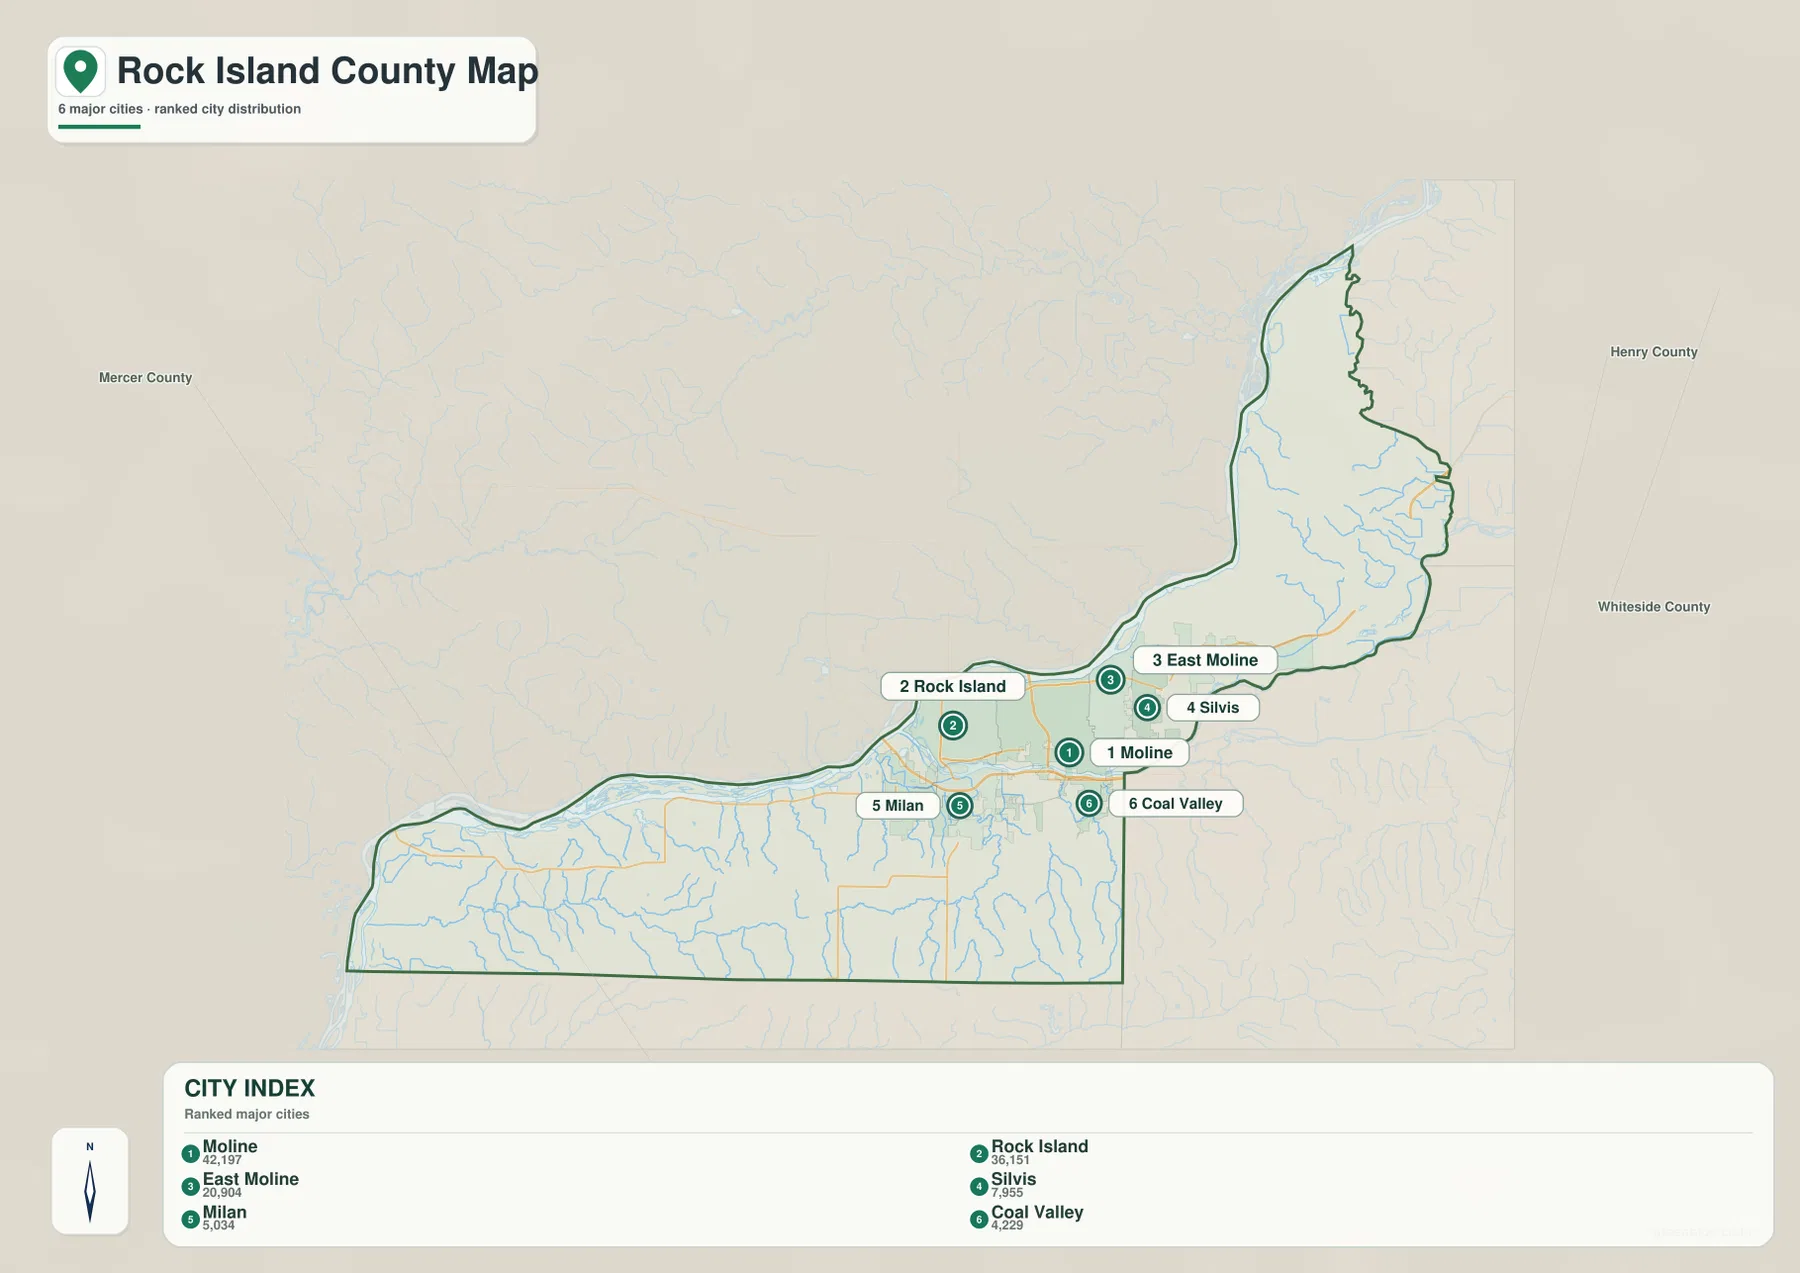
This city view works well as a bridge to the other maps. Once the location of the six major centers is familiar, it becomes easier to see why the Mississippi River dominates the north side of Rock Island and Moline, why the Rock River lies south and east of the core, and why Milan and Coal Valley sit closer to the web of smaller interior tributaries. The general map remains better for locating smaller places and roads, while the city index is faster when the only question is how the major centers relate to one another.
Two large rivers organize a much finer tributary network
The terrain-and-water view is easiest to read by finding the Mississippi River and Rock River first. The Mississippi runs along the western and northern side of the county for a long distance. The Rock River crosses the central part of the county and passes south of the main urban area. Lake George is labeled in the western section and Shooks Pond appears close to the Rock River. These larger water features provide a clear frame before the eye moves to the many smaller creeks inside the county.
Across the southern interior, Copperas Creek is one of the clearest named streams. Fancy Creek and Mill Creek appear farther north, while Case Creek lies closer to the Moline–Coal Valley side of the county. In the northeast, Zuma Creek is prominently labeled, with Canoe Creek and Sanders Ditch nearby. Grouping the water features by area makes the map much easier to use: Copperas Creek in the south, Mill and Case creeks through the central interior, and Zuma Creek in the northeast form three practical reference zones.
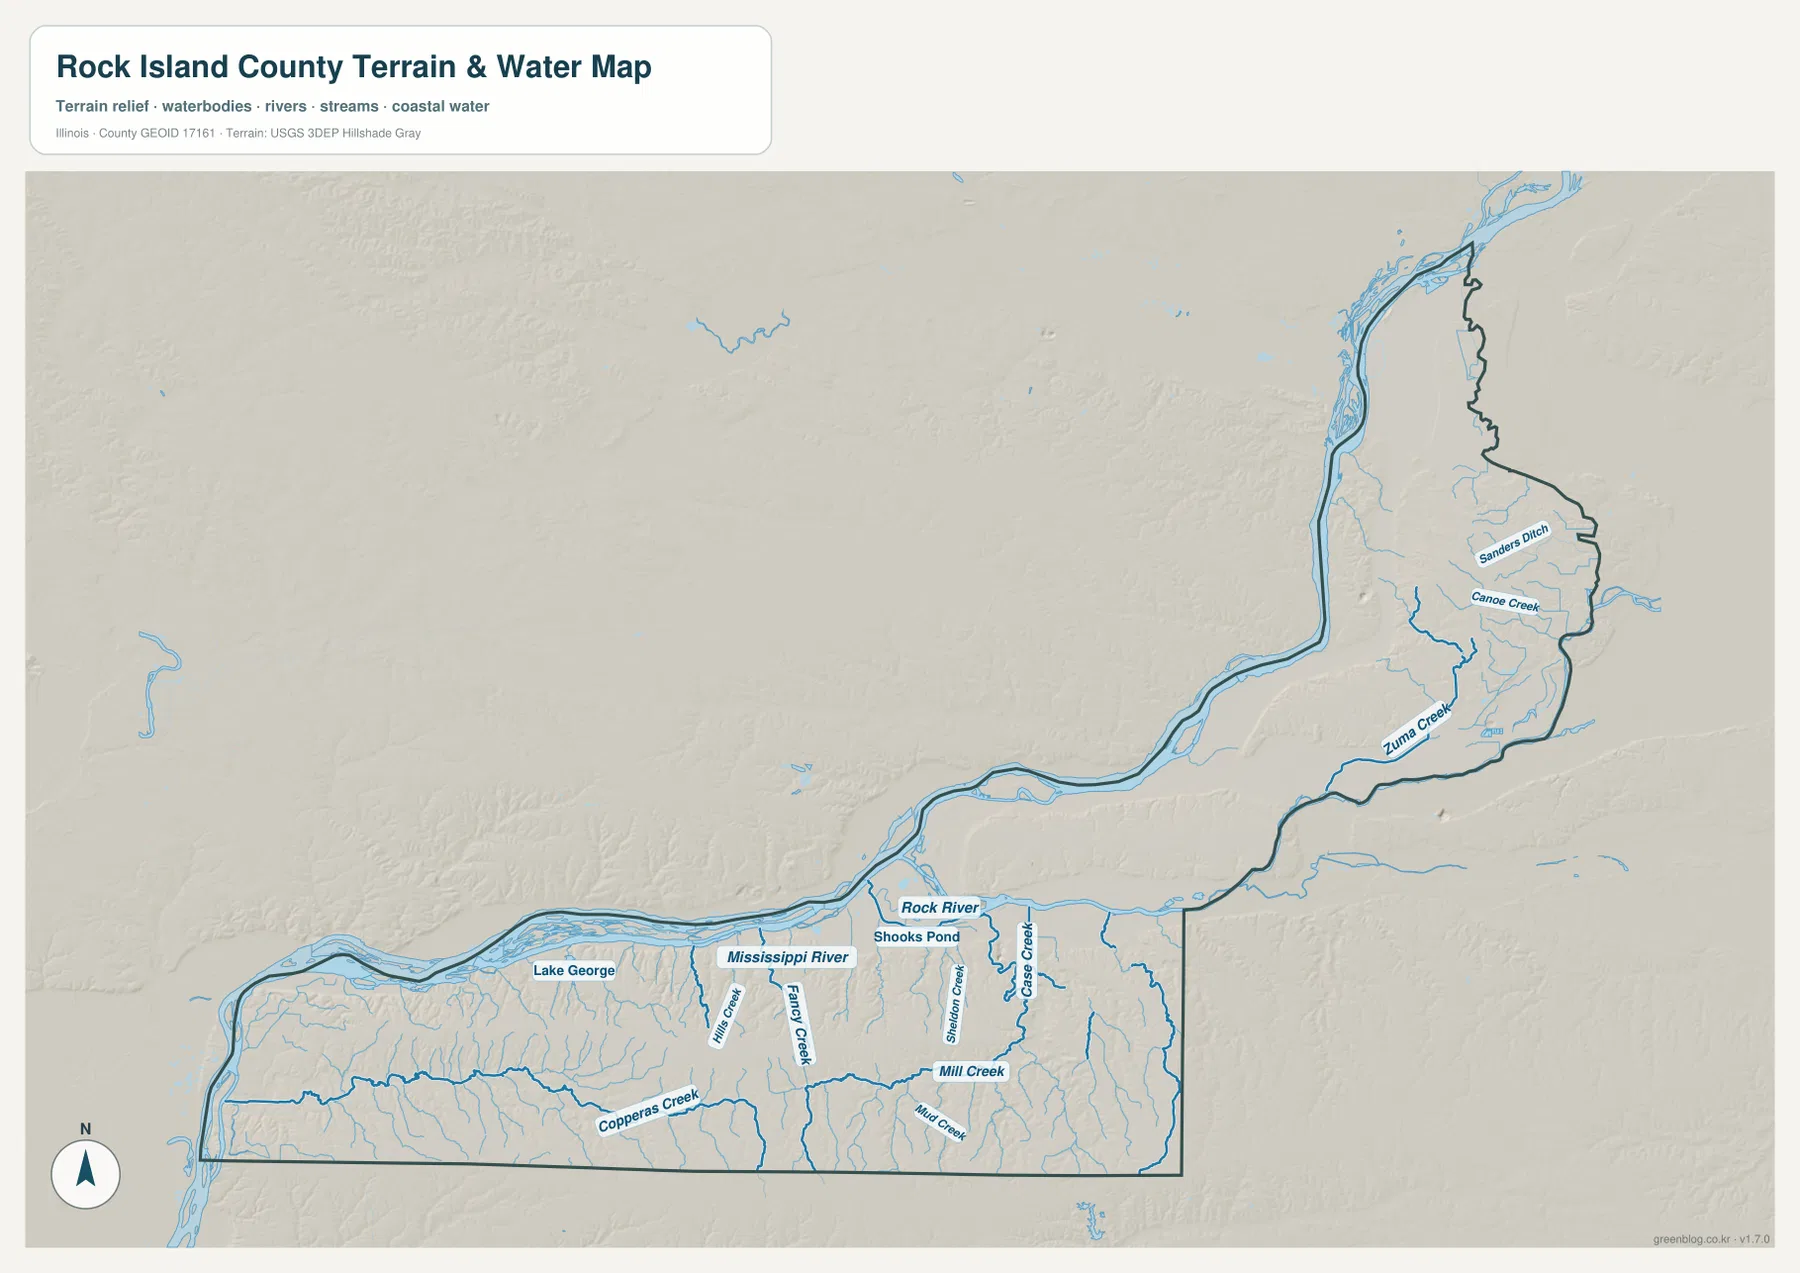
The water map also explains why the county feels different north and south of the city cluster. Rock Island and Moline are closely associated with the two large rivers, but farther south the map becomes a fine network of branching tributaries. The narrow northern section stays close to the Mississippi for much of its length, while the northeastern interior contains several smaller channels before they reach the larger system. This view is intended for general geographic reference; it does not establish flood hazard, water quality, public access, navigability, or legal waterfront boundaries.
River lowlands and southern ridges span about 97 to 248 meters
The supplied elevation map reports an actual range of roughly 97 to 248 meters and a mean near 202 meters. The lowest green tones follow the Mississippi and Rock river corridors, including much of the long northern extension. By contrast, tan and brown colors cover broad parts of the southern interior, where ridges stand well above the large-river lowlands. The difference is strong enough that the county’s physical layout can be understood quickly even without reading every stream or road label.
The southern high ground is cut into many smaller ridges rather than forming a smooth plateau. Tributary valleys create green or light-green channels through the higher brown terrain, especially around Copperas Creek and other southern streams. Similar lower channels appear south of the Rock River and around Zuma Creek in the northeast. Comparing the water map with the elevation layer shows that many of the branching stream lines occupy the same lower corridors that appear as green fingers in the terrain colors.
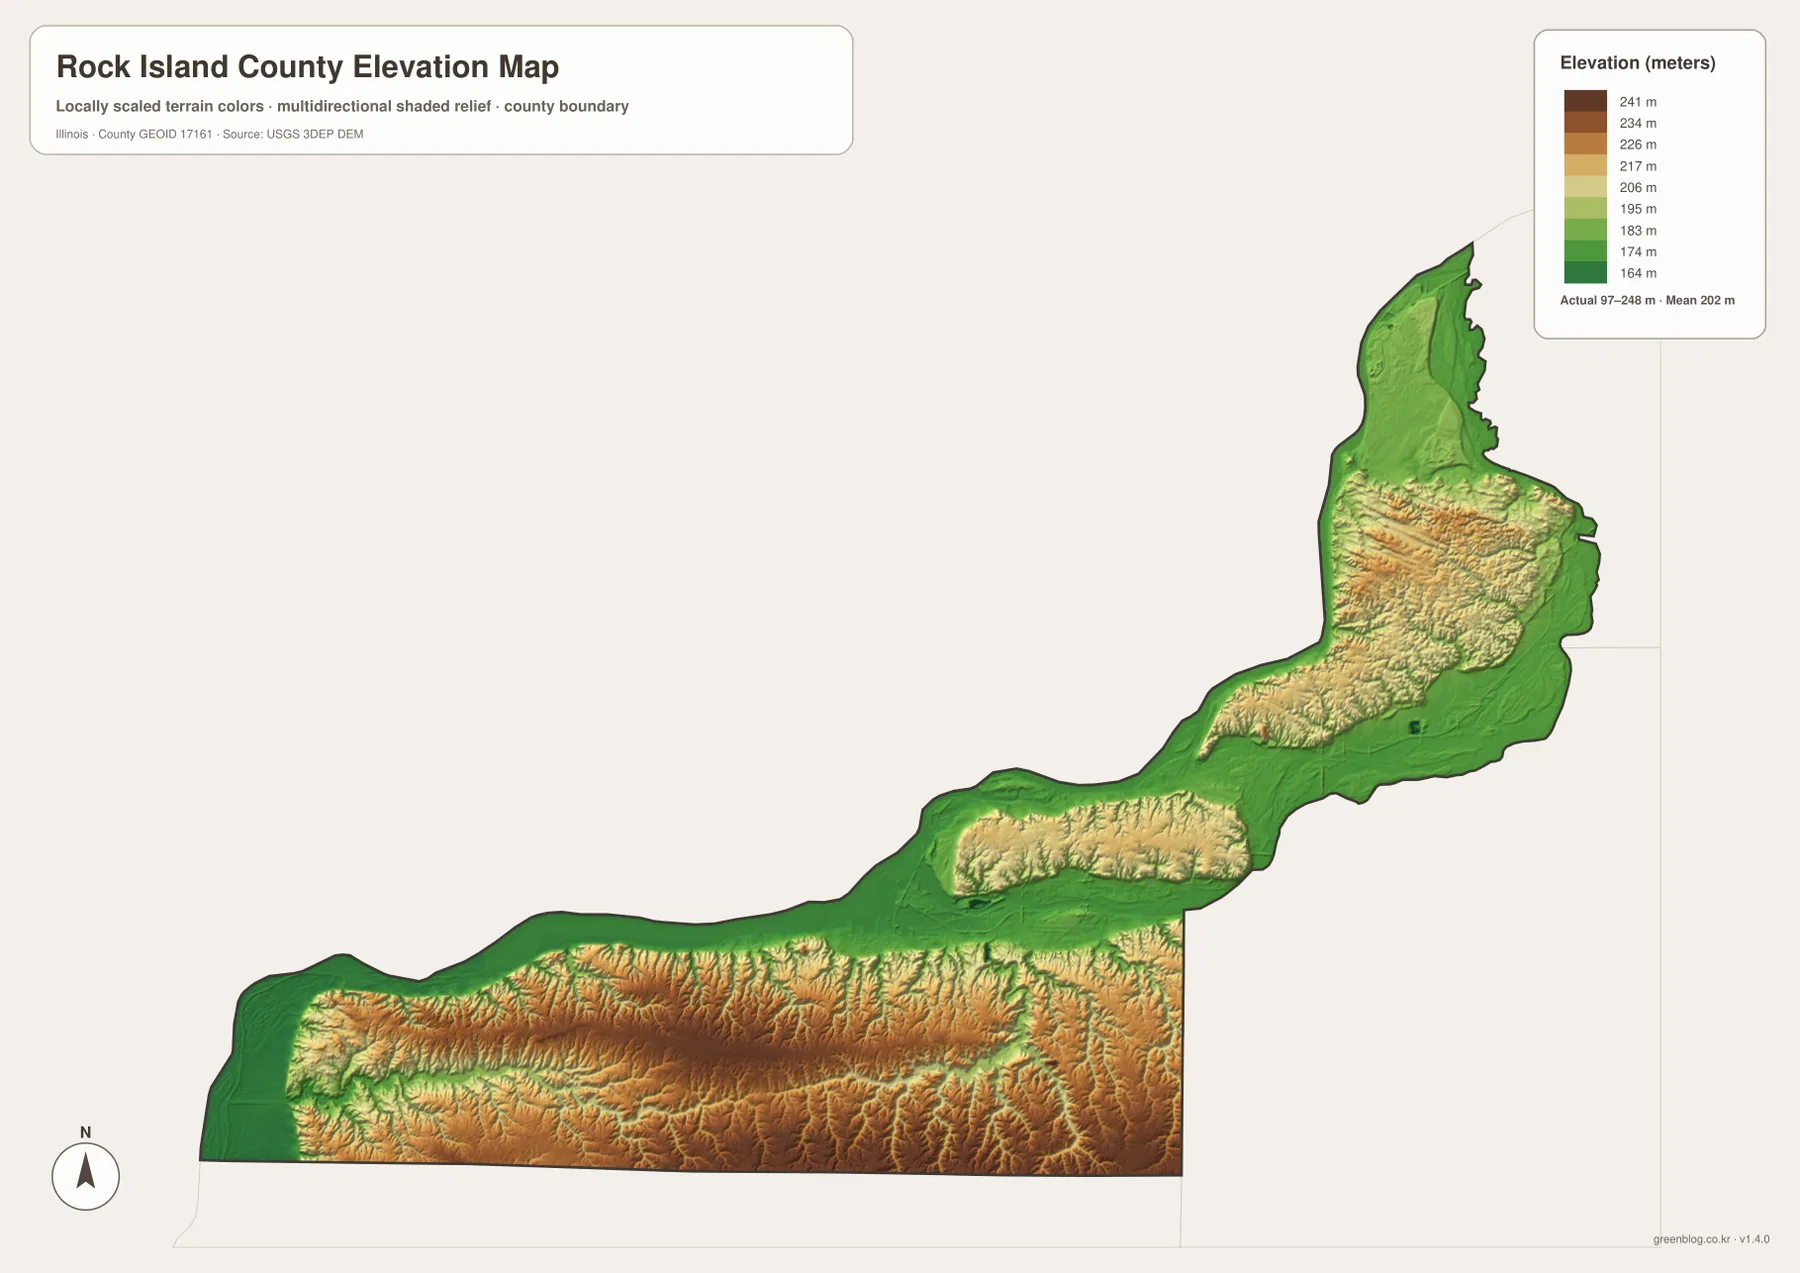
Relating the terrain back to the city map makes the elevation pattern more intuitive. Rock Island, Moline, and East Moline occupy the lower river-influenced part of the county. Milan and Coal Valley sit closer to the transition toward the hillier interior, and higher ground becomes more continuous farther south. Port Byron and Cordova remain close to the Mississippi lowland, although the terrain rises inland from the river. The layer is suitable for county-scale comparison, not for parcel-level surveying, construction design, drainage engineering, or a precise elevation at a single address.
Use each view for a different kind of question
For roads, county shape, and the full set of labeled communities, begin with the general map. If the goal is simply to compare the six largest centers shown in the package, the city index is cleaner. The terrain-and-water view is the best place to trace the Mississippi and Rock rivers and then follow the smaller tributaries into the interior. The elevation map answers a different question by showing where the river lowlands give way to the higher ridges and valleys south of the main urban area.
The browser images are convenient for reading the article, but small labels are easier to inspect in the original JPG files. The ZIP below contains four 3638 × 2572-pixel JPG maps matching the views on this page. They can be used for printing, presentation, or closer inspection of road and water labels. For current traffic, legal parcel boundaries, flood determinations, navigation rules, water-quality decisions, or survey-grade elevation, use the appropriate current official source instead of these general-reference maps.
Frequently Asked Questions
Where is the main urban cluster in Rock Island County?
Rock Island and Moline form the central pair, with East Moline and Silvis extending eastward and Milan and Coal Valley lying to the south. The six-city index makes this compact cluster especially easy to compare against the county’s much longer northern extension.
Which map shows the Mississippi River and Rock River together?
The terrain-and-water map shows both major rivers in the same county view. It also labels Lake George, Shooks Pond, Copperas Creek, Mill Creek, Case Creek, Zuma Creek, and other smaller channels. It is a geographic reference map rather than a flood, navigation, or legal-water-boundary product.
What elevation range is shown on the Rock Island County elevation map?
The supplied elevation layer reports an actual range of about 97 to 248 meters and a mean near 202 meters. Lower terrain follows the two large river corridors, while the broadest higher ridges occur in the southern interior.
Map File Information
The ZIP contains high-resolution A3 JPG versions of the Rock Island County road-and-boundary map, major-city index, terrain-and-water map, and elevation map.
- Printable Size: 3638 × 2572 pixels each
- File Type: ZIP containing 4 JPG files
Related Maps
Sources and references
- Rock Island County official overview – county location and regional background
- Rock Island County Forest Preserve District – county parks, preserves, and natural areas
- U.S. Census Bureau TIGER/Line Shapefiles – county boundaries, roads, and place references
- USGS National Hydrography – river, stream, and lake reference
- USGS 3D Elevation Program – elevation and terrain reference
Green Map creates custom-edited map images using open geographic data sources such as geoBoundaries, Natural Earth, OpenStreetMap, and government open data.
These maps are edited visual materials, not raw data files, and are provided for education, documents, presentations, and graphic reference.