Adult educational attainment can look very different when the question shifts from the overall level of schooling to the balance between women and men. For adults age 25 and older, UNESCO Institute for Statistics (UIS) indicator EA.2T8.AG25T99.GPIA compares female and male attainment at the threshold of completed lower-secondary education or higher. The 2023 extract used here contains 86 country and area observations. The measure is an adjusted gender parity index, not the percentage of adults who reached lower secondary.
A GPIA of 1 means the female and male values of the underlying attainment indicator are equal. UIS commonly uses 0.97 to 1.03 as a practical parity interval so that very small differences are not treated as meaningful gender gaps. For an attainment indicator where a higher rate is a favorable outcome, values below 1 indicate relatively lower female attainment, while values above 1 indicate relatively higher female attainment. The adjusted form is designed to make distances on the two sides of 1 more comparable than the ordinary female-to-male ratio.
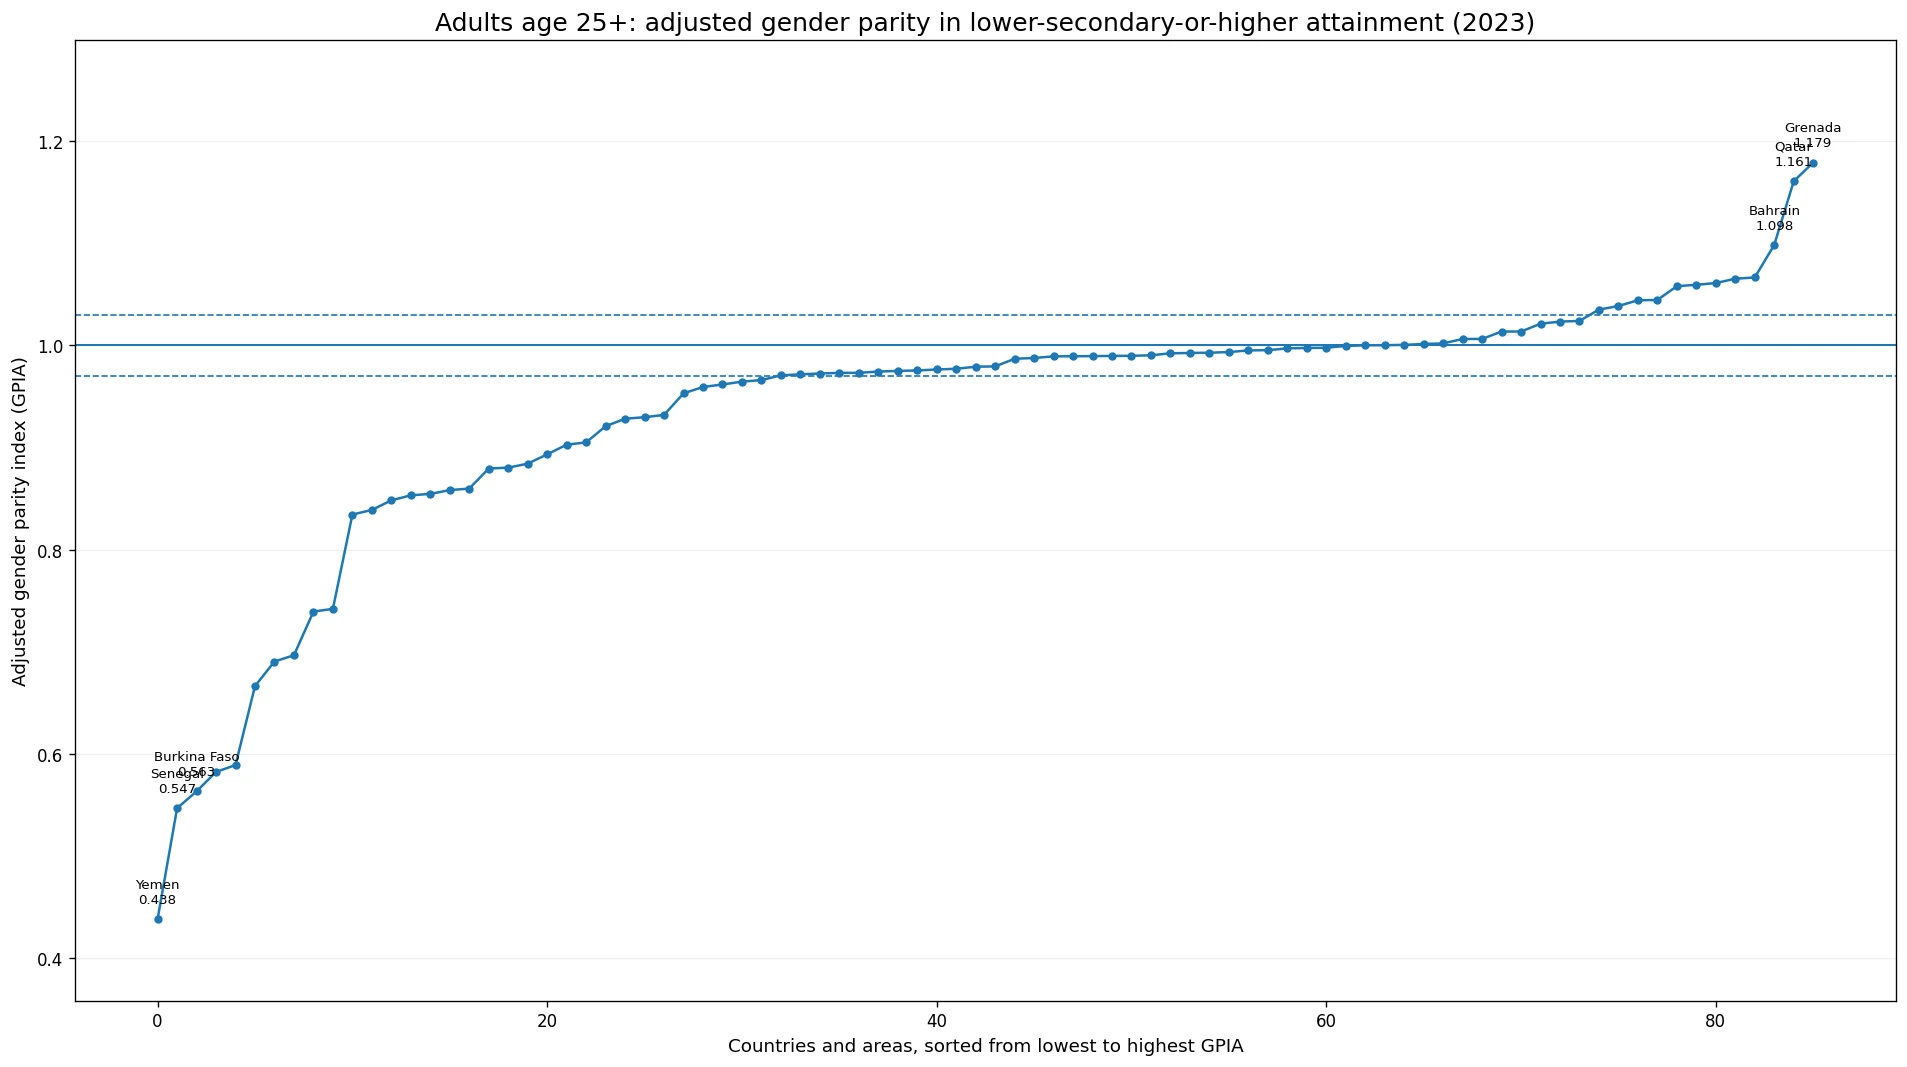
Table of Contents
42 of 86 observations fall within the usual parity interval
Among the 86 observations dated 2023, 42 fall between 0.97 and 1.03, equal to 48.8% of the comparison set. Another 32 observations, or 37.2%, are below 0.97, while 12, or 14.0%, are above 1.03. That means slightly fewer than half of the reporting countries and areas in this dataset are inside the usual parity interval. Among those outside it, the lower-than-0.97 side is much more common than the above-1.03 side.
| GPIA range | Reading for lower-secondary-or-higher attainment | Rows | Share of 86 |
|---|---|---|---|
| Below 0.97 | Female attainment relatively lower | 32 | 37.2% |
| 0.97 to 1.03 | Common UIS parity interval | 42 | 48.8% |
| Above 1.03 | Female attainment relatively higher | 12 | 14.0% |
The median is about 0.979, which lies inside the parity interval, but the simple mean is lower at about 0.938. This difference is a useful description of the distribution: a smaller group of very low observations pulls the mean down more strongly than it moves the median. The 25th percentile is about 0.903 and the 75th percentile is about 1.000. Reading the median, the quartiles and the parity-band counts together is therefore more informative than treating the mean as a single global summary.
These counts are unweighted. Each reporting country or separately reported area contributes one row regardless of population size. They should not be read as the share of the world’s adult population living in or outside gender parity, and they do not represent countries without a 2023 value.
The lowest values are far from parity on the female-lower side
Yemen has the lowest 2023 value in the dataset at 0.438. Senegal follows at 0.547, Burkina Faso at 0.563, Angola at 0.582 and the Democratic Republic of the Congo at 0.589. Lao PDR is 0.666, Gambia 0.690 and India 0.697. Because the underlying attainment measure is a positive outcome, these values indicate that female lower-secondary-or-higher attainment is relatively lower than male attainment.
| Low-end rank | Country or area | 2023 GPIA | Distance from 1 |
|---|---|---|---|
| 1 | Yemen | 0.438 | 0.562 |
| 2 | Senegal | 0.547 | 0.453 |
| 3 | Burkina Faso | 0.563 | 0.437 |
| 4 | Angola | 0.582 | 0.418 |
| 5 | Democratic Republic of the Congo | 0.589 | 0.411 |
| 6 | Lao PDR | 0.666 | 0.334 |
| 7 | Gambia | 0.690 | 0.310 |
| 8 | India | 0.697 | 0.303 |
| 9 | Türkiye | 0.739 | 0.261 |
| 10 | Ghana | 0.742 | 0.258 |
A value such as 0.438 must not be converted into an attainment percentage. It does not mean that 43.8% of women completed lower-secondary education. GPIA summarizes the relationship between the female and male indicator values. To know whether attainment is high or low in absolute terms, the female rate, male rate and total adult attainment rate must be examined separately.
The countries near the low end also span more than one region, so the index by itself cannot support a single causal explanation. Adult attainment among people age 25 and older reflects schooling opportunities accumulated across many cohorts. Historical access to secondary schooling, rural isolation, household resources, conflict, migration, social norms and education policy may all matter, but none of those explanatory variables is contained in this one parity series.
Values above 1 point in the opposite direction, not to a higher score
Grenada records the highest value at 1.179, followed by Qatar at 1.161, Bahrain at 1.098, Honduras at 1.067 and Antigua and Barbuda at 1.065. Nauru, Wallis and Futuna Islands and Uruguay are also above 1.05. For this favorable attainment indicator, values above 1 mean the female attainment rate is relatively higher than the male rate.
| High-end rank | Country or area | 2023 GPIA | Interpretation |
|---|---|---|---|
| 1 | Grenada | 1.179 | Female attainment relatively higher |
| 2 | Qatar | 1.161 | Female attainment relatively higher |
| 3 | Bahrain | 1.098 | Female attainment relatively higher |
| 4 | Honduras | 1.067 | Female attainment relatively higher |
| 5 | Antigua and Barbuda | 1.065 | Female attainment relatively higher |
| 6 | Nauru | 1.061 | Female attainment relatively higher |
| 7 | Wallis and Futuna Islands | 1.059 | Female attainment relatively higher |
| 8 | Uruguay | 1.058 | Female attainment relatively higher |
Those high values are not a ranking of education quality. A value of 1.18 is farther from parity than a value of 1.01 even though it is numerically larger. The purpose of the index is to show direction and distance from equal female and male values, so both low and high departures from 1 deserve attention. The most balanced values are the ones closest to 1, not necessarily the largest numbers.
The adjustment in GPIA matters for this interpretation. A conventional gender parity index starts with the female value divided by the male value. Ratios above 1 are not mathematically symmetric with ratios below 1 and have no fixed upper bound. UIS adjusts the ratio when the female value is higher, creating an index centered on 1 with a 0-to-2 range. This makes a gap on the female-higher side easier to compare with a gap of similar magnitude on the female-lower side.
Many countries are extremely close to 1
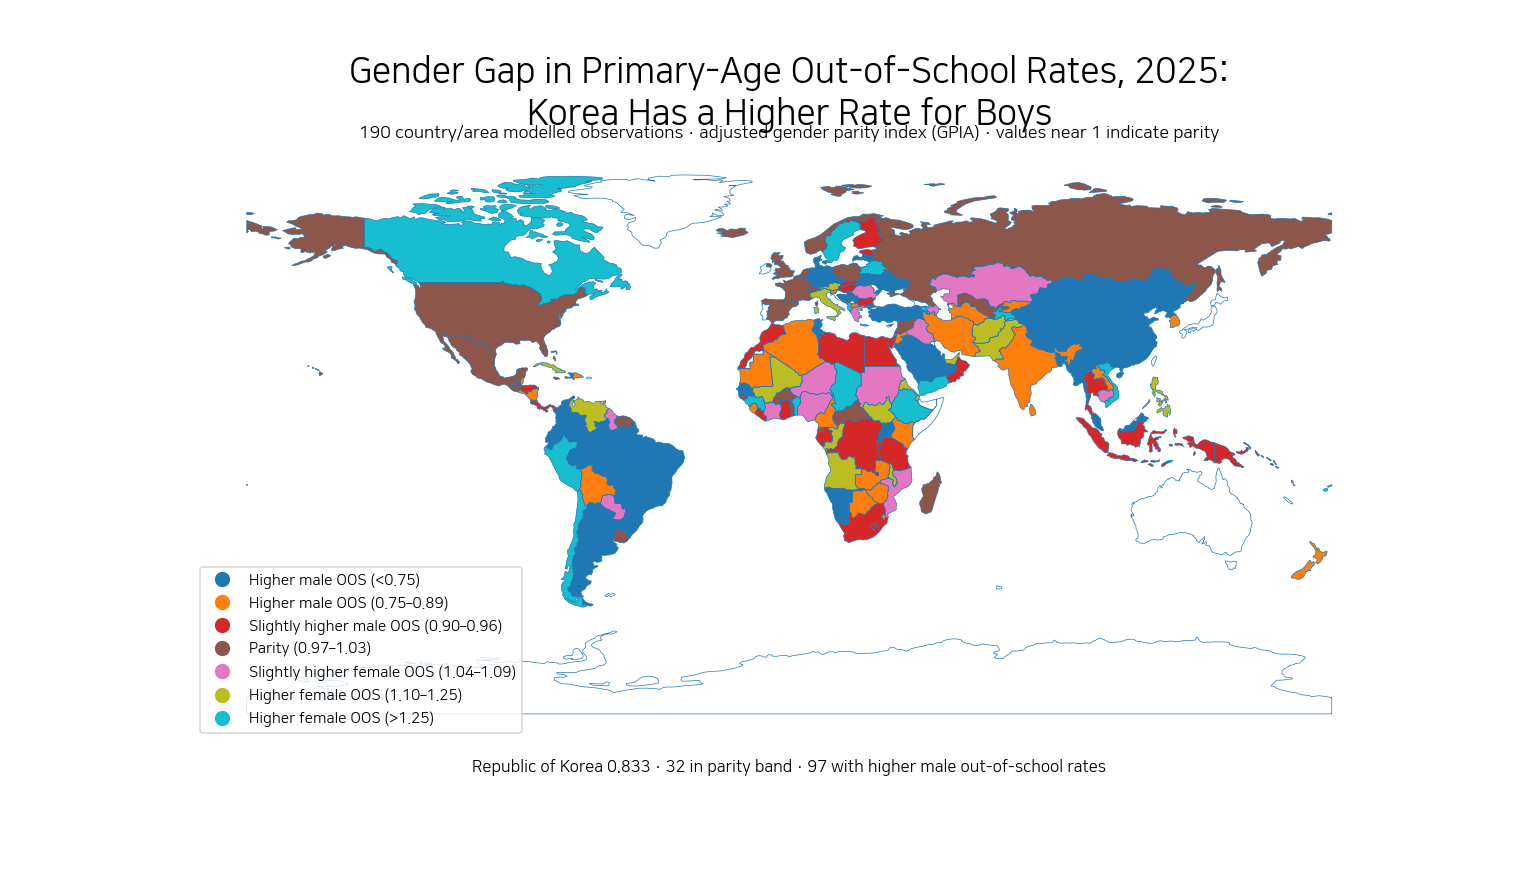
Czechia is 1.0001, Armenia 1.0002, Luxembourg 0.9995, Iceland 1.0005 and Estonia 1.0014. The United States is 1.0019 and Canada 0.9953, both comfortably within the usual parity interval. Brazil is 1.035, just beyond the upper 1.03 boundary. The Republic of Korea is 0.903, below the lower boundary, while India is much farther below at 0.697.
| Selected observation | 2023 GPIA | Parity-band reading |
|---|---|---|
| Czechia | 1.000 | Within |
| United States | 1.002 | Within |
| Canada | 0.995 | Within |
| Brazil | 1.035 | Slightly above 1.03 |
| Republic of Korea | 0.903 | Below 0.97 |
| India | 0.697 | Below 0.97 |
These examples also show why a cross-country parity index should be interpreted as a relative measure. A country can sit almost exactly at 1 while both sexes have modest attainment, and another country can have very high overall attainment but still show a measurable gender difference. Without the component rates, GPIA alone cannot tell which of those situations applies.
The age-25-plus population mixes several generations
The age condition is central to the meaning of this series. Adults age 25 and older include people who completed school recently and people whose schooling took place many decades ago. As a result, the indicator is a stock of accumulated educational attainment rather than a measure of what happened to the current lower-secondary student cohort in 2023.
A country may have greatly narrowed gender differences among younger adults while still showing a sizeable gap in the full 25-plus population because older cohorts carry the legacy of earlier access barriers. The reverse can also occur: current student patterns may be changing in a different direction while the broad adult attainment stock moves only slowly. For evaluating recent policy, matched age groups or cohort-specific attainment would therefore be more informative.
Parity and attainment level answer different questions
Gender parity asks whether female and male attainment rates are similar. Educational attainment level asks how large those rates actually are. The two questions should not be collapsed into one. If female and male attainment are both low but nearly equal, GPIA can be close to 1. If both are high but one remains somewhat higher than the other, GPIA can fall outside the parity interval.
For a fuller country profile, the parity index should be paired with the total lower-secondary-or-higher attainment rate and, where possible, the female and male component rates. That combination distinguishes a country with broad educational attainment and a small residual gender gap from a country with low attainment for both sexes but little relative difference.
GPIA also does not measure learning quality, literacy, test performance, school resources, labor-market outcomes or the quality of credentials. It records relative gender balance in one attainment threshold. Nor can the 86-row set be generalized to every country: missing 2023 observations are missing data, not zeroes.
Comparing education thresholds can show where gaps emerge
Lower-secondary-or-higher attainment sits between more basic primary-or-higher attainment and higher thresholds such as bachelor’s-or-higher attainment. Comparing parity across these thresholds can reveal whether a gender difference is already visible at basic schooling levels or becomes larger at later stages of educational progression.
Such comparisons need matched definitions and years. The number of reporting countries can change from one UIS indicator to another, so differences between article-level averages may reflect coverage as well as real patterns. The strongest comparison follows the same country across the same year and examines the parity index together with the underlying attainment rates at each education threshold.
Data source and calculation
The country values come from UNESCO Institute for Statistics indicator EA.2T8.AG25T99.GPIA for 2023. The series describes the adjusted gender parity index for the share of the population age 25 and older that completed lower-secondary education or a higher level. This analysis uses 86 non-missing national or separately reported area observations. Means, medians, interval counts and ranks are calculated directly from those 86 values and are not population weighted.
UIS defines a parity index around a value of 1 and transforms ratios above 1 in the adjusted version so that disparities can be read more symmetrically. The concept and calculation are described in the UNESCO UIS parity-indices definition. The country observations are available through the official UNESCO UIS data API.
Frequently Asked Questions
What does a GPIA of 1 mean?
It means the female and male values of the lower-secondary-or-higher attainment indicator are equal. UNESCO UIS commonly treats 0.97 to 1.03 as a practical parity interval.
Does a GPIA of 0.8 mean that 80% of women completed lower secondary?
No. GPIA is a relative index comparing female and male attainment rates. The actual attainment percentages must be read from the underlying female and male indicators.
Is a GPIA above 1 automatically better?
No. For this positive attainment indicator, a value above 1 means female attainment is relatively higher. Gender parity is represented by values close to 1, not by the largest value.
Related Articles
Gender parity in primary-or-higher adult attainment (2023)
Gender gap in bachelor’s-or-higher adult attainment (2023)
Lower-secondary-or-higher attainment by country for adults 25+
Green Map creates custom-edited map images using open geographic data sources such as geoBoundaries, Natural Earth, OpenStreetMap, and government open data.
These maps are edited visual materials, not raw data files, and are provided for education, documents, presentations, and graphic reference.