What share of secondary students were enrolled in vocational programmes in 2024? UNESCO Institute for Statistics (UIS) indicator GTVP.2T3.V measures vocational-programme enrolment as a percentage of total secondary enrollment across ISCED levels 2 and 3.
The dataset contains 93 countries and separately reported areas. Bolivia has the highest value at 63.0%, followed by Finland at 43.2%, Honduras at 38.6%, Bulgaria at 35.9% and Austria at 34.4%. The median, however, is only 9.8%, showing a large gap between the upper tail and the middle of the distribution.
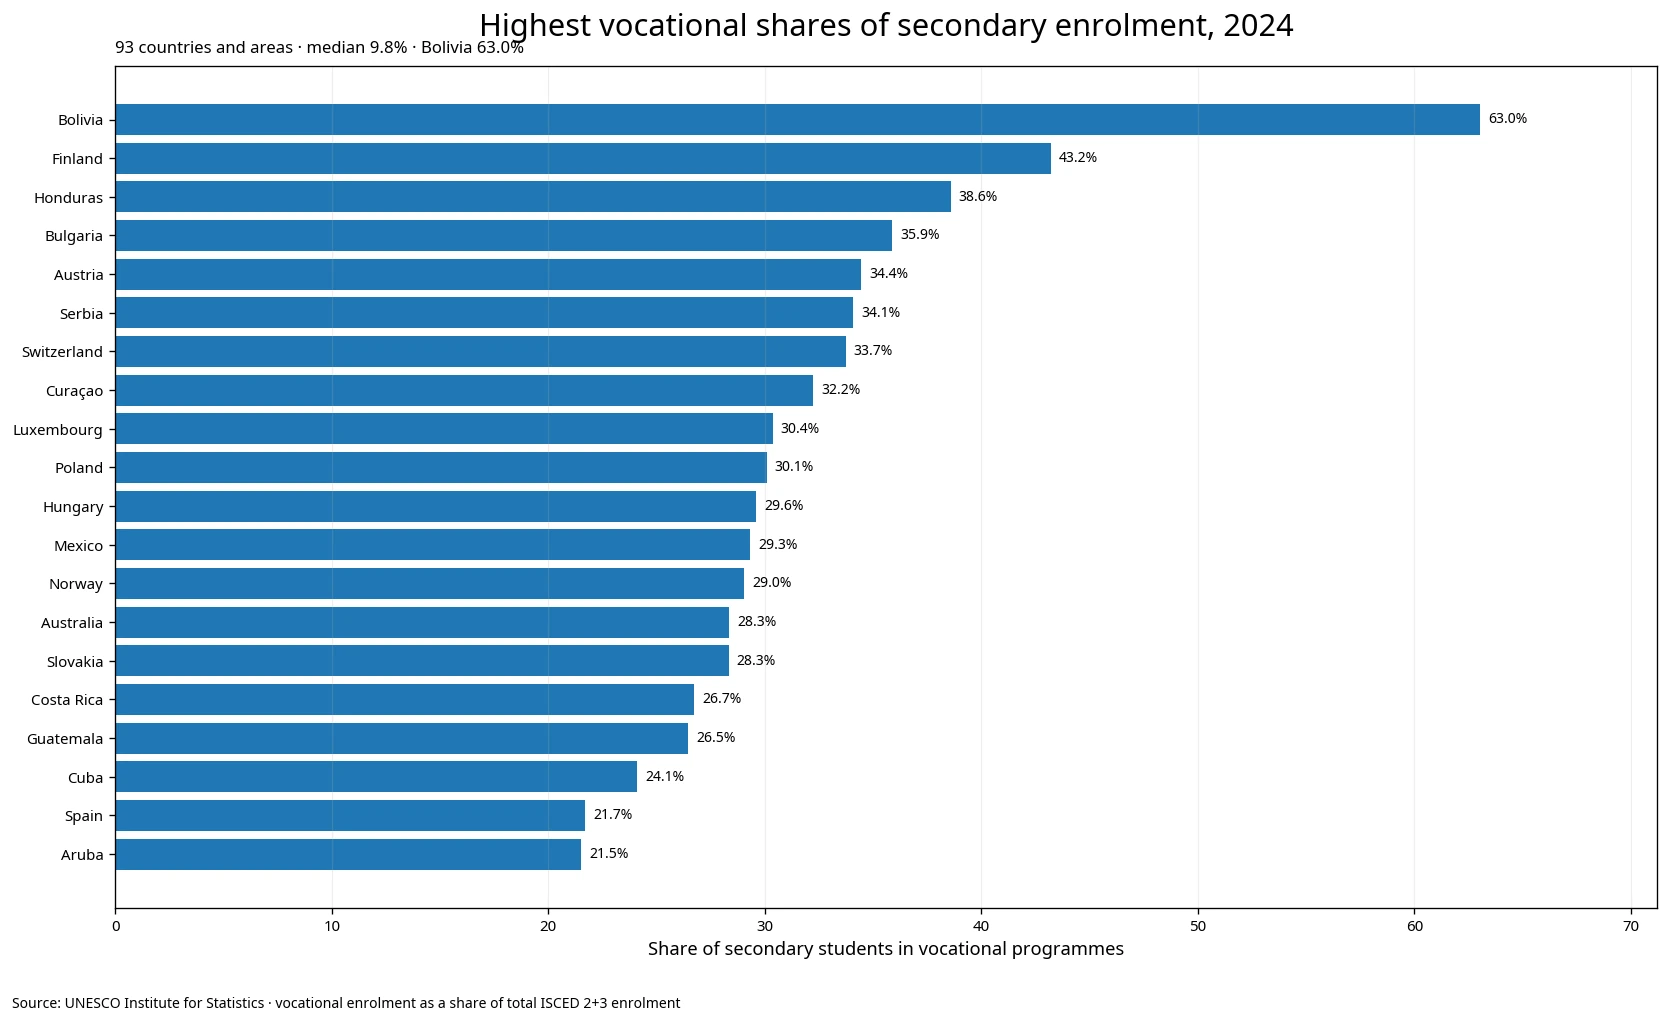
Table of Contents
The percentage refers to vocational programmes within secondary enrolment
UIS defines programme-orientation shares as the number of students enrolled in general or vocational programmes at a given education level divided by total enrollment in all programme orientations at that same level. GTVP.2T3.V applies that concept to secondary education, combining ISCED levels 2 and 3.
A value of 30% therefore does not mean that 30% of all young people in the country are in vocational education. It means that 30% of students who are enrolled in secondary education are in programmes classified as vocational.
Out-of-school youth are outside this denominator. Vocational programmes at post-secondary non-tertiary, short-cycle tertiary, adult or employer-based levels are also outside the indicator. A complete picture of national vocational education requires those other levels as well.
Bolivia is the only observation above 50%
Bolivia’s 63.0% is the highest value and the only observation above one half. Finland is second at 43.2%, followed by Honduras at 38.6%, Bulgaria at 35.9%, Austria at 34.4%, Serbia at 34.1% and Switzerland at 33.7%.
| Rank | Country / area | Vocational share in 2024 |
|---|---|---|
| 1 | Bolivia | 63.0% |
| 2 | Finland | 43.2% |
| 3 | Honduras | 38.6% |
| 4 | Bulgaria | 35.9% |
| 5 | Austria | 34.4% |
| 6 | Serbia | 34.1% |
| 7 | Switzerland | 33.7% |
| 8 | Curaçao | 32.2% |
| 9 | Luxembourg | 30.4% |
| 10 | Poland | 30.1% |
| 11 | Hungary | 29.6% |
| 12 | Mexico | 29.3% |
| 13 | Norway | 29.0% |
| 14 | Australia | 28.3% |
| 15 | Slovakia | 28.3% |
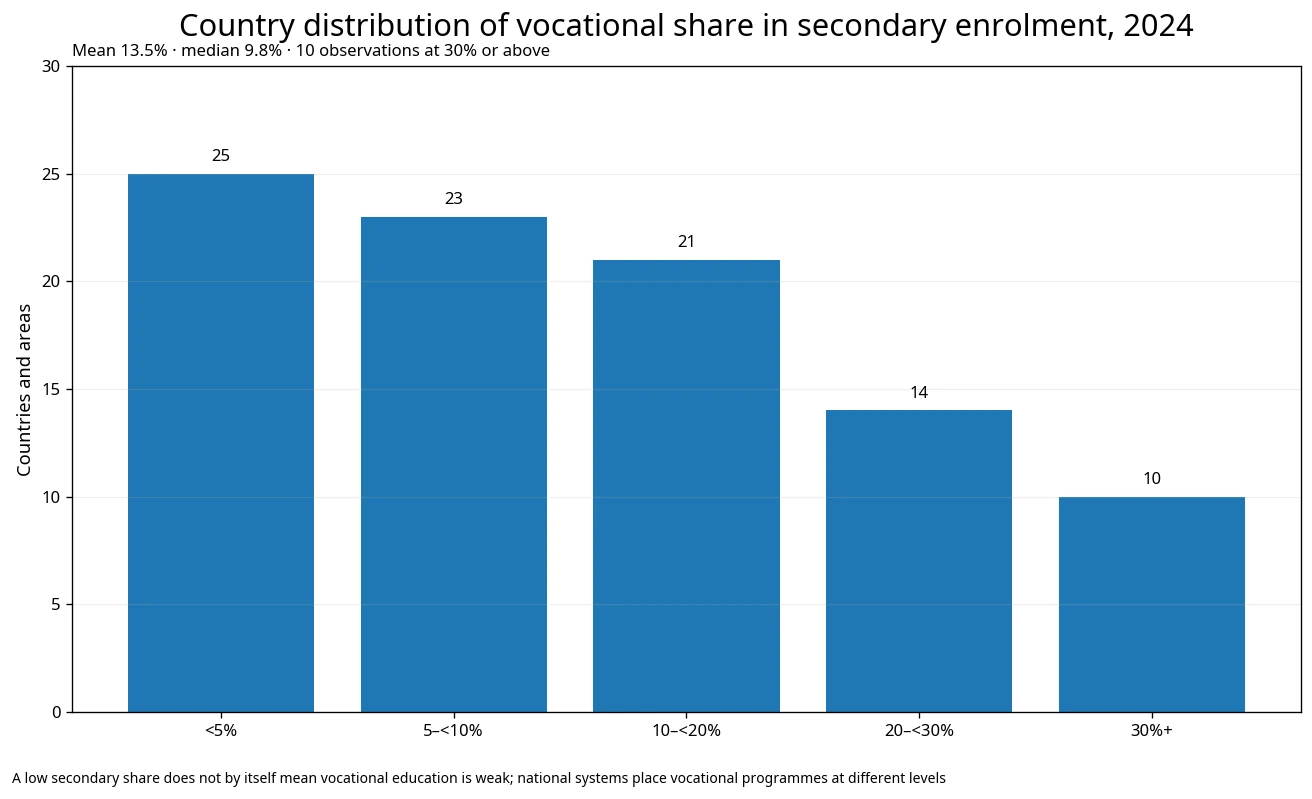
Ten observations are at or above 30%, while 24 are at or above 20%. By contrast, 48 of the 93 observations are below 10%. The dataset therefore contains a relatively small high-vocational-share group and a much larger group in the single digits or teens.
These values describe programme structure, not educational performance. A high vocational share is not inherently better, and a low share is not inherently worse.
The mean of 13.5% is above the median of 9.8%
The unweighted mean is 13.48% and the median is 9.82%. The first quartile is 4.84% and the third quartile is 20.35%, so the middle half of observations lies roughly between 4.8% and 20.4%.
Forty-eight observations are below 10%, including 25 below 5%. Only 10 are at or above 30%. The difference between mean and median reflects a long upper tail created by a relatively small number of high-share systems.
For a skewed distribution like this, the median and band counts describe the typical country more clearly than the mean alone.
Oman, Saudi Arabia and Hong Kong are below 1%
Oman has the lowest observation at 0.19%. Saudi Arabia is 0.70%, Hong Kong SAR 0.71% and Tokelau 0.74%, making four observations below 1%. Qatar, Nepal, Fiji and Chad are also close to the bottom of the distribution.
| Country / area | Vocational share in 2024 |
|---|---|
| Oman | 0.19% |
| Saudi Arabia | 0.70% |
| Hong Kong SAR, China | 0.71% |
| Tokelau | 0.74% |
| Qatar | 1.05% |
| Nepal | 1.22% |
| Fiji | 1.25% |
| Chad | 1.33% |
| Tajikistan | 1.43% |
| Lao People’s Democratic Republic | 1.61% |
| Tuvalu | 1.75% |
| Cambodia | 2.13% |
A low secondary-level vocational share does not prove that vocational education is nationally unimportant. A country may place substantial occupational training at ISCED level 4, short-cycle tertiary education, adult education, apprenticeships or training outside the formal school system.
Likewise, a high share does not automatically imply stronger employment outcomes. The indicator measures enrollment orientation, not job placement, earnings, qualification quality or employer satisfaction.
National education structures limit simple cross-country ranking
UIS explicitly notes that international comparability can be affected by the different ways national secondary and post-secondary systems are organised into general, technical and vocational orientations.
The same occupationally focused learning can be placed at different ISCED levels in different countries. Some systems concentrate vocational pathways in upper secondary, while others rely more heavily on post-secondary non-tertiary or short-cycle tertiary programmes.
For that reason, the 63% observation in Bolivia and the 0.2% observation in Oman should not be read simply as the strongest and weakest vocational-education policies. The structure and classification of the education pathway differ first.
Vocational education is designed around occupation-specific knowledge and skills
UIS defines vocational education as programmes designed for learners to acquire knowledge, skills and competencies specific to an occupation, trade or class of occupations. Vocational programmes may include work-based components such as apprenticeships and can lead to labour-market-relevant qualifications.
That definition explains the programme orientation, but not the programme’s quality. Employment outcomes, wages, completion, employer participation and work-based learning quality require separate evidence.
General and vocational programmes can also share common academic subjects. International statistics classify programmes according to their principal orientation rather than implying that every component is purely general or purely occupational.
The indicator combines lower and upper secondary education
The code 2T3 refers to ISCED levels 2 and 3: lower secondary and upper secondary combined. This matters because vocational specialisation often expands at upper secondary rather than lower secondary.
A country can therefore have almost entirely general lower-secondary education and a substantial vocational upper-secondary system, yet the combined secondary vocational share will fall between those stage-specific values.
Stage-specific indicators are needed to see exactly where vocational pathways begin to diverge from general education.
One peer observation below the median
The Republic of Korea records 7.1%, ranking 57th among the 93 observations and below the median of 9.8%. This describes the vocational share of ISCED 2+3 enrollment, not the size of vocational education across all levels.
The common 2024 reference year supports comparison but not trend analysis
All 93 observations use 2024, which avoids mixing values from different reference years and makes the structural comparison cleaner.
A single cross-section cannot show whether vocational enrollment is expanding or contracting. Curriculum reforms, qualification changes and changes in national ISCED mapping can alter the share over time.
The 93 observations also should not be described as every education system in the world. Missing countries are not assigned zero, and all summary statistics use only the available observations.
Data source and calculation method
Country values come from UNESCO Institute for Statistics indicator GTVP.2T3.V, “Share of all students in secondary education enrolled in vocational programmes, both sexes (%),” using the 2024 NATIONAL observations in this comparison. The generic internal unit label has been clarified as percent.
- UNESCO UIS official API — GTVP.2T3.V
- UNESCO UIS — percentage of students by programme orientation
- UNESCO UIS — vocational education definition
- UNESCO UIS — secondary education (ISCED 2 and 3)
The mean of 13.48%, median of 9.82%, quartiles and percentage bands are calculated directly from the 93 non-missing observations. Missing values are not zero-filled, and no student headcounts or employment outcomes are inferred. Because map dependency is zero, the featured visuals focus on ranking and distribution rather than forcing a choropleth.
The strongest conclusion supported by the dataset is that the vocational share of secondary enrollment varies widely across education systems in 2024: the median is about 9.8%, while Bolivia reaches 63.0%. A fuller comparison of national vocational education requires information from other education levels and labour-market outcomes.
Frequently Asked Questions
What does a 30% vocational share of secondary enrolment mean?
It means 30% of students enrolled in lower and upper secondary education are in programmes classified as vocational by UIS.
Does a higher vocational share mean better employment outcomes?
No. This indicator describes programme orientation, not employment, earnings, programme quality or employer satisfaction.
Does a low secondary vocational share mean vocational education is almost absent?
Not necessarily. Vocational education can be concentrated at post-secondary non-tertiary, short-cycle tertiary, adult or non-school training levels.
What is the median vocational share across the 93 observations?
About 9.8% in 2024. The unweighted mean is 13.5% and the maximum is Bolivia at 63.0%.
Related Articles
- Secondary Vocational Enrolment Share | 2018–2020 World Map
- Lower Secondary General-Programme Share | 120 Countries in 2024
- Secondary Education Standard Duration 2025 | Six Years Most Common
Green Map creates custom-edited map images using open geographic data sources such as geoBoundaries, Natural Earth, OpenStreetMap, and government open data.
These maps are edited visual materials, not raw data files, and are provided for education, documents, presentations, and graphic reference.