This Richland County Illinois map page includes a downloadable ZIP of matching high-resolution A3 JPG files, while the WebP maps are available here for quick browser viewing. The county is centered on Olney, with Noble to the west, Claremont to the east, Calhoun to the southeast, and Parkersburg farther south. Fox River runs through the middle of the county, several named lakes sit near Olney, and higher ground becomes more prominent across the eastern side and in a separate group of northwestern hills.
A practical way to read the county is to locate Olney and the main roads first, then compare the straight-line spacing of the surrounding communities. After that, follow Fox River past East Fork Lake and look east toward Bonpas Creek and the higher uplands. The supplied elevation map reports an actual range of about 120–184 meters with a mean near 145 meters, so the contrast between the central lowland and eastern ridges is visible even across a relatively compact county.
Table of Contents
Start with Olney to make sense of the roads and county shape
Olney is the clearest anchor on the general county map because several numbered roads meet or pass nearby. Noble lies west of the county seat, Claremont lies east, and the main east-west road pattern makes those three places easy to compare. Parkersburg is much farther south near the lower extension of the county, while Calhoun occupies the southeastern interior. Dundas appears north of Olney and provides another useful reference for the county’s north-south scale.
Road labels add detail once the community pattern is clear. Route 50 crosses the western and central part of the map, Route 130 provides a strong southward line from the Olney area, and Route 15 is visible across the central and eastern side. Other numbered routes such as 9, 10, 14, 5, 6, and 13 appear in different parts of the county, along with local road numbers including 250, 400, 500, 800, and 900. Instead of trying to memorize every number, use Olney, Noble, and Claremont as the first three landmarks and then trace the smaller roads outward.
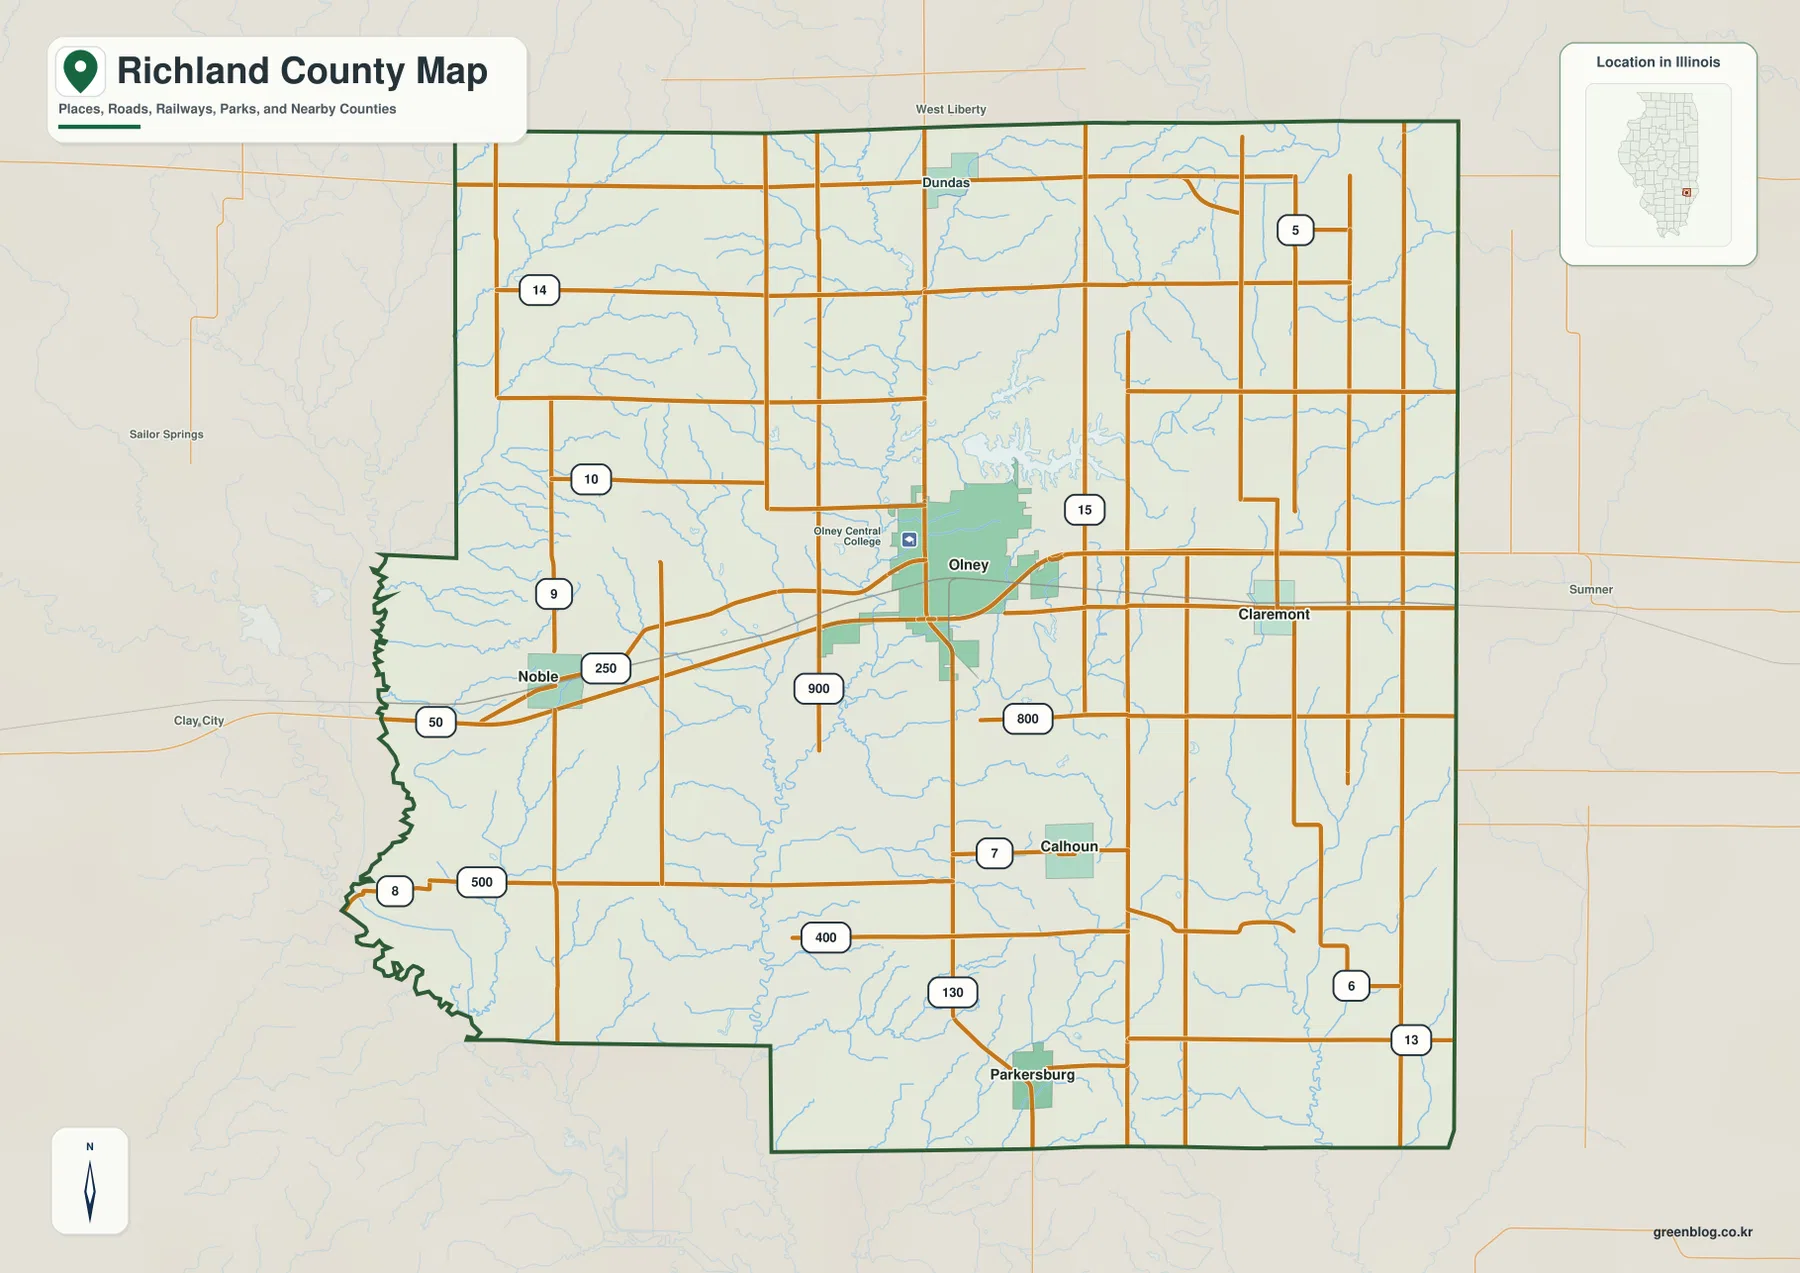
The county boundary is not a simple rectangle. The western and southwestern edges bend around several road and drainage areas, especially south of Noble and west of Parkersburg, while much of the northern and eastern boundary is straighter. That irregular western side becomes useful later when comparing creeks on the water map, because some western drainage lines occupy the protruding part of the county rather than running through the central Olney corridor.
Straight-line spacing shows how far the county extends from Olney
The community-connections map removes most of the minor roads and water labels so that relative spacing is easier to see. Its printed community index values are Olney 8,577, Noble 649, Parkersburg 237, Calhoun 227, and Claremont 195. Those numbers are being reported as labels from the supplied graphic; they are not presented here as a newly verified statement of current population.
The same diagram marks direct distances from Olney: about 8 miles to Noble, 6 miles to Claremont, 6 miles to Calhoun, and 10 miles to Parkersburg. These are straight-line measurements, not driving mileage. Noble and Claremont create the strongest east-west comparison, while Parkersburg extends the pattern south and Calhoun sits southeast of the hub rather than directly below it.
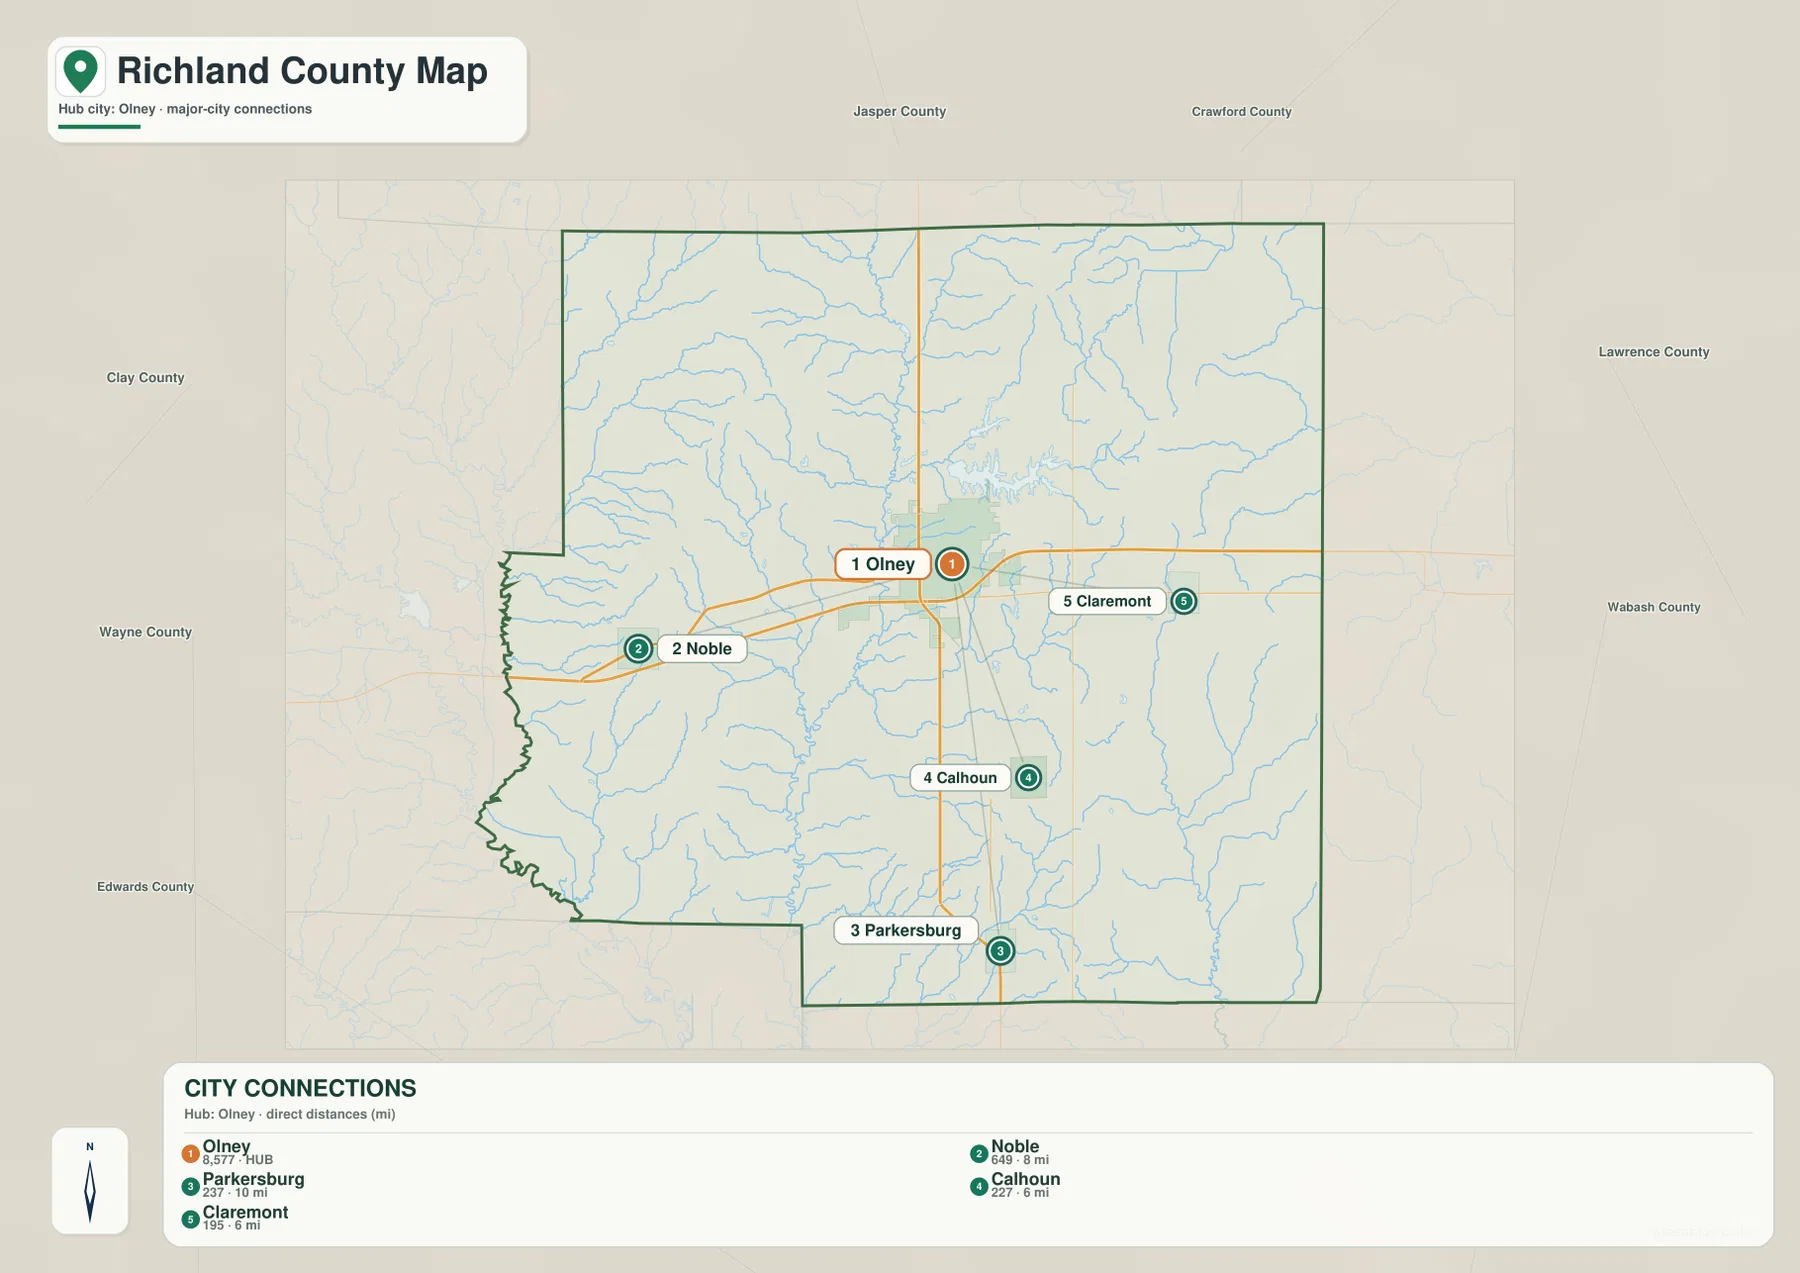
This simplified layout becomes especially useful when the physical maps are added back in. Claremont sits closer to the higher eastern terrain, while Noble is nearer the western side and the isolated hills north of that area. Parkersburg lies in the southern extension where low valleys and moderate uplands alternate. Knowing those directions in advance makes it easier to connect community names with Fox River, East Fork Lake, Bonpas Creek, and the elevation colors.
Fox River and the Olney lakes organize the central water map
Fox River is the main water feature through the middle of Richland County. It runs generally north to south and receives a dense network of smaller tributaries. Immediately east of the central corridor, East Fork Lake has a long branched shape that is easy to recognize. Olney Lake lies just to the north and Vernor Lake sits nearby to the west, making the Olney area the most concentrated group of named water features on the supplied map.
Other streams divide the county into distinct drainage areas. Hurricane Creek and Sugar Creek appear to the west, High Run Creek occupies the southwest, and Big Creek and Little Fox Creek cross the central-eastern interior. Farther east, Bonpas Creek becomes a strong north-south reference near Lake Montclare. Embarras River is labeled along the northeastern edge, while Gentry Creek appears in the south. If the map feels crowded, finding Fox River first and then Bonpas Creek provides a simple way to sort the remaining tributaries.
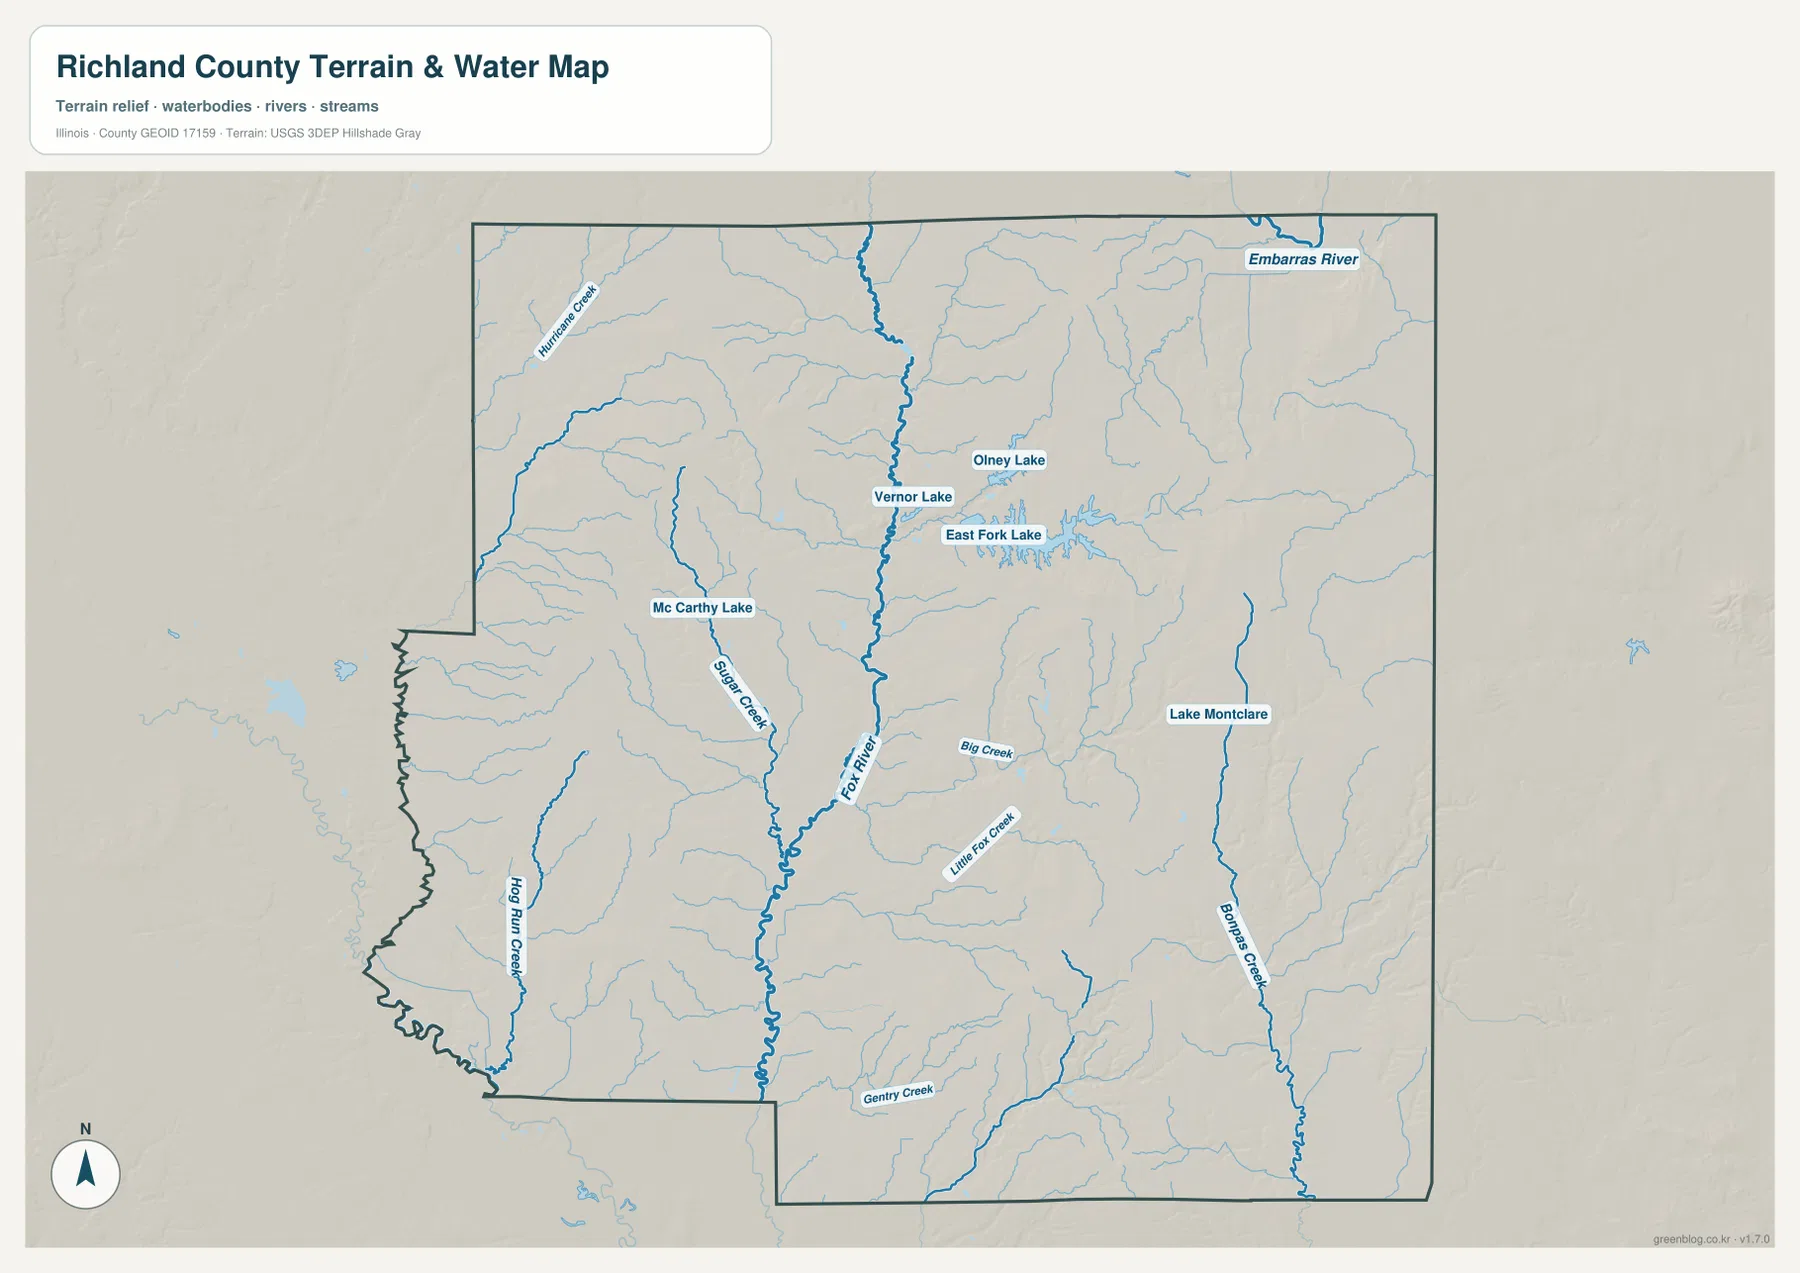
Named lakes are not limited to the Olney cluster. Mc Carthy Lake appears farther west and Lake Montclare is shown in the eastern half near Bonpas Creek. The map is useful for geographic location and relative drainage patterns, but it should not be treated as a flood-zone map, navigation chart, parcel map, or water-quality assessment. Questions about flooding, access, water conditions, or regulations require the current records of the responsible agencies.
Low Fox River ground contrasts with higher land to the east
The supplied elevation map reports approximately 120–184 meters of actual elevation and a mean near 145 meters. The most continuous low area appears as a green band through the middle of the county and follows the Fox River system closely. Lower ground also spreads across parts of the southwest. In contrast, broad tan and brown areas cover much of the eastern half, and a separate group of higher hills appears northwest of the central corridor.
The eastern uplands are cut by narrow valleys rather than forming one flat high surface. Bonpas Creek and its tributaries occupy lower green strips between ridges, and the northeastern terrain drops toward the Embarras River system. Around Fox River and East Fork Lake, the low central corridor remains recognizable even where nearby ground rises. This is why the water map and elevation map reinforce each other so well.
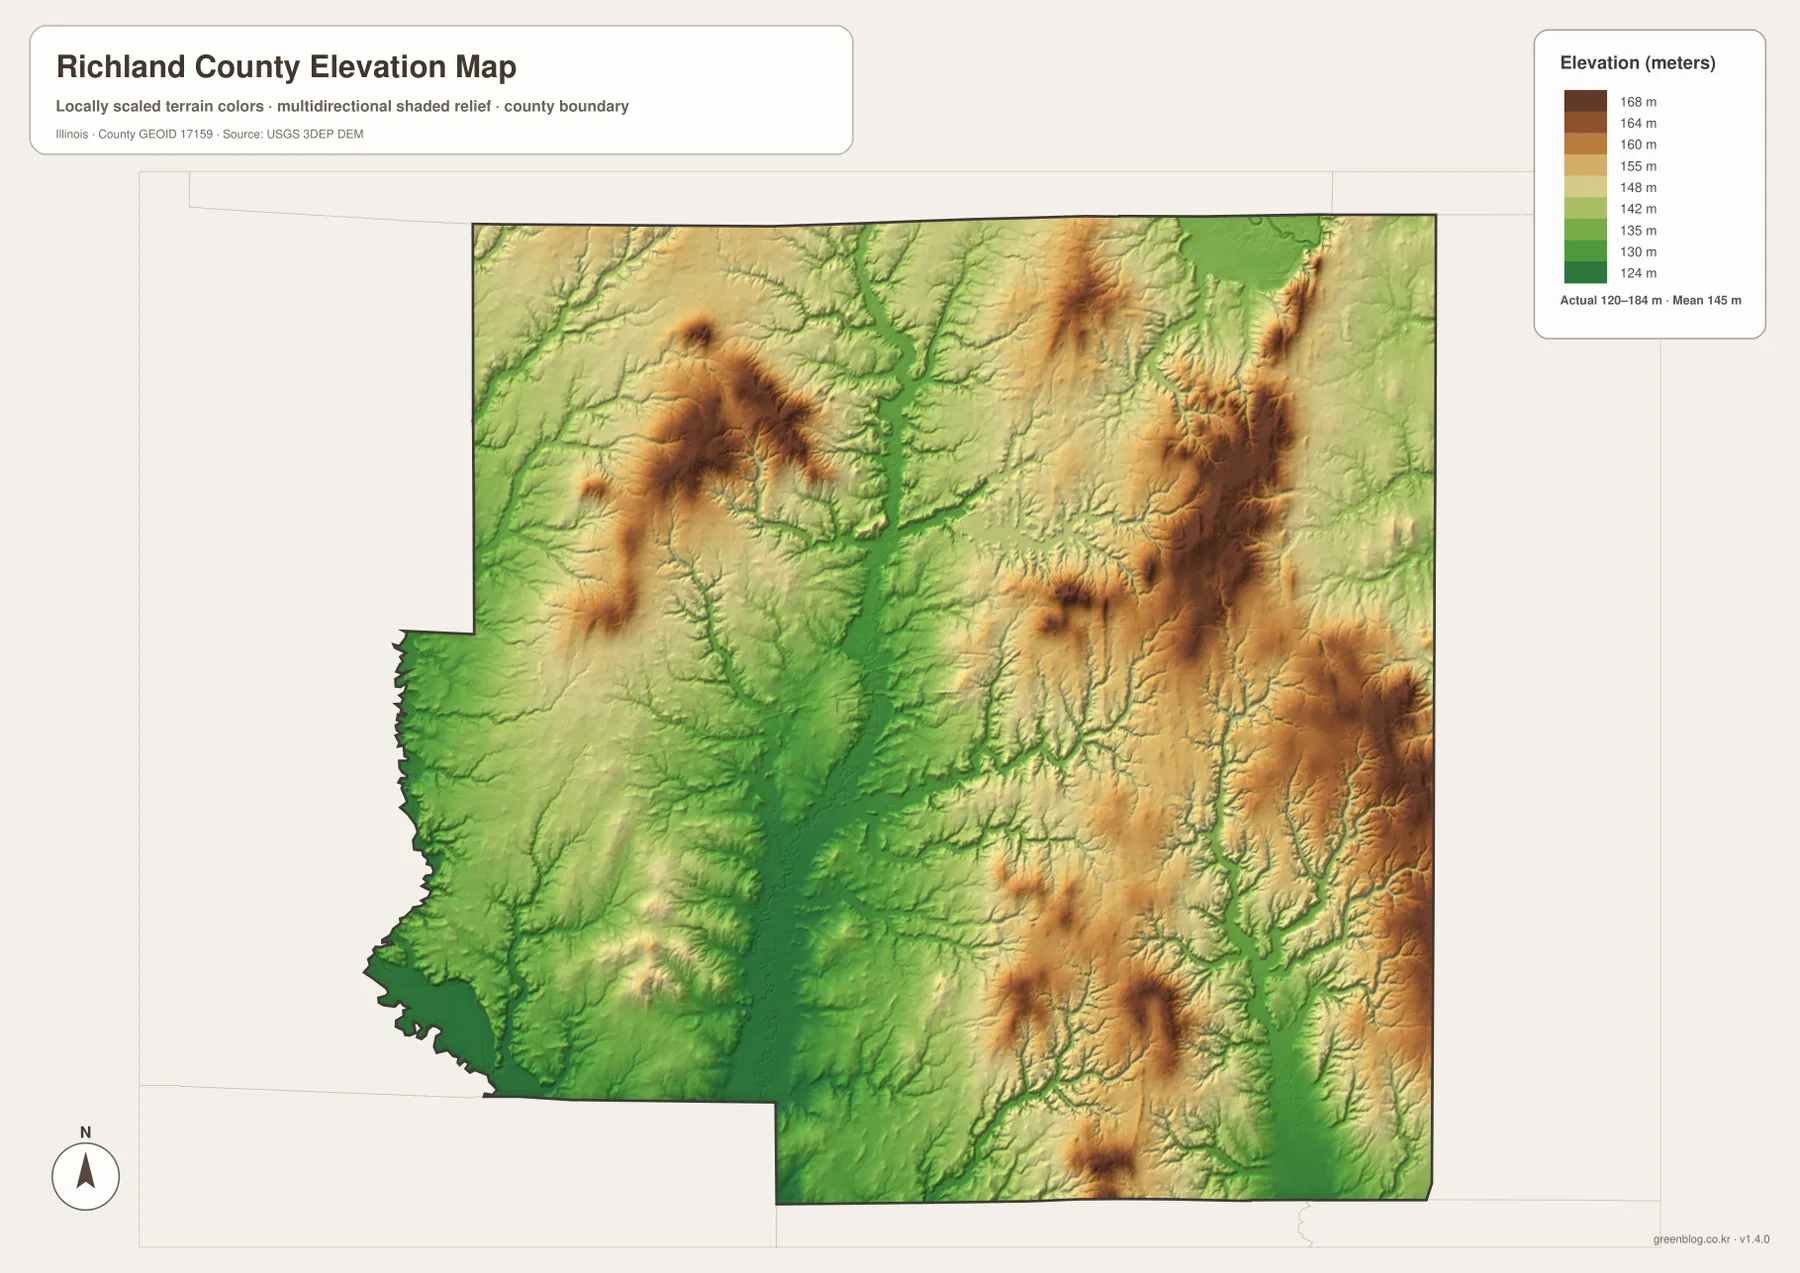
Using Olney as a reference, the central city area and nearby river corridor generally occupy lower terrain than the broad hills east of Claremont. Higher ground also appears north of Noble, though it is less continuous than the eastern uplands. Around Parkersburg, the southern extension contains alternating valleys and moderate hills. Richland County is therefore better described as a landscape of low drainage corridors separated by rolling higher ground than as a uniformly flat county.
The elevation layer is intended for county-scale comparison. Its colors and shaded relief help show where valleys and hills are located, but the map is not a survey or engineering product and should not be used for site-specific elevation decisions. For precise property or construction work, consult detailed elevation data and professional survey information.
Choose the layer that matches what you need to find
For roads, community names, and county shape, begin with the general map and use Olney as the center point. Noble and Claremont define the strongest east-west relationship, while Parkersburg and Calhoun establish the southern part of the county. If relative spacing is more important than road detail, the community diagram is faster to read, as long as its connector labels are understood as straight-line distances.
For rivers and lakes, start with Fox River and East Fork Lake, then move east to Bonpas Creek and northeast to Embarras River. For terrain, find those same landmarks on the elevation map and compare the low green valleys with the brown eastern ridges. The WebP maps are convenient for browsing, while the downloadable high-resolution JPG ZIP is better for printing or enlarging small creek names and road numbers.
Frequently Asked Questions
Are the 6 mi, 8 mi, and 10 mi labels on the community map driving distances?
No. The supplied community diagram uses straight-line distances from Olney. It shows Noble at about 8 miles, Claremont and Calhoun at about 6 miles each, and Parkersburg at about 10 miles. Actual road mileage will vary with the route you take.
Which map is best for seeing Fox River and the lakes near Olney together?
Use the terrain and water map. It places Fox River beside East Fork Lake, Olney Lake, and Vernor Lake, while also showing Bonpas Creek farther east and Embarras River near the northeastern edge. For flood risk, water quality, or navigation questions, consult the appropriate current agency data rather than this general reference map.
Where is the strongest elevation contrast in Richland County?
The clearest contrast is between the low Fox River corridor through the county center and the broader uplands to the east. The supplied map reports an elevation range of about 120–184 meters with a mean near 145 meters, and it also shows smaller high areas in the northwest.
Map File Information
The ZIP contains A3 high-resolution JPG versions of the Richland County road and boundary map, community-connections map, terrain and water map, and elevation map.
- Printable Size: 3638 × 2572 pixels each
- File Type: ZIP containing 4 JPG files
Related Maps
Sources and references
- Richland County, Illinois official website – county government and local information
- Illinois State Archives – Richland County – county records and historical reference
- U.S. Census Bureau TIGER/Line Shapefiles – boundary, road, and place reference
- USGS National Hydrography – rivers, streams, and lakes
- USGS 3D Elevation Program – elevation and terrain reference
Green Map creates custom-edited map images using open geographic data sources such as geoBoundaries, Natural Earth, OpenStreetMap, and government open data.
These maps are edited visual materials, not raw data files, and are provided for education, documents, presentations, and graphic reference.