Jackson County, Arkansas is a strongly agricultural county on the 2025 land-cover maps. Agriculture accounts for 76.46% of the mapped area, while wetlands trace many river and drainage corridors, forest becomes much more noticeable in the western extension, and developed land is concentrated around Newport. This page compares four views: general land cover, forest and farmland, impervious surface, and mapped land-cover differences from 1985 to 2025.
The four original JPG maps are available together in one download near the lower part of the page. Use the general map for an overview, the forest-and-farmland version for a cleaner rural-landscape comparison, the impervious map to isolate built surfaces, and the change map when you need to locate areas whose mapped class differs between the two comparison years.
Table of Contents
A county shaped by broad farmland, river corridors, and a wooded west
The dominant pattern is not subtle: most of Jackson County is agricultural land. The 2025 summary reports 76.46% agriculture, 10.85% wetlands, 6.31% forest, 4.81% developed cover, and 1.43% water. The county government describes the north, center, and south as rich delta farmland and notes rolling hills in the extreme western part. That description fits the map well. The western projection contains the county’s largest continuous concentration of forest, while cropland covers much of the broader interior and eastern side.
Water and wetlands break up that agricultural surface. Wetlands appear in winding bands and irregular pockets rather than as one compact zone. Jackson County’s official information identifies the White and Black rivers as important features of the county, and University of Arkansas System Division of Agriculture material describes Jackson County farms near Newport in the Upper White–Village Creek watershed. On the land-cover maps, those river and lowland settings are visible as wetland and water colors threaded through large agricultural areas.
Newport provides another contrast. It is the county seat, and the map’s largest developed concentration sits in the same central-western part of the county. Smaller developed patches occur farther north and east, but they remain minor compared with the acreage mapped as agriculture. Reading the county this way—farmland first, then river wetlands, a western forest block, and a compact Newport footprint—gives a clearer picture than treating each land-cover percentage as an isolated statistic.
The impervious-surface map isolates where built surfaces are concentrated
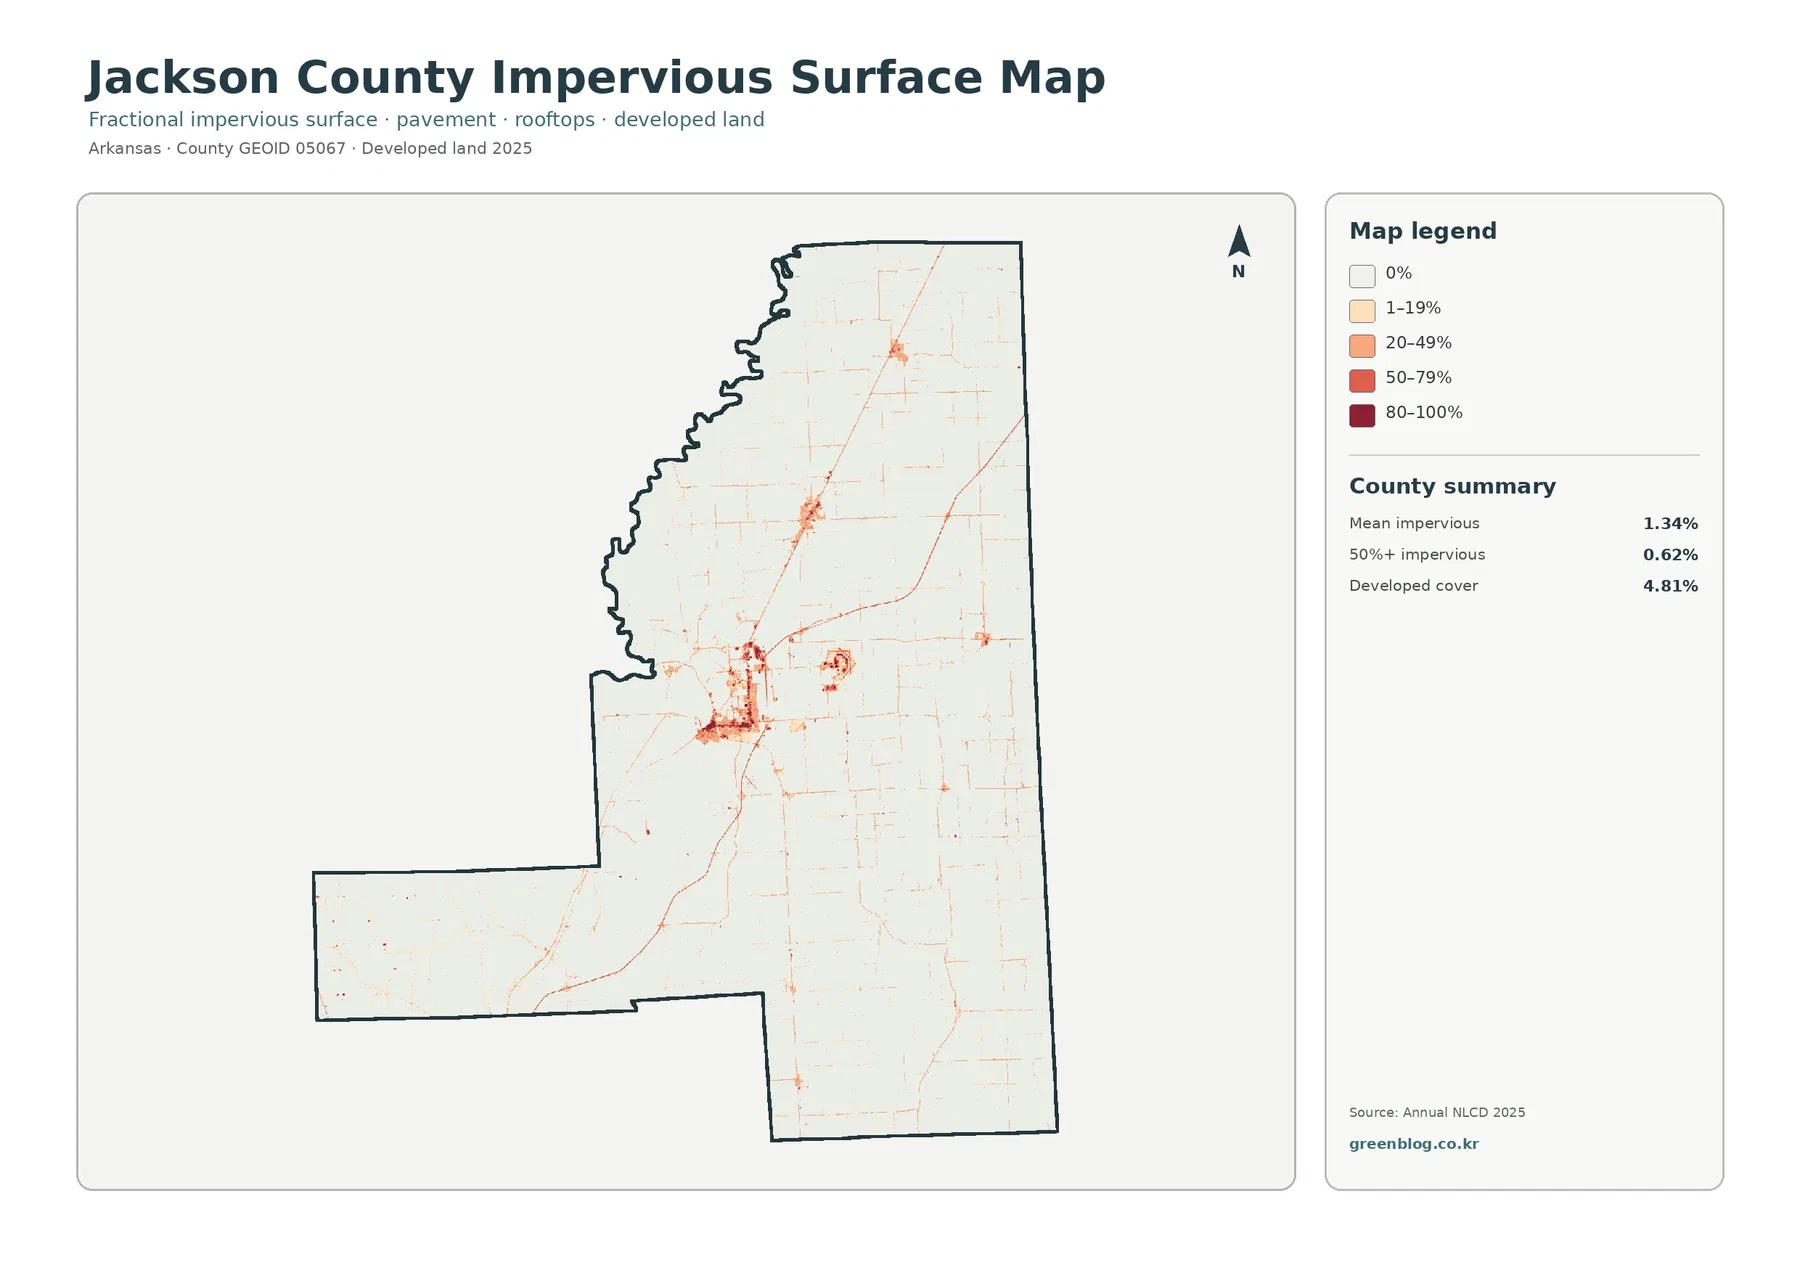
Impervious surface means pavement, rooftops, and similar surfaces that do not readily absorb rainfall. Jackson County’s mean impervious value is 1.34%, and only 0.62% of the county is mapped at 50% impervious or higher. Those numbers are lower than the 4.81% developed-cover figure because developed land can include lawns, trees, open ground, and other surfaces that still allow some water infiltration. The two measures answer related but different questions.
The strongest impervious cluster appears around Newport. Darker cells form a compact urban pattern, while thinner, lighter lines extend outward along transportation and settlement corridors. A second compact concentration and several small nodes are visible elsewhere in the agricultural landscape. The map is useful for locating these concentrations, but it does not establish why development occurred in a particular place. A road and developed land may occupy the same corridor without the map proving that one caused the other.
This focused view can be easier to use than the general land-cover map when the topic is stormwater context, urban form, or the contrast between town and countryside. In the general map, small developed areas compete visually with the much larger agricultural and wetland classes. Here, most non-impervious land fades into the background, so built surfaces stand out. For a county presentation, that makes the Newport concentration immediately understandable without suggesting that urban land occupies a large share of the county.
The 2025 land-cover map gives the best all-in-one overview
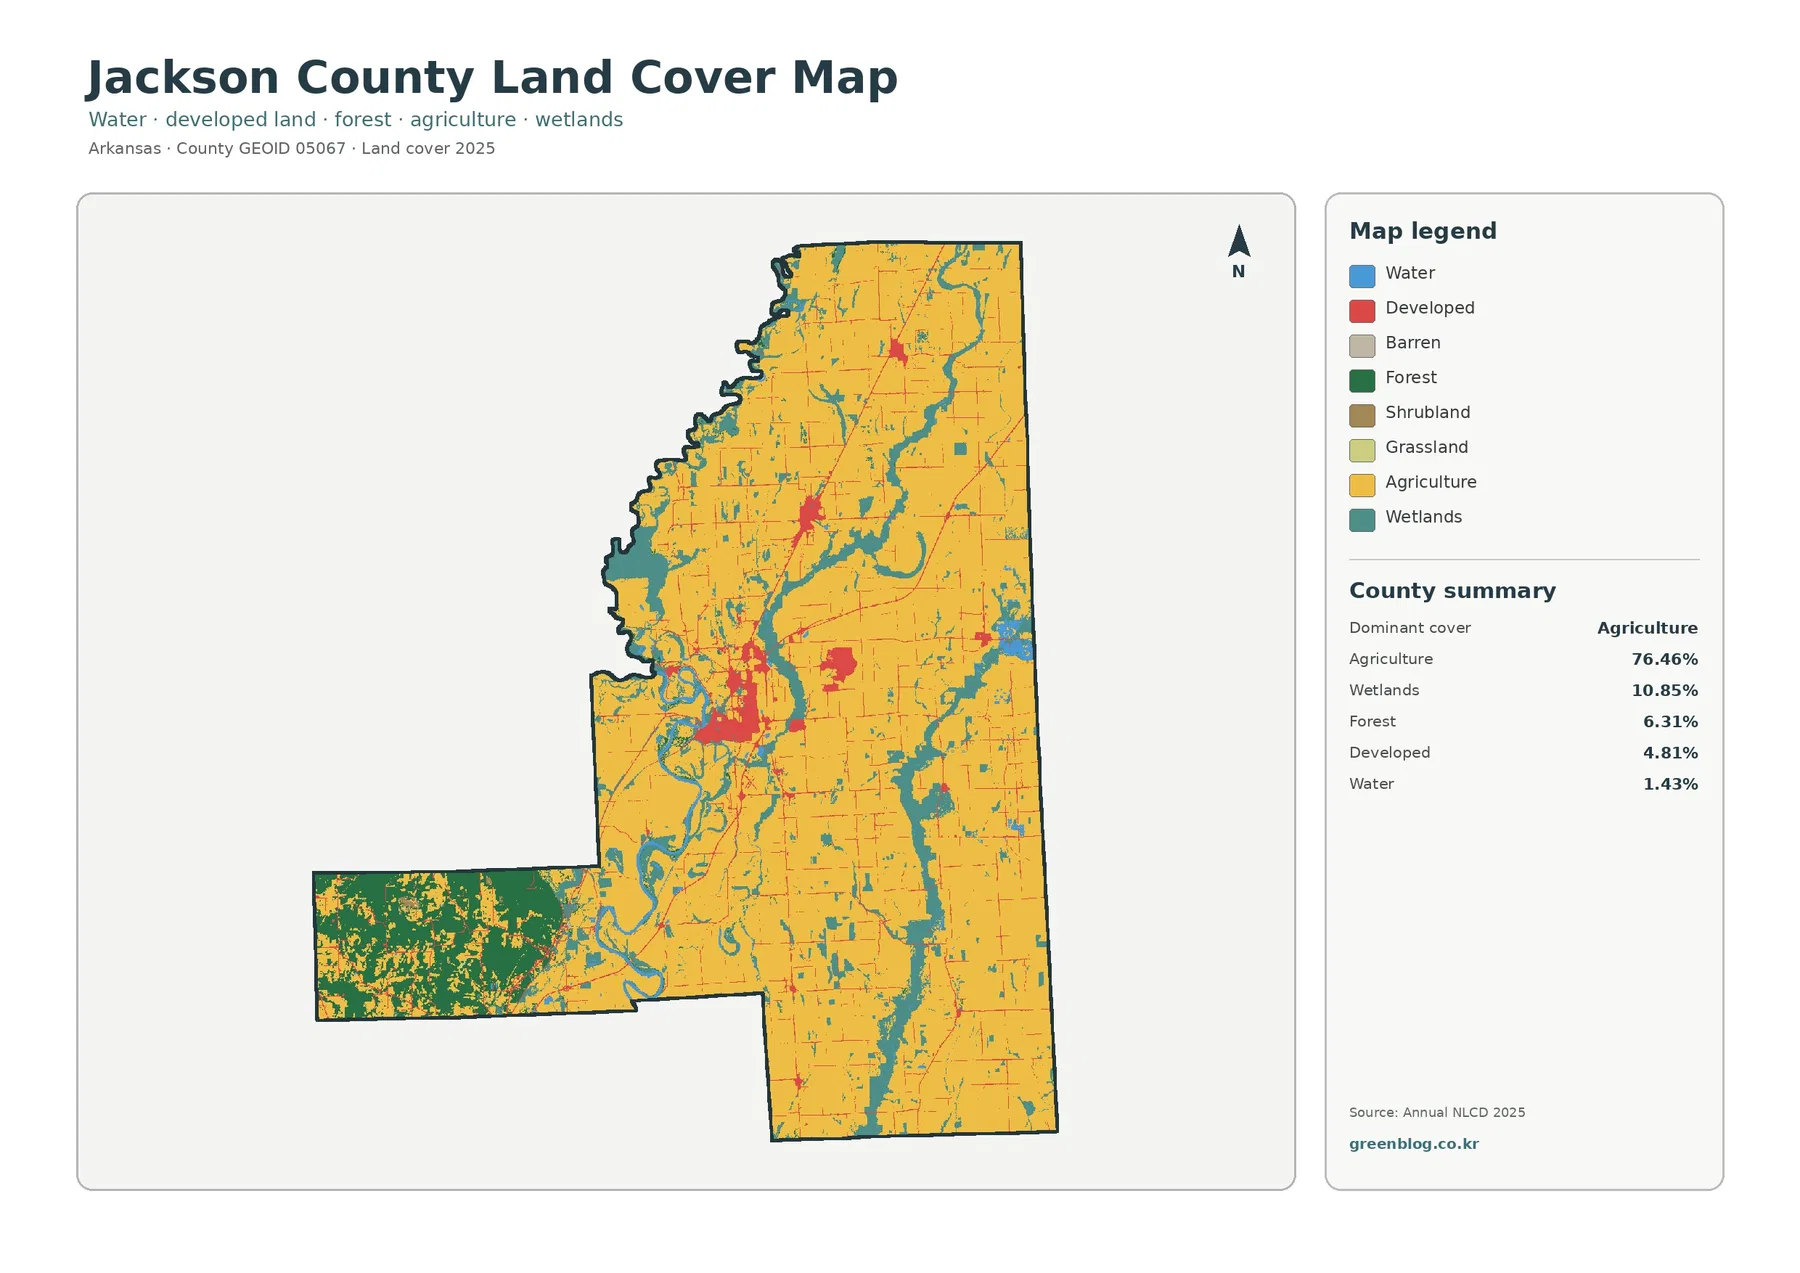
The general map brings all major classes back together. Agriculture fills most of the county, but wetland corridors and water features interrupt the fields in recognizable winding shapes. Developed land is concentrated rather than continuous, and the western projection is visibly more forested than the large agricultural body of the county. Because each class remains visible at the same time, this is the most useful map when a reader needs one image that explains the county as a whole.
The 10.85% wetland share is especially important for interpreting the map. Wetlands are not limited to the edge of a single river. They occur along several curving corridors and low-lying areas, often directly beside agricultural cover. Water accounts for 1.43%, so the blue areas are smaller than the broader wetland network surrounding or following waterways. This difference matters in watershed or environmental education: open water and wet ground are related, but they are not the same mapped class.
The developed class is also broader than the darkest built surfaces shown on the impervious map. Around Newport, red developed cells create the county’s largest urban patch, while smaller settlements and linear development appear as scattered marks. At the same time, the forested western extension has relatively little developed color. Comparing these parts of the same map helps show that Jackson County contains several distinct landscape settings even though agriculture dominates the total percentage.
Forest and farmland become easier to compare when other classes are simplified
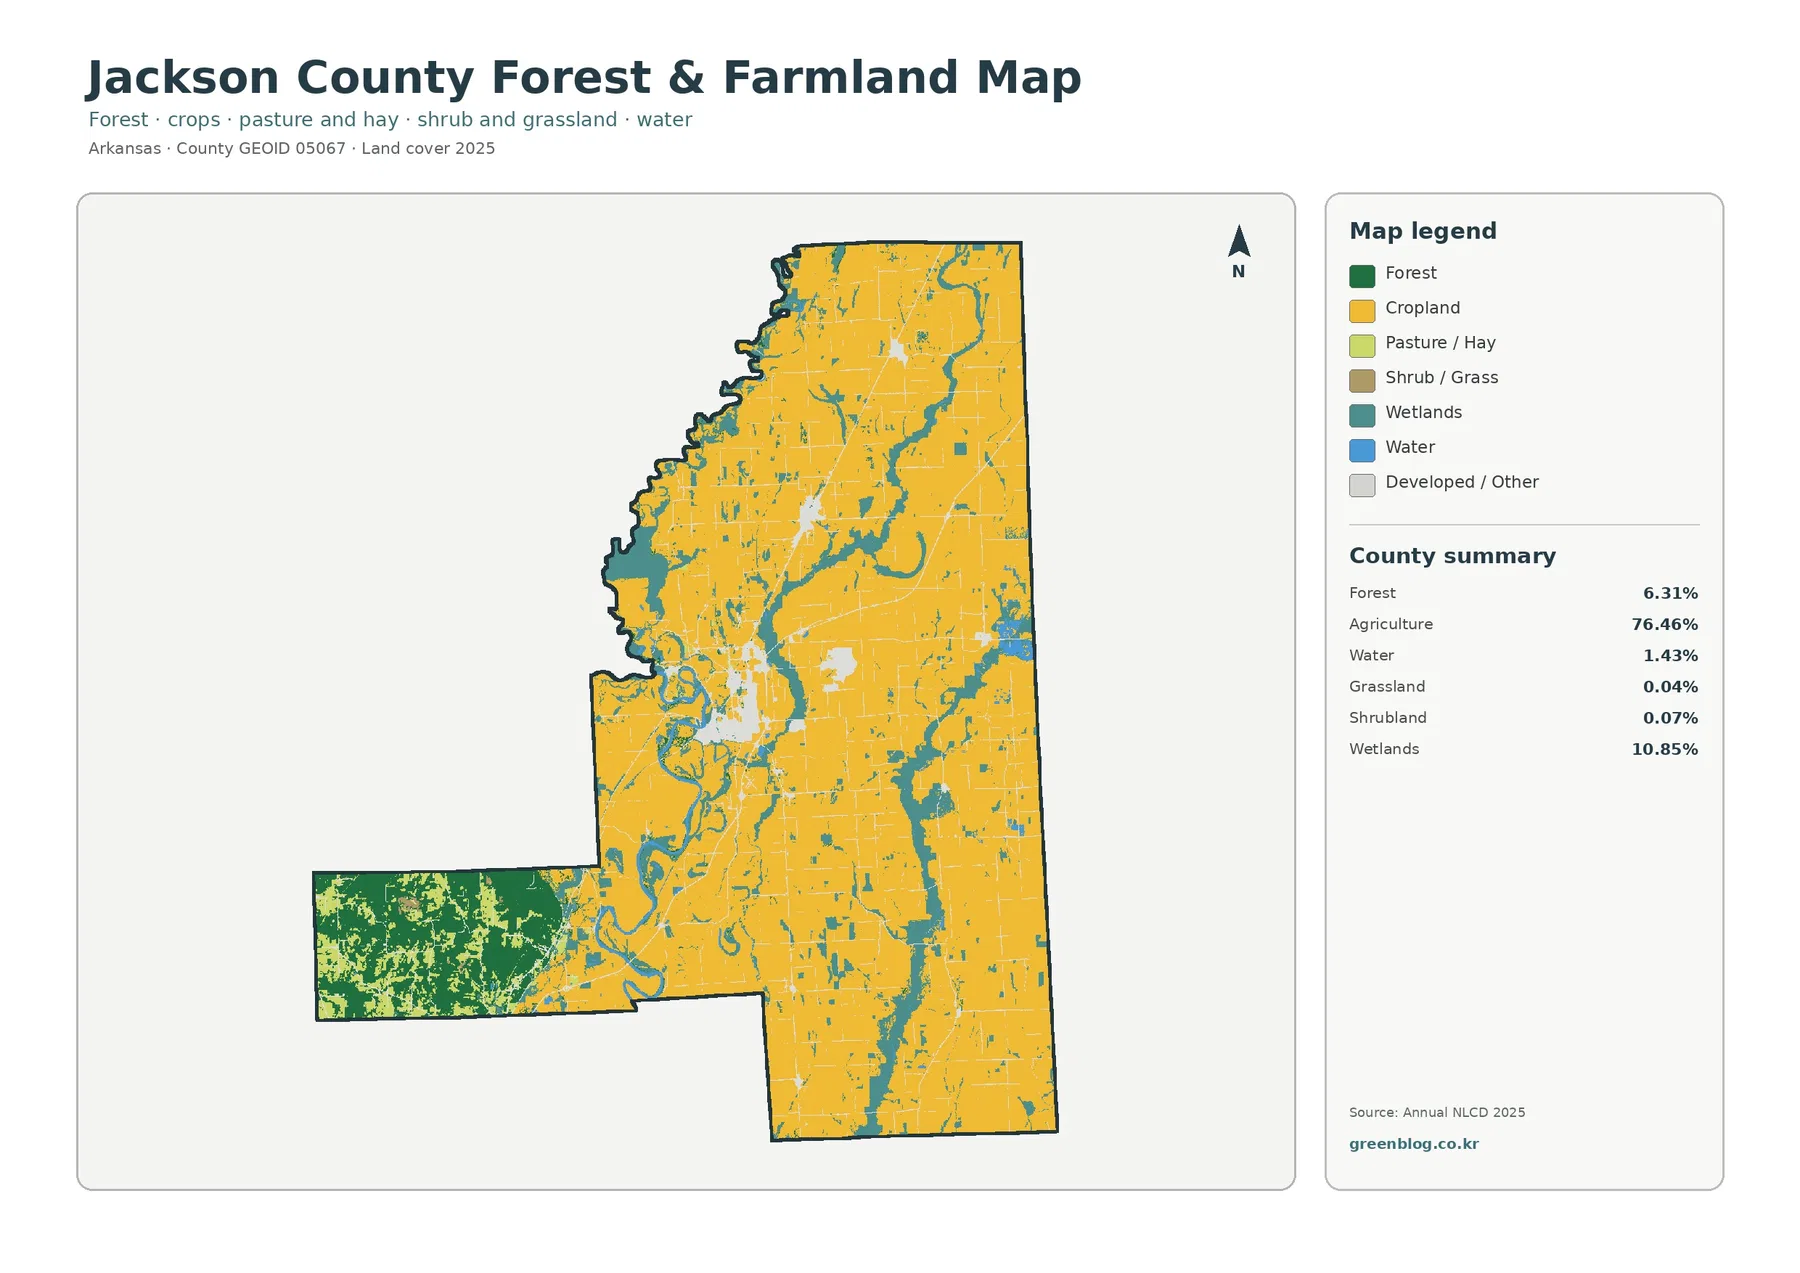
The forest-and-farmland map removes much of the visual competition from developed and miscellaneous classes. Agriculture remains at 76.46%, and forest is 6.31%. Grassland accounts for 0.04% and shrubland 0.07%, so neither is a major countywide class in this summary. The result is a clear agricultural field across most of the county, interrupted by wetlands and water and contrasted by the dense forest block in the west.
The official county description of delta farmland and western rolling hills provides useful geographic context for this contrast. The map itself is not an elevation map, so forest should not be used as a direct substitute for slope or height. Still, the concentration of forest in the far west and the broad cropland pattern elsewhere show how different land-cover conditions occupy different parts of the county. If elevation or terrain is the main question, a dedicated topographic or elevation dataset should be consulted separately.
Agricultural cover also should not be read as a crop map. University of Arkansas agricultural material describes Jackson County operations producing crops such as rice, soybeans, and corn near Newport, but the land-cover classification does not identify the crop in each field. It simply groups areas into broader surface-cover classes. That makes the map useful for comparing agricultural extent with forest, water, and wetlands, not for identifying a specific farm, crop variety, owner, or management practice.
For teaching or presentation graphics, this simplified map is especially effective when the question is where farmland ends and the most continuous forest begins. It also keeps the wetland network visible, which prevents the county from looking like an uninterrupted block of cropland. The combination of agricultural dominance and river-connected wetlands is one of the clearest recurring patterns across the Jackson County map set.
What changed between 1985 and 2025—and what the map cannot prove
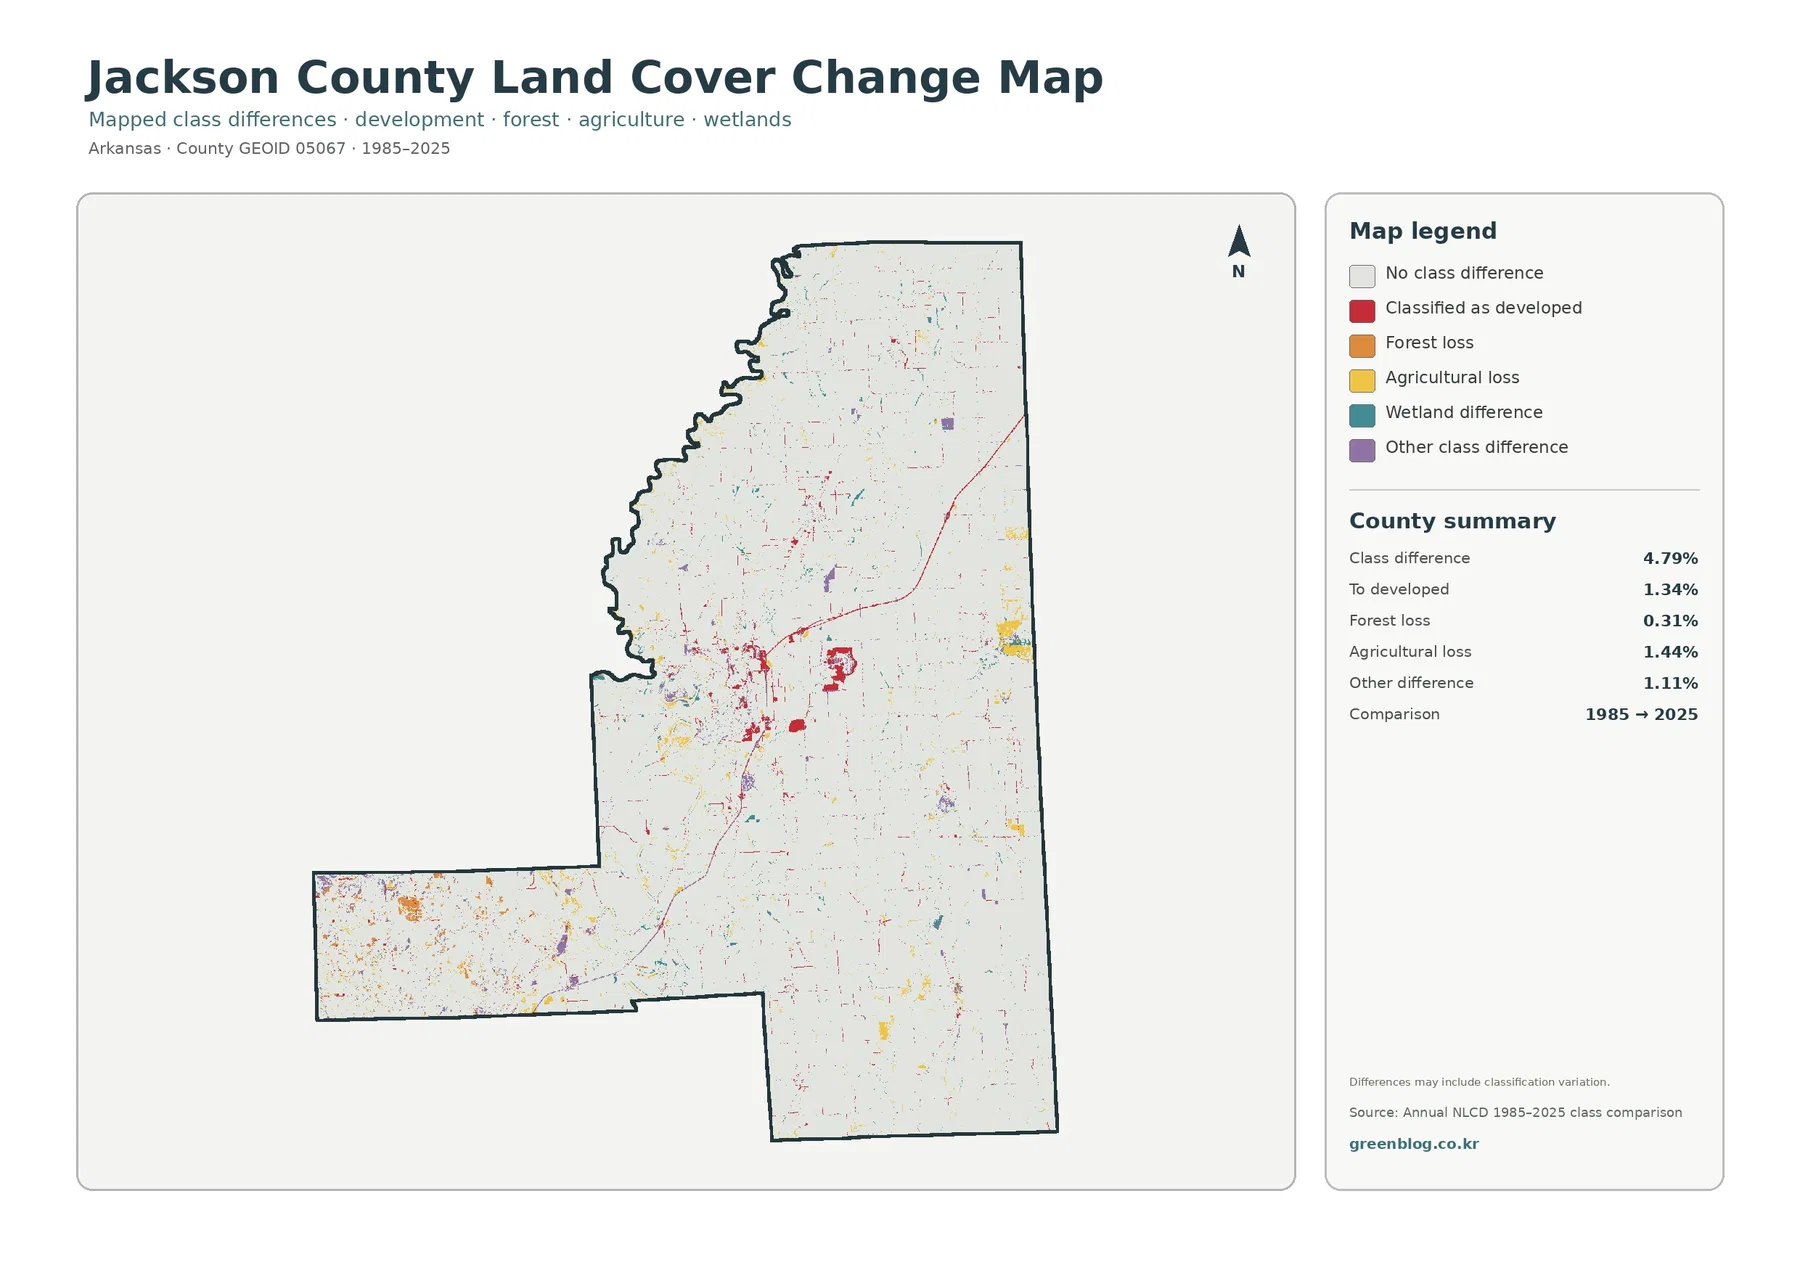
The comparison map reports class differences across 4.79% of Jackson County. Areas mapped as becoming developed account for 1.34%; agricultural loss is 1.44%; forest loss is 0.31%; and other differences are 1.11%. Those categories are useful for locating change signals, but they should not be treated as a complete history of every parcel. The map compares two classification snapshots, not annual ownership records or a continuous record of construction and farming activity.
Development-related differences are most noticeable around the Newport area and along several narrow corridors. Elsewhere, small change patches are scattered through the agricultural landscape, and the western forested section contains a mixture of localized differences. The county is not shown as having changed class across most of its area; instead, change appears in clusters, lines, and small fragments against a much larger background with no major class difference in this two-date comparison.
Classification uncertainty is particularly important on a long comparison. A 30-meter raster cell may contain more than one real surface, creating a mixed pixel that receives one representative class. Different image conditions or classification methods can also affect the result, which is why the map itself notes that differences may include classification variation. A highlighted location is best treated as a place to investigate further with aerial imagery, local records, or field information rather than as proof of a specific event.
Choosing the right map for a project
Use the general land-cover map when the audience needs the county’s full pattern in one image. It is the strongest option for an introductory slide, a county profile, or a broad environmental overview because agriculture, wetlands, forest, development, and water remain visible together. The forest-and-farmland map is better when rural land is the main subject, especially when you want the western forest concentration to stand out against the large agricultural plain.
For built-environment questions, the impervious map adds detail that the general land-cover map cannot provide. It separates very low impervious areas from more heavily paved or roofed places and makes the Newport concentration easy to locate. The change map serves a different purpose again: it points to locations where the mapped class differs between 1985 and 2025. Putting all four on one page lets a reader move from current overall cover to a more focused rural, built, or historical comparison without confusing those concepts.
The maps can support environmental education, watershed discussion, planning context, habitat comparison, and presentation graphics. They can also help frame questions before more detailed research. For example, a reader might use the wetland pattern to decide which river corridor deserves closer study or use the impervious map to identify where higher-resolution urban data would be useful. These are screening and communication uses, not parcel-level decisions.
Download the four Jackson County JPG maps
The downloadable ZIP contains the original JPG versions of the general land-cover map, forest-and-farmland map, impervious/developed-land map, and 1985–2025 land-cover change map. Each source JPG in this package is 2480×1754 pixels. The images embedded in the article are WebP previews sized for browser viewing, while the JPG files are the better choice when you need the original supplied image for a slide, handout, or layout project.
A single download keeps the four views together, which is useful when comparing the same county across different themes. Before publishing or printing a derivative graphic, keep the legends with the maps or explain the classes in accompanying text. The meaning of agriculture, wetlands, developed land, and impervious surface should remain clear so that readers do not mistake land cover for zoning, legal land use, ownership, or parcel boundaries.
Reading limits: 30 m cells, mixed pixels, dates, and land-use confusion
Annual NLCD is a raster dataset, meaning the landscape is represented as a grid of cells. A commonly used cell size for NLCD land cover is 30 meters. At that scale, a narrow road, small pond, tree line, building, and field edge can fall within the same cell. When several surfaces share one cell, the classification has to represent that mixed pixel in a generalized way. As a result, boundaries on the map should not be measured as if they were surveyed parcel lines.
Land cover also differs from land use. Land cover describes what physically covers the ground—such as forest, crops, water, wetlands, or developed surface. Zoning and legal land use describe rules or activities associated with land, and ownership identifies who holds a parcel. None of those legal or cadastral questions can be answered from these four images. If a planning decision depends on a property boundary or permitted use, the relevant local records are required.
The date of the classification matters as well. The current maps represent 2025 conditions as classified in the supplied Annual NLCD dataset, while the change view compares 1985 with 2025. Development, cultivation, flooding, vegetation, or restoration after the observation period may not be reflected. For current site-specific work, use these countywide maps as context and then check more recent imagery or authoritative local data for the location in question.
Frequently Asked Questions
What is the dominant land cover in Jackson County, Arkansas?
Agriculture is the dominant 2025 class at 76.46% of the county. Wetlands account for 10.85%, forest 6.31%, developed cover 4.81%, and water 1.43% in the supplied county summary.
Why is developed cover 4.81% while mean impervious surface is only 1.34%?
Developed land can include lawns, trees, and other permeable surfaces along with pavement and buildings. The impervious map measures the share of surfaces that resist water infiltration, so its countywide average is not expected to equal the developed-cover percentage.
Does the 1985–2025 change map prove exactly what happened on a parcel?
No. It compares classified raster cells at two dates and may include real landscape change as well as classification variation. Parcel-level conclusions require higher-resolution imagery, local records, or field verification.
Map File Information
Jackson County Land Cover Map JPG Files
- Included Files: Use only the versions confirmed in the article and supplied images
- File Type: Use the confirmed download contents
- Intended Use: Printing, education, presentations, and map-based projects
Related Maps
- A Craighead County Arkansas Land Cover Map
- Arkansas County Arkansas Land Cover Map
- Ashley County Arkansas Land Cover Map
Sources and reference material
- MRLC Annual NLCD Data — official access to Annual NLCD data and related land-cover products.
- USGS Annual NLCD Land Cover Classification — USGS documentation explaining the land-cover classification system and class meanings.
- U.S. Census Bureau TIGER/Line Shapefiles — official geographic boundary data used for county-scale mapping.
- Jackson County, Arkansas — About — the county government’s overview of Newport, delta farmland, western rolling hills, and local rivers.
- Arkansas Discovery Farm Program — University of Arkansas agricultural examples from Jackson County near Newport and the White River watershed.
Green Map creates custom-edited map images using open geographic data sources such as geoBoundaries, Natural Earth, OpenStreetMap, and government open data.
These maps are edited visual materials, not raw data files, and are provided for education, documents, presentations, and graphic reference.