Guadalupe County sits in south-central Texas with a clear contrast between the closely spaced western cities and the broader central and eastern parts of the county. The supplied maps show Seguin, Schertz, Cibolo, Marion, New Berlin, major highways, the Guadalupe and San Marcos rivers, named creeks and lakes, and countywide elevation. High-resolution JPG versions of the map files can be downloaded together in the ZIP near the end of this page after you review the web previews.
Seguin is the easiest central reference point. Schertz and Cibolo sit near the western edge toward Bexar County, while the county widens substantially to the east and southeast. San Marcos appears just beyond the northern side of the map, New Braunfels lies beyond the northwest, and Luling is shown to the east. Those outside labels make it easier to understand how Guadalupe County fits between the San Antonio-area suburbs and the communities farther east.
The package contains a general county map, a ranked city map, a terrain-and-water map, and an elevation map. The descriptions below use the place names, road numbers, water features, and elevation values that are visible in those supplied images. They are intended for geographic reference and printing, not for legal boundary decisions, flood determinations, surveying, or engineering measurements.
Table of Contents
Seguin anchors the road network while the western cities form a tighter cluster
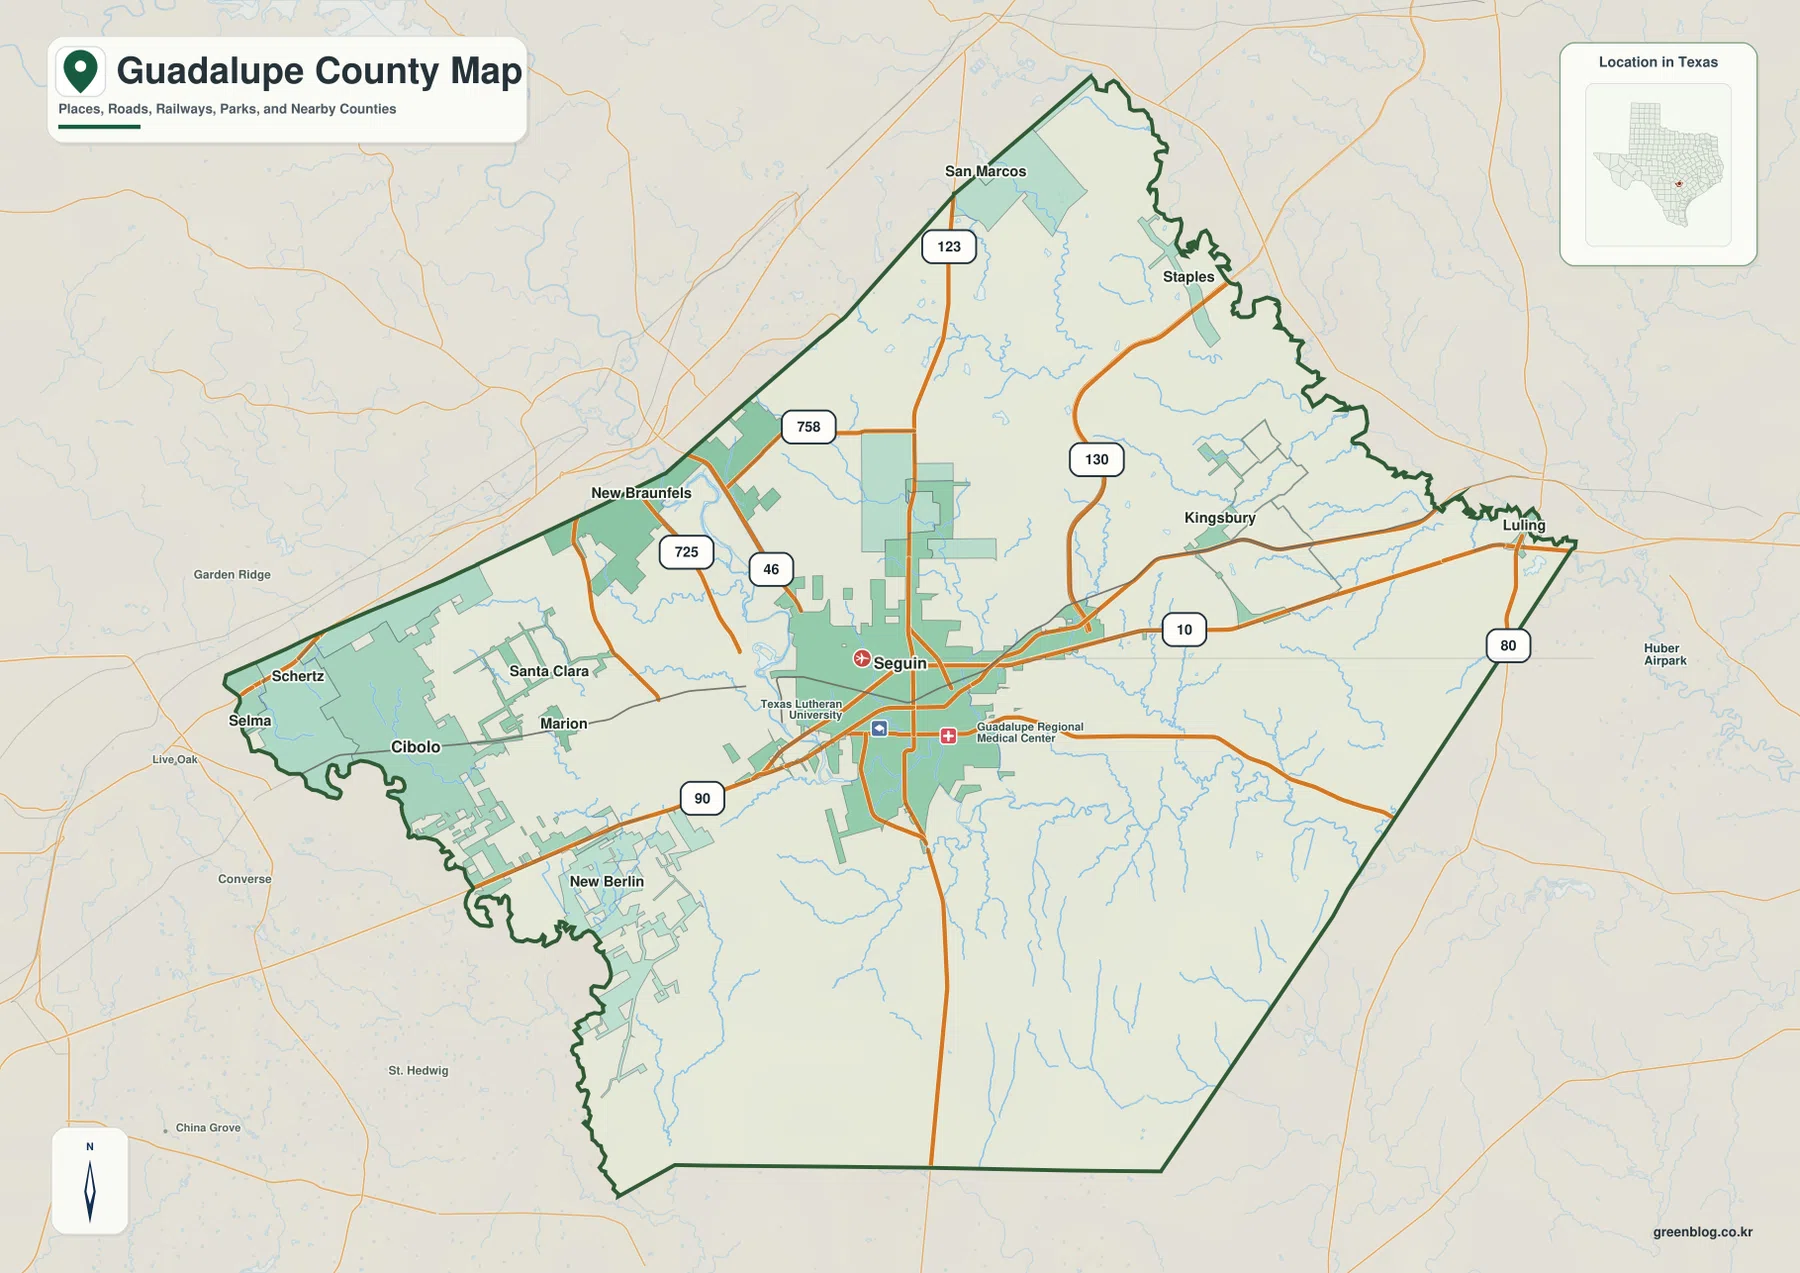
On the county map, Seguin stands near the middle of the county and is surrounded by several of the most useful route markers. Interstate 10 runs east-west through the Seguin area, while Route 123 comes down from the north and continues south. Route 130 approaches from the north and east side of the central county, and Route 46 connects toward the New Braunfels side. Because these roads converge around Seguin, the city works well as the first point to locate before following the map in other directions.
West of Seguin, the settlement pattern becomes much denser. Schertz, Selma, Cibolo, Santa Clara, and Marion appear within a comparatively short span, with New Berlin set farther south. This part of the map is also close to Bexar County and Comal County, so the county line does not separate the western communities from a much larger surrounding urban area. The map shows that the western edge of Guadalupe County has a different visual character from the long, more open eastern side.
The eastern half is easier to orient by roads and smaller place labels. Kingsbury lies east of Seguin, Staples is farther northeast, and Luling appears outside the eastern boundary near the Route 80 corridor. Long road segments cross this side of the county before reaching the boundary. Looking from Seguin toward the east therefore gives a quick sense of how the county transitions from the central road hub to a wider area with fewer large city labels.
The ranked city map highlights Schertz and Cibolo on the western edge
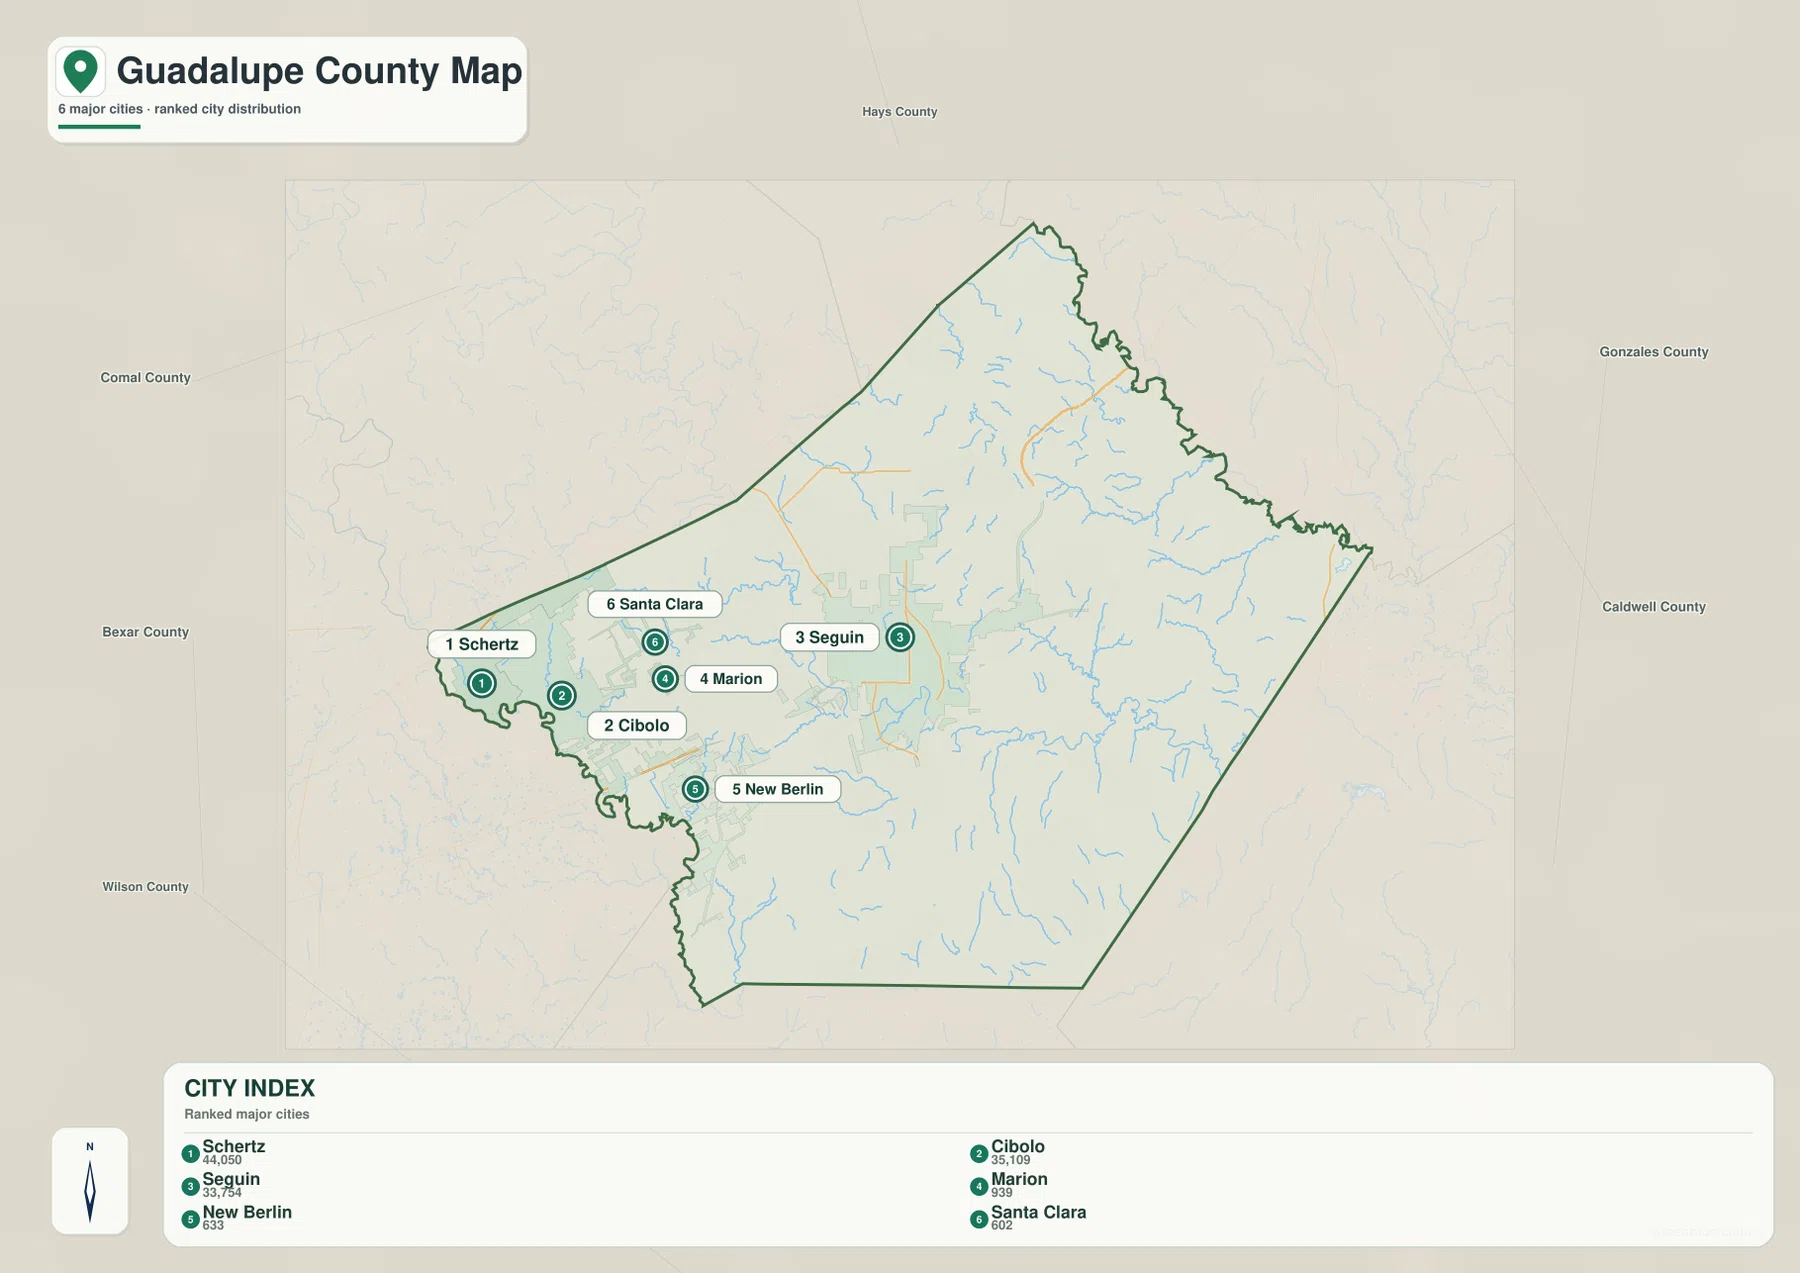
The city map ranks Schertz first, Cibolo second, and Seguin third among the six marked cities. Marion, New Berlin, and Santa Clara follow. The ranking is useful, but the location of each symbol is just as important: the two highest-ranked cities are side by side in the west, while Seguin is separated from them near the center of the county. That arrangement is much clearer on the map than it would be in a list of city names alone.
Schertz and Cibolo sit close to the Bexar County side, with Santa Clara and Marion between that western cluster and Seguin. New Berlin lies to the south of the main west-to-central line of cities. Once the eye moves east of Seguin, the ranked city symbols largely disappear even though the county continues for a considerable distance. The map therefore emphasizes how strongly the selected major cities are concentrated in the western and central sections.
The neighboring county labels provide another useful frame. Hays County is north, Comal County is northwest, Bexar County is west, Wilson County is southwest, and Gonzales and Caldwell counties are on the eastern side. With those names visible, it is easier to understand why Schertz and Cibolo feel connected to the western edge while Seguin sits more independently inside the county. It also helps when matching this page with adjacent county maps.
The Guadalupe and San Marcos rivers organize a dense network of smaller creeks
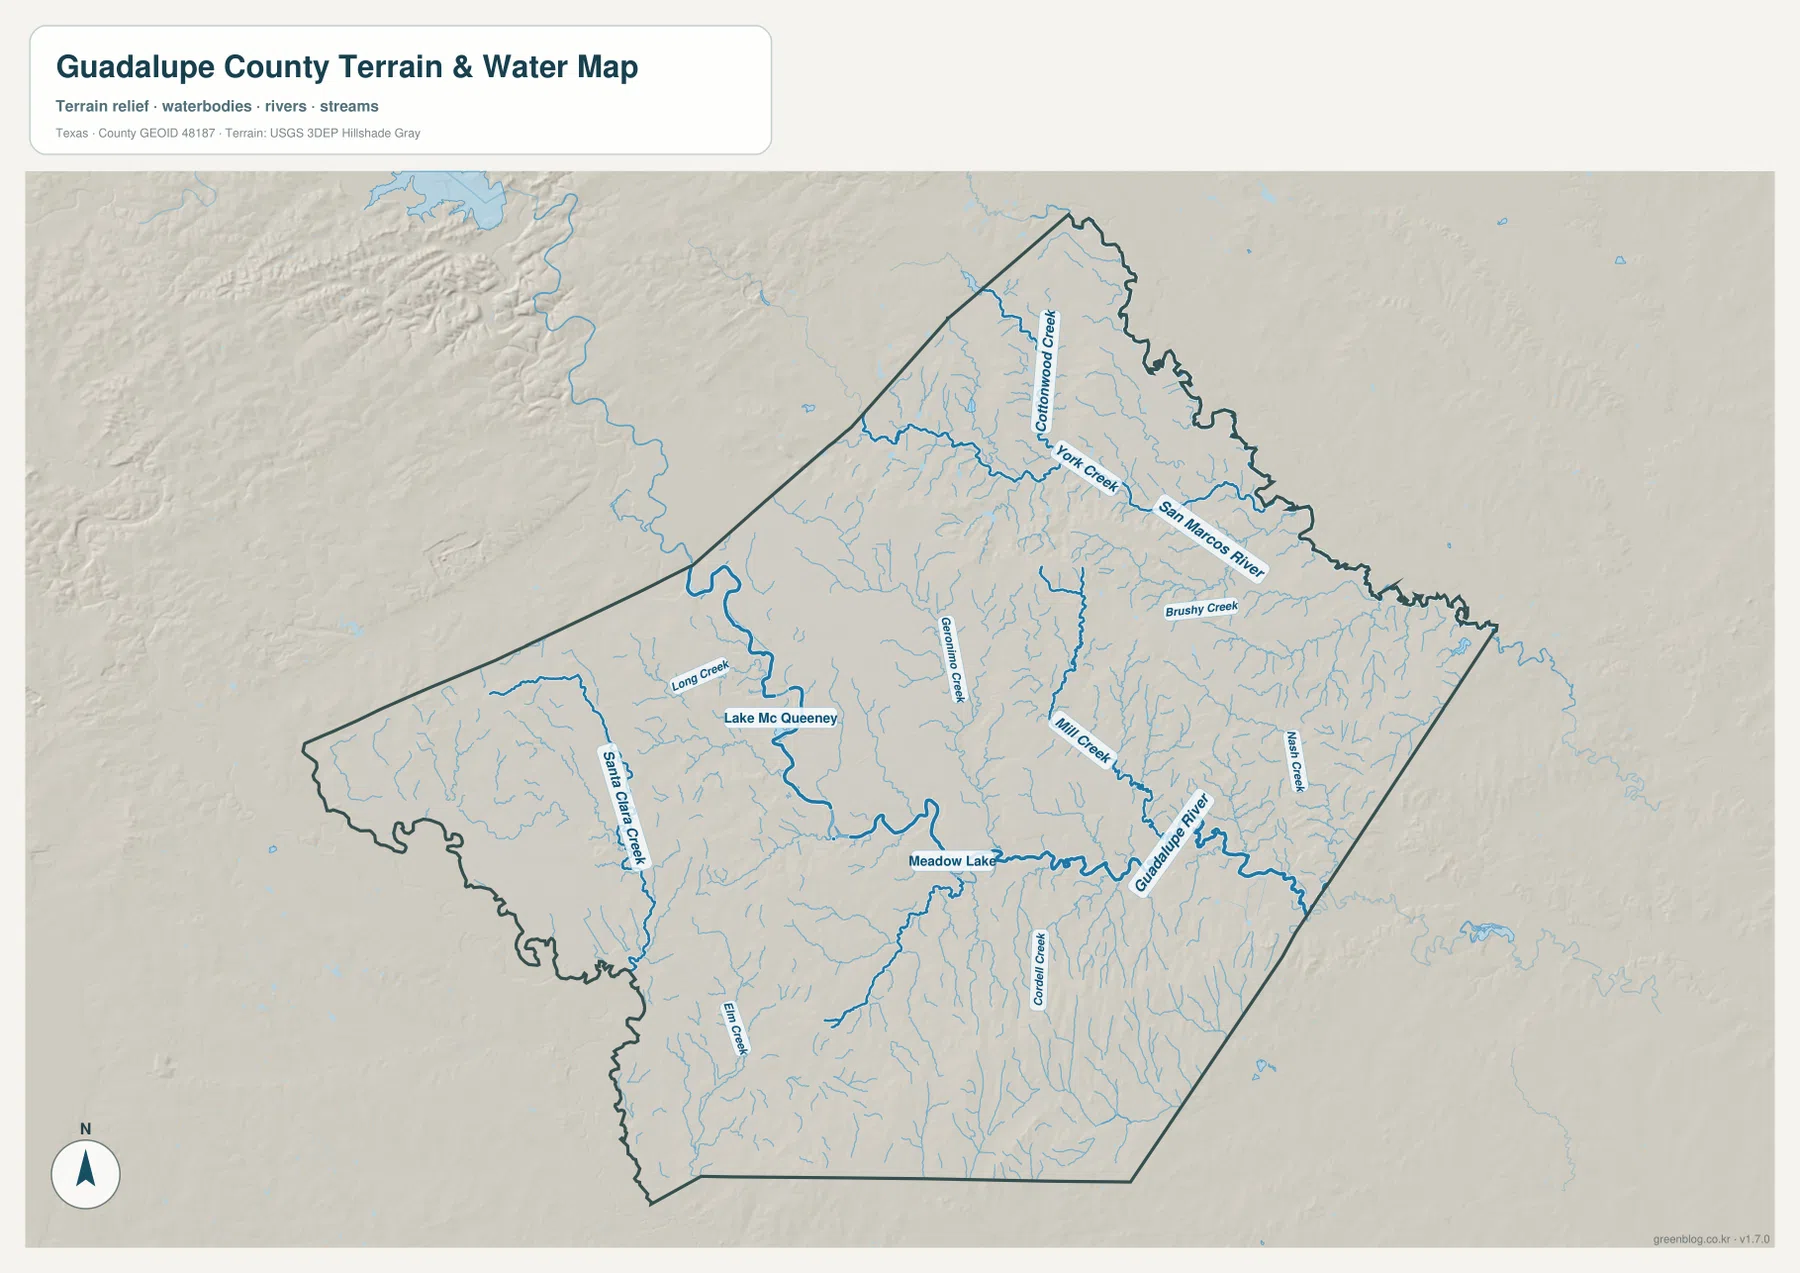
The terrain-and-water map is easiest to read by starting with its two largest named rivers. The San Marcos River crosses the northern part of the county toward the east, while the Guadalupe River runs through the central and southeastern area. Numerous smaller channels connect with these rivers, so the county is not represented by one isolated watercourse. The larger rivers provide the framework, and the creeks fill in the smaller valleys between them.
Lake McQueeney and Meadow Lake are prominent features along the Guadalupe River corridor. Lake McQueeney is shown in the west-central part of the county, and Meadow Lake appears farther east along a curving river section. When the water map is compared with the county map, their position relative to Seguin becomes much easier to understand. These water bodies are especially useful reference points because they are large enough to stand out even when many smaller streams are visible.
North of the central river corridor, Cottonwood Creek and York Creek are labeled near the San Marcos River, and Brushy Creek crosses the northeastern area. Geronimo Creek and Mill Creek appear closer to the middle of the county, while Nash Creek is labeled farther east. The map also contains many unnamed tributary lines between those features. Together they show why the terrain is cut by repeated shallow valleys rather than appearing as one broad flat surface.
The shaded terrain behind the waterways adds useful context without turning the map into a flood product. River and creek valleys appear as lower channels bordered by more textured ground, particularly around the Guadalupe River and across the north. The map does not provide flood probabilities, water depth, or navigational information, so it should be used to locate waterways and compare them with the surrounding terrain rather than to make safety or property decisions.
Elevation ranges from about 99 to 290 meters, with higher ground strongest in the west
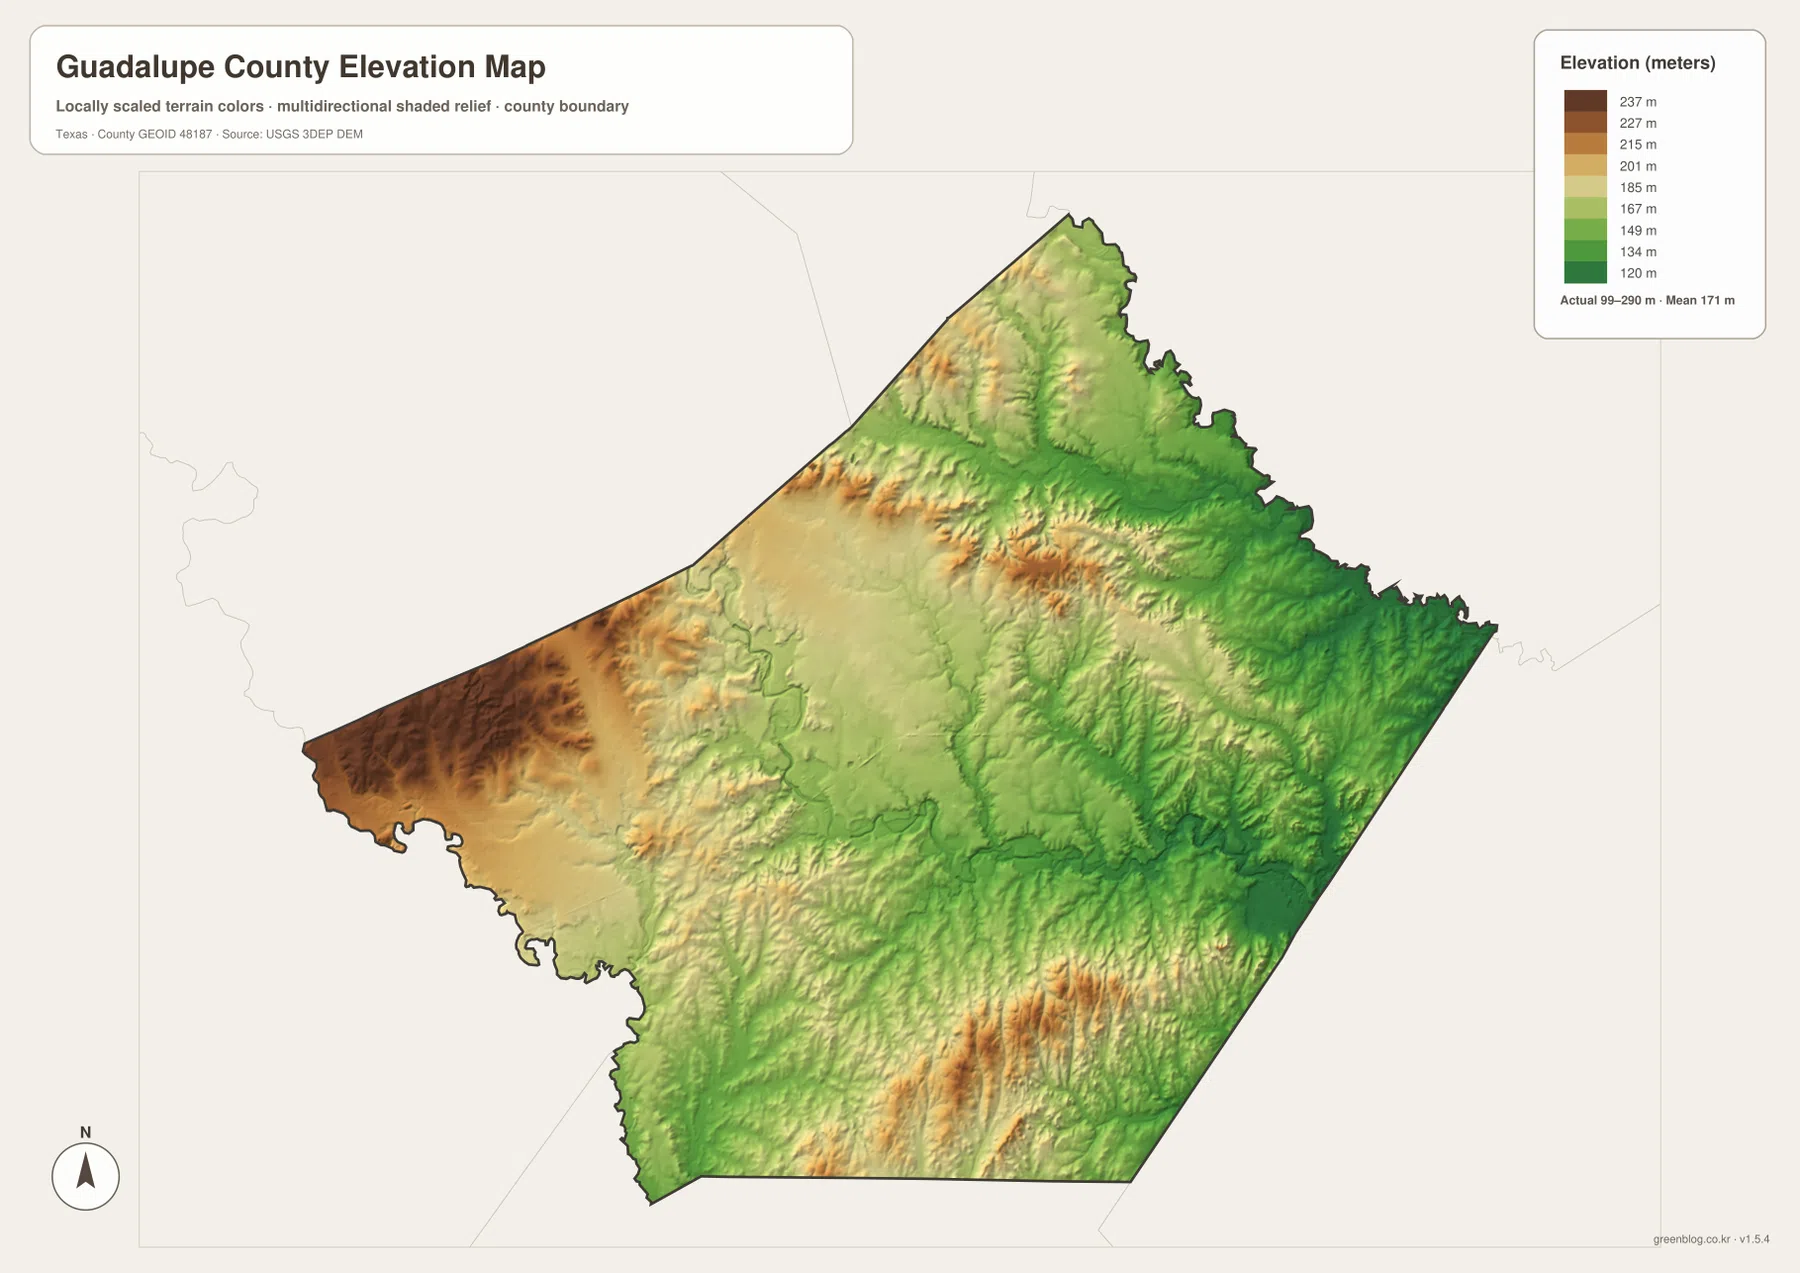
The elevation legend reports an actual county range of about 99 to 290 meters and a mean of about 171 meters. Greens mark the lower terrain, while yellow, orange, and brown indicate progressively higher ground. The darkest high areas are concentrated along the western edge and in several ridges toward the northwest, whereas much of the eastern half is green. The broad county pattern therefore shows higher western terrain giving way to lower land toward the east.
The surface is more varied than a simple west-to-east slope, however. A noticeable higher ridge runs through the north-central area, and another group of warm-colored ridges appears in the south-central part of the county. Green valleys cut between these higher strips, producing a repeated pattern of ridges and drainage corridors. The result is rolling terrain with many local changes in height rather than a single mountain or one uninterrupted plain.
Comparing the elevation map with the water map makes those changes easier to interpret. The Guadalupe River, San Marcos River, and several creek corridors line up with lower green channels in many places, while the yellow and brown ground rises between them. Looking at the western Schertz-Cibolo area, central Seguin, and the eastern boundary in sequence shows how much the surrounding elevation changes within the same county.
This elevation image is best used to compare broad relief across Guadalupe County. It is not a survey surface and should not be used to determine the exact elevation of a parcel, calculate road grade, or support construction decisions. For ordinary map reading, the 99–290 meter range, 171 meter mean, and visible contrast between high ridges and river valleys provide a clear summary of the county’s terrain.
Following I-10 and the river corridor ties the separate map views together
For road orientation, Interstate 10 is the simplest starting line. It passes through the Seguin area and continues east-west, linking the central county with the western communities and the routes that extend toward Luling. Route 123 gives a strong north-south reference through Seguin, while Route 46 points toward New Braunfels and Route 130 provides another major north-south corridor on the central and eastern side. These routes make it possible to place the city symbols before moving to the more detailed water and elevation views.
If the goal is to compare settlement, the ranked city map can be checked first and the county map used second for the actual road connections. That sequence makes the Schertz-Cibolo cluster easy to recognize and shows how Santa Clara and Marion sit between the western edge and Seguin. New Berlin’s southern position is also easier to remember when it is viewed relative to the main roads rather than as an isolated label.
For physical geography, Lake McQueeney and Meadow Lake are useful anchors. Find them on the water map, follow the Guadalupe River in both directions, and then locate the same corridor on the elevation map. The low green terrain around the river provides a visual connection between the two images. In the north, the San Marcos River and York Creek offer a similar way to match water features with local relief near the county boundary.
Choose the map by the question you need to answer
The general county map is the best choice when you need place names, highways, nearby communities, and the county outline in one view. The ranked city map removes much of that detail and makes the relative prominence and location of six selected cities easier to compare. For a lesson or reference sheet about rivers and lakes, the terrain-and-water map gives the clearest view of named waterways, while the elevation map is the better option for explaining the higher west and lower eastern valleys.
Printing works best when the map is selected for a specific purpose rather than when every layer is forced onto one page. A city-and-road handout can pair the county and city maps, while a physical geography sheet can place the water and elevation maps side by side. Because all four images use the same Guadalupe County boundary, readers can match Seguin, the river corridor, and the western edge across the different views without having to learn a new map extent each time.
The ZIP below contains the high-resolution JPG counterparts to the county, city, water, and elevation maps shown in this article. Each JPG is 3638×2572 pixels, larger than the web preview images and suitable for closer viewing or printing. Reviewing the previews first makes it easy to decide which file you actually need before opening the downloaded archive.
The downloaded images are reference maps rather than legal or engineering documents. For parcel boundaries, flood hazards, survey measurements, or design work, consult the appropriate current official source. When printing the JPG files, preserve the original aspect ratio and check paper size and margins so labels and county edges are not cropped.
Frequently Asked Questions
What is the easiest place to locate first on a Guadalupe County map?
Seguin is the most practical starting point because it sits near the center and is surrounded by major road markers, including Interstate 10 and Routes 123 and 130. After locating Seguin, the western Schertz-Cibolo cluster and the wider eastern half of the county are easy to place in relation to it.
Where are Lake McQueeney and Meadow Lake shown?
Both are most visible on the terrain-and-water map along the Guadalupe River corridor. Lake McQueeney appears in the west-central part of the county and Meadow Lake is farther east along a curving section of the river. Comparing that image with the county map helps place the lakes relative to Seguin and the surrounding roads.
What elevation range is shown for Guadalupe County?
The elevation legend shows an actual range of roughly 99 to 290 meters and a mean of about 171 meters. Higher brown terrain is strongest in the west and on several ridges, while greener lower ground is more extensive in the east and along river and creek valleys.
Sources and map reference notes
For official boundary, road, and place-reference data, see the U.S. Census Bureau TIGER/Line Shapefiles. Waterway information can be checked through USGS National Hydrography, while the elevation source is the USGS 3D Elevation Program.
The USGS The National Map Viewer is useful when you want to compare multiple federal map layers in one place. The county-specific descriptions on this page are based on the Guadalupe County preview maps and asset manifest supplied in the ZIP; the external links are provided for checking the underlying boundary, hydrography, and elevation data.
Map File Information
The ZIP includes four high-resolution JPG maps for Guadalupe County covering the county and roads, ranked cities, terrain and water, and elevation.
- Included Files: county map, city map, terrain and water map, elevation map
- Printable Size: 3638×2572 pixels
- File Type: JPG
Related Maps
- Wilson County Texas map
- Atascosa County Texas map
- Bandera County Texas map
- Bastrop County Texas map
- Travis County Texas map
Green Map creates custom-edited map images using open geographic data sources such as geoBoundaries, Natural Earth, OpenStreetMap, and government open data.
These maps are edited visual materials, not raw data files, and are provided for education, documents, presentations, and graphic reference.