Atascosa County Map readers often need more than a county outline, because the most useful features are spread between the paired central area around Jourdanton and Pleasanton, the far-northwest connection at Lytle, and smaller communities farther south. The maps on this page show the county boundary, roads and named places, the major city distribution, the Atascosa River and its tributaries, and the county’s elevation pattern. You can download the map files directly from this page as one ZIP containing four separate high-resolution A3 JPG maps for printing, study, or larger-format use.
The county is easier to understand when those layers are compared rather than read one at a time. Jourdanton and Pleasanton sit close together near the center, while Poteet lies to the north, Lytle occupies the far northwest corner, Charlotte is southwest of the central towns, and Christine is farther south. The Atascosa River enters from the northwest and crosses the county toward the southeast, while the elevation map shows higher ground in the northwest grading into lower river country toward the center and southeast.
Table of Contents
Jourdanton and Pleasanton form the county’s clearest center
The county reference map makes Jourdanton and Pleasanton the best starting points for orientation. Jourdanton, the county seat, is marked near the middle of the county with the Atascosa County Courthouse, and Pleasanton sits only a short distance to its northeast. State Highways 16, 97, and 173 converge around Jourdanton, while U.S. 281 provides a strong north-south reference near Pleasanton. Once those two towns are located, Poteet, Lytle, Charlotte, Christine, and the eastern road corridors become much easier to place.
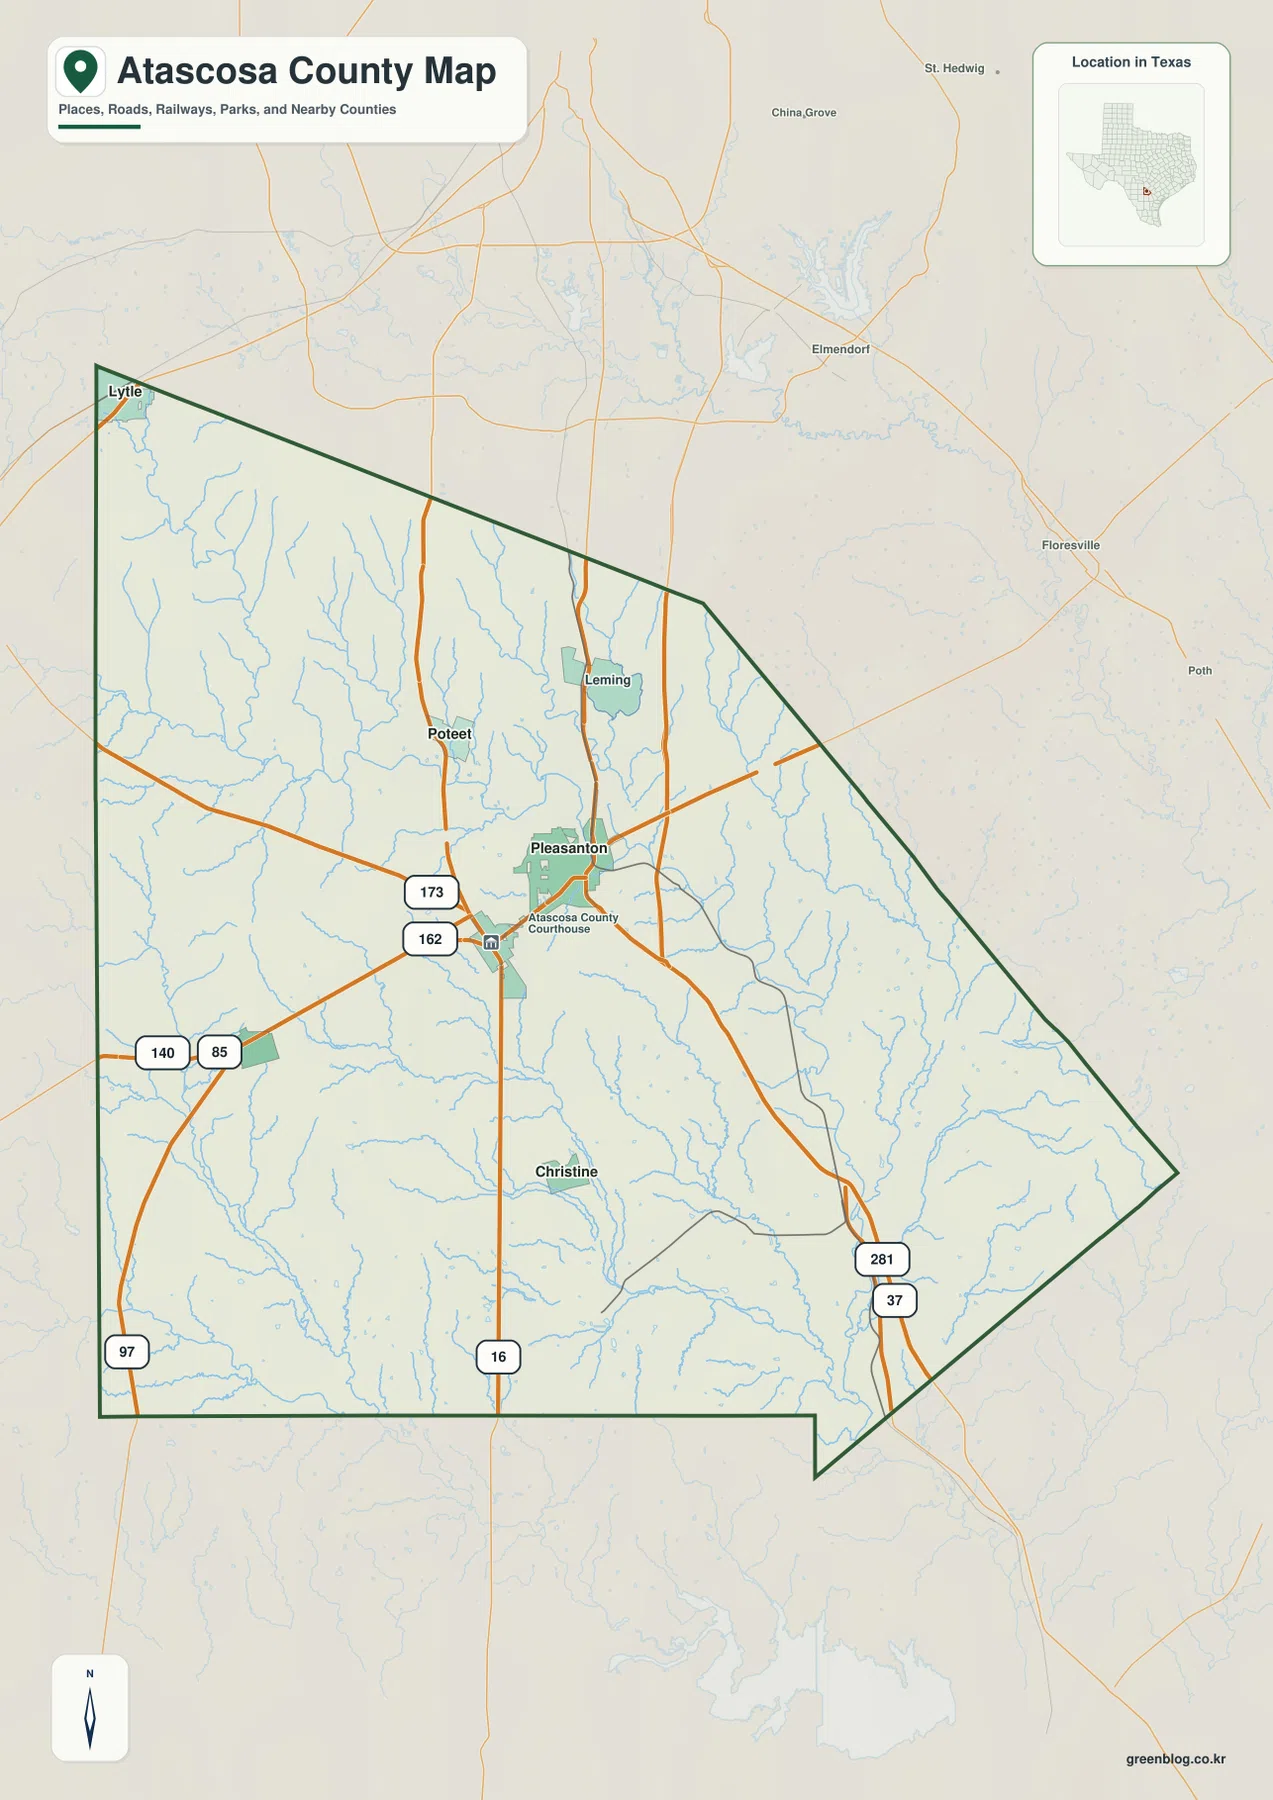
That central pairing also reflects the county’s history. The Handbook of Texas describes Jourdanton as a planned railroad stop founded in 1909, and Pleasanton as an older community about five miles northeast of Jourdanton. On the present map, the two places still appear as the most compact urban cluster in the county. Poteet is farther north along State Highway 16, while Lytle is separated from the central group at the northwest corner near Interstate 35.
Six mapped cities stretch from Lytle to Christine
The city map highlights six major places and shows how widely they are spaced. Its city index ranks Pleasanton first at 11,011, followed by Jourdanton at 4,407, Poteet at 2,910, Lytle at 2,492, Charlotte at 1,466, and Christine at 295. Those figures should be read as values used in the supplied map rather than as a substitute for the latest official population estimates, but they are useful for understanding why Pleasanton is drawn as the largest city in the set.
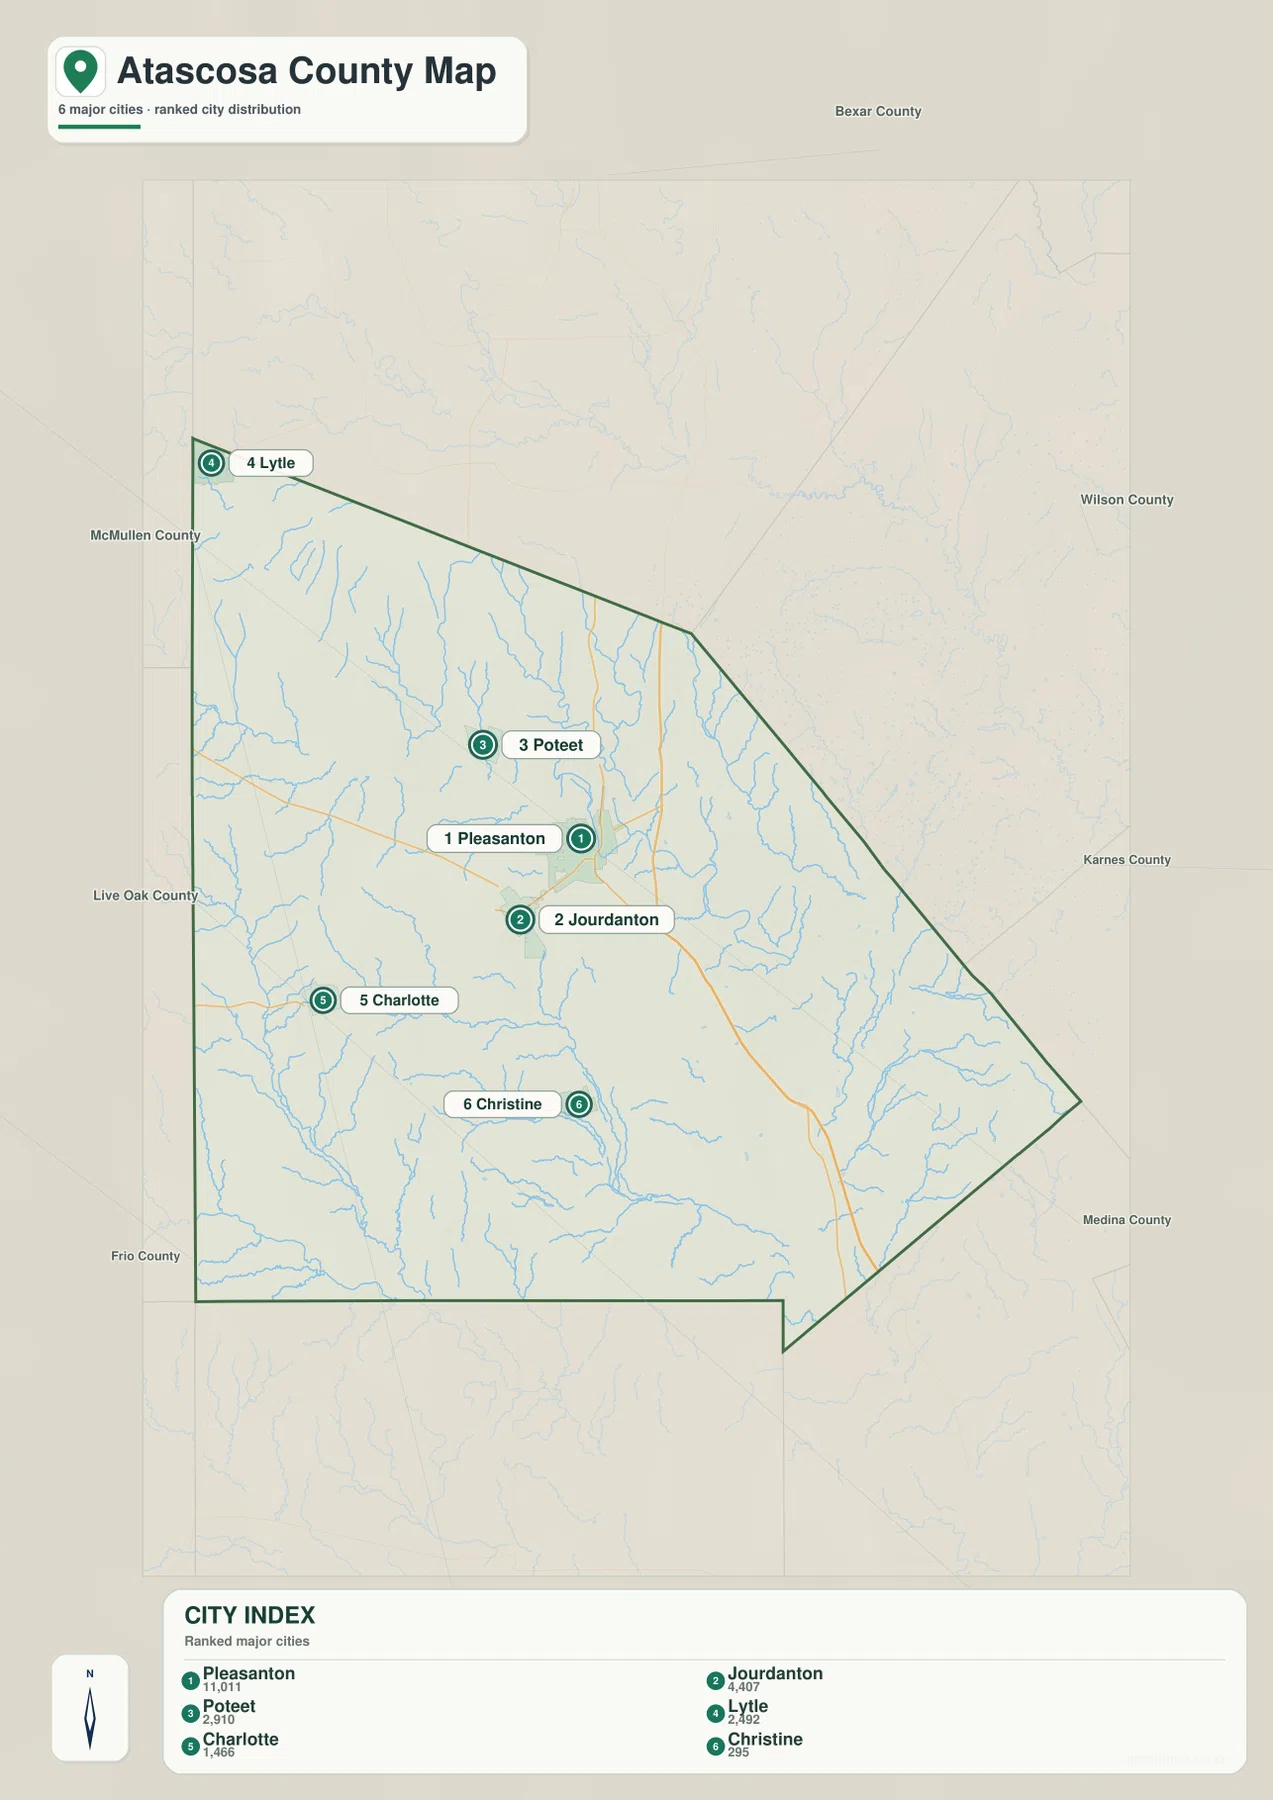
The spacing matters as much as the ranking. Lytle sits at the extreme northwest edge and its municipal limits extend into neighboring Bexar and Medina counties, so it should not be treated as a point that lies wholly inside Atascosa County. Poteet is north of the Jourdanton-Pleasanton pair, Charlotte is southwest of them, and Christine lies farther south. The result is a county in which the main places form several distinct local directions rather than one continuous urban corridor.
Roads make the scattered town pattern easier to follow
For a first pass, State Highway 16 is the most useful north-south guide because it links the Poteet area with Jourdanton and continues toward the southern part of the county. State Highway 97 crosses Jourdanton and helps establish the east-west orientation, while State Highway 173 is another recognizable route around the county seat. U.S. 281 runs through the Pleasanton side and continues southeast, giving the eastern half of the county a different road reference from the Highway 16 corridor.
The outer parts of the county connect to major highways in different directions. Lytle is on Interstate 35 in the far northwest, while Interstate 37 runs near the southeastern side of the county. The reference map also shows routes 85 and 140 toward the western side and Route 97 extending across the southwest. Remembering the central highways first, then the two interstate corridors at opposite edges, makes it easier to use the map without getting lost among smaller roads.
The Atascosa River organizes the water map
The dominant water feature is the Atascosa River, shown as a thick blue line entering from the northwest, turning across the middle of the county, and continuing southeast. The Handbook of Texas describes the river as forming near Lytle and then running southeast through Atascosa County before eventually reaching the Frio River in Live Oak County. That broad course matches the supplied water map and explains why so many smaller creeks point toward the same central drainage line.
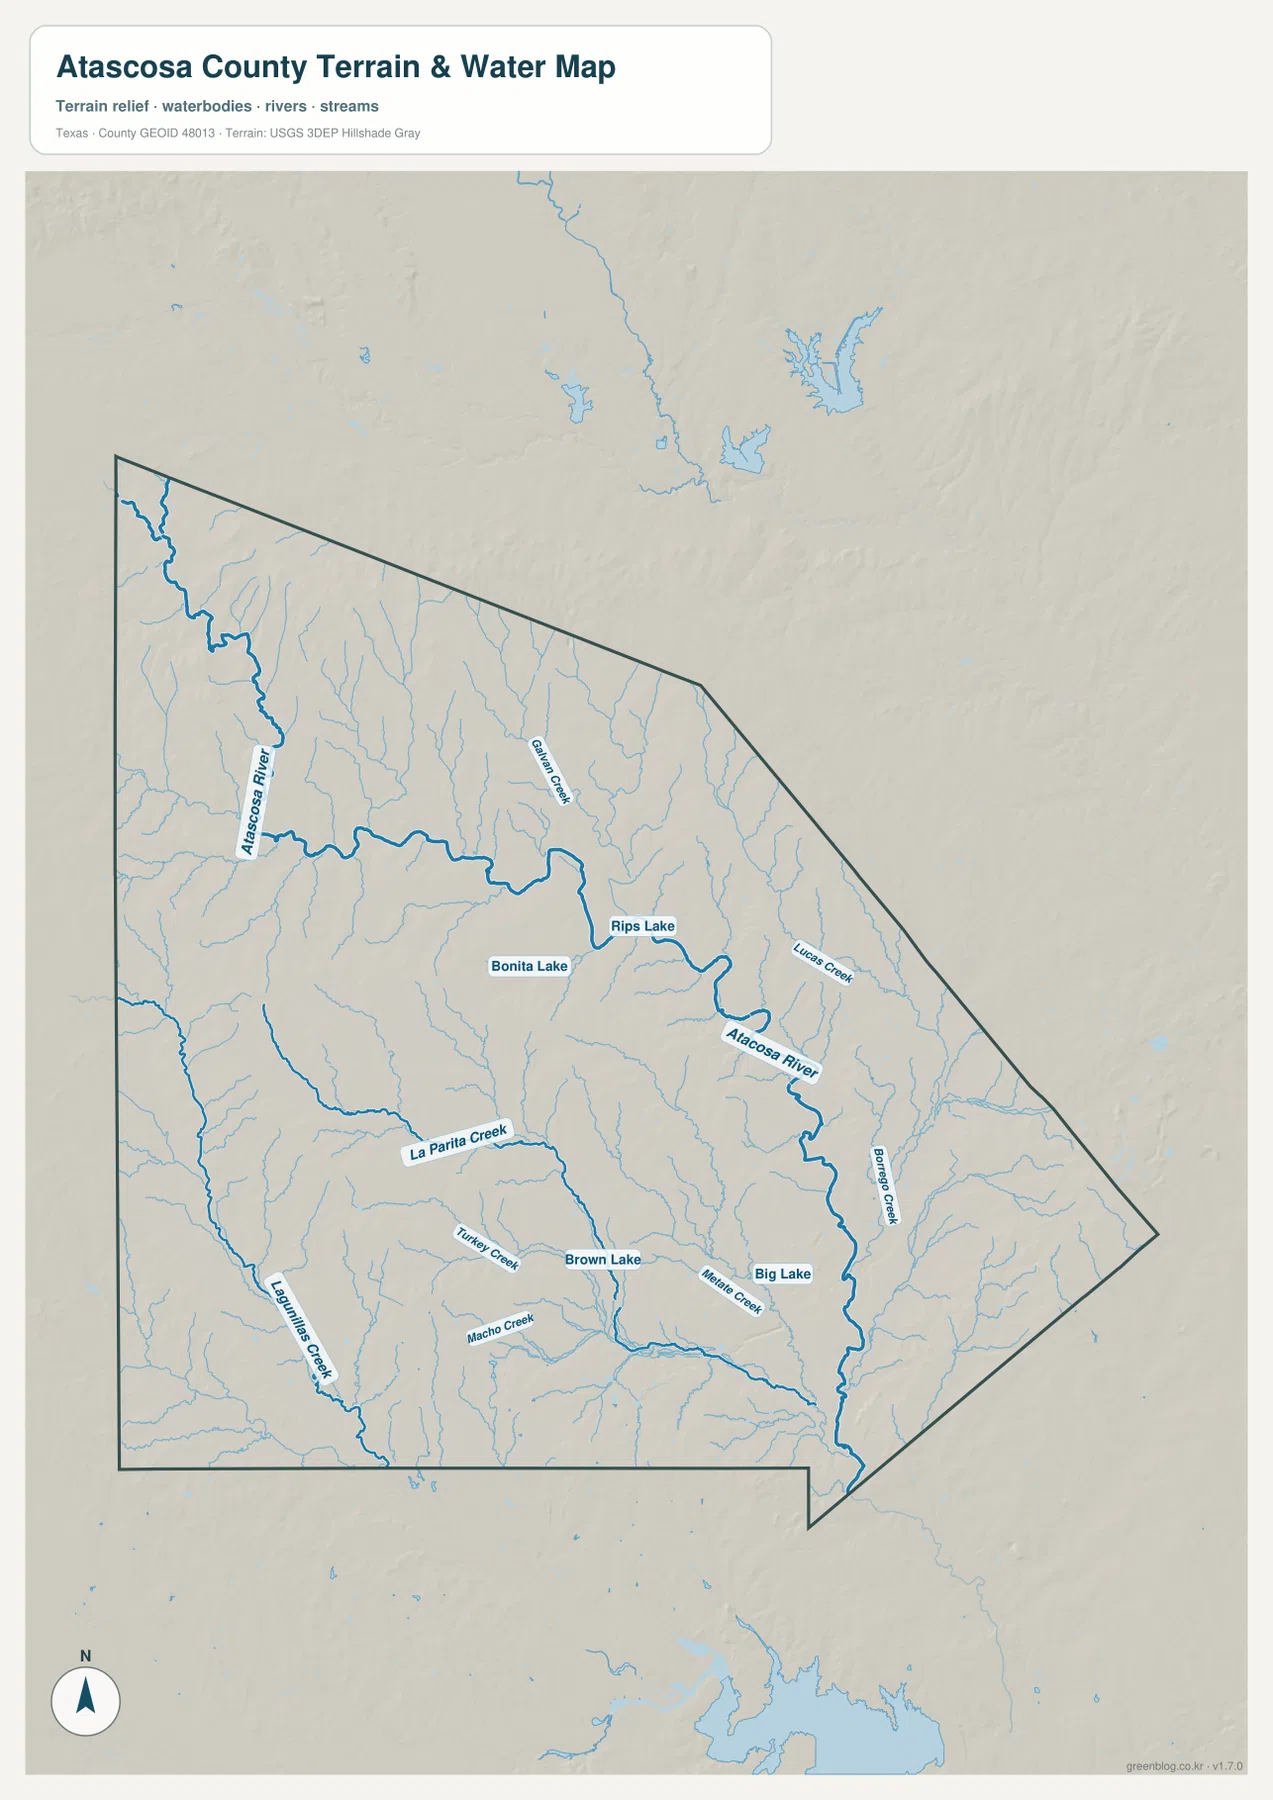
Several named tributaries provide useful local reference points. Galvan Creek enters the river from the north-central area, Lucas Creek is labeled on the eastern side, and La Parita Creek crosses the southern half before joining the larger drainage network. Turkey Creek, Macho Creek, and other smaller streams fill in the southern and western parts of the map. Bonita Lake and Rips Lake are close to the central river course, while Brown Lake and Big Lake appear farther south, showing that small water bodies are scattered rather than concentrated in a single reservoir district.
This water layer is best treated as a location and terrain reference. It shows rivers, streams, and mapped water bodies, but it is not a flood-risk map, navigation chart, parcel map, or statement of legal water boundaries. For those purposes, a current agency product designed for the specific question should be used instead.
Elevation drops from the northwest toward lower river country
The elevation legend gives an actual mapped range of about 51 to 245 meters, with a mean near 131 meters. Higher browns and tans dominate the northwest, while greener lower elevations become more common across the center and southeast. Atascosa County is not mountainous, so the map is showing broad rolling relief and shallow valleys rather than dramatic peaks. Even so, the color change is strong enough to reveal a clear northwest-to-southeast decrease in elevation.
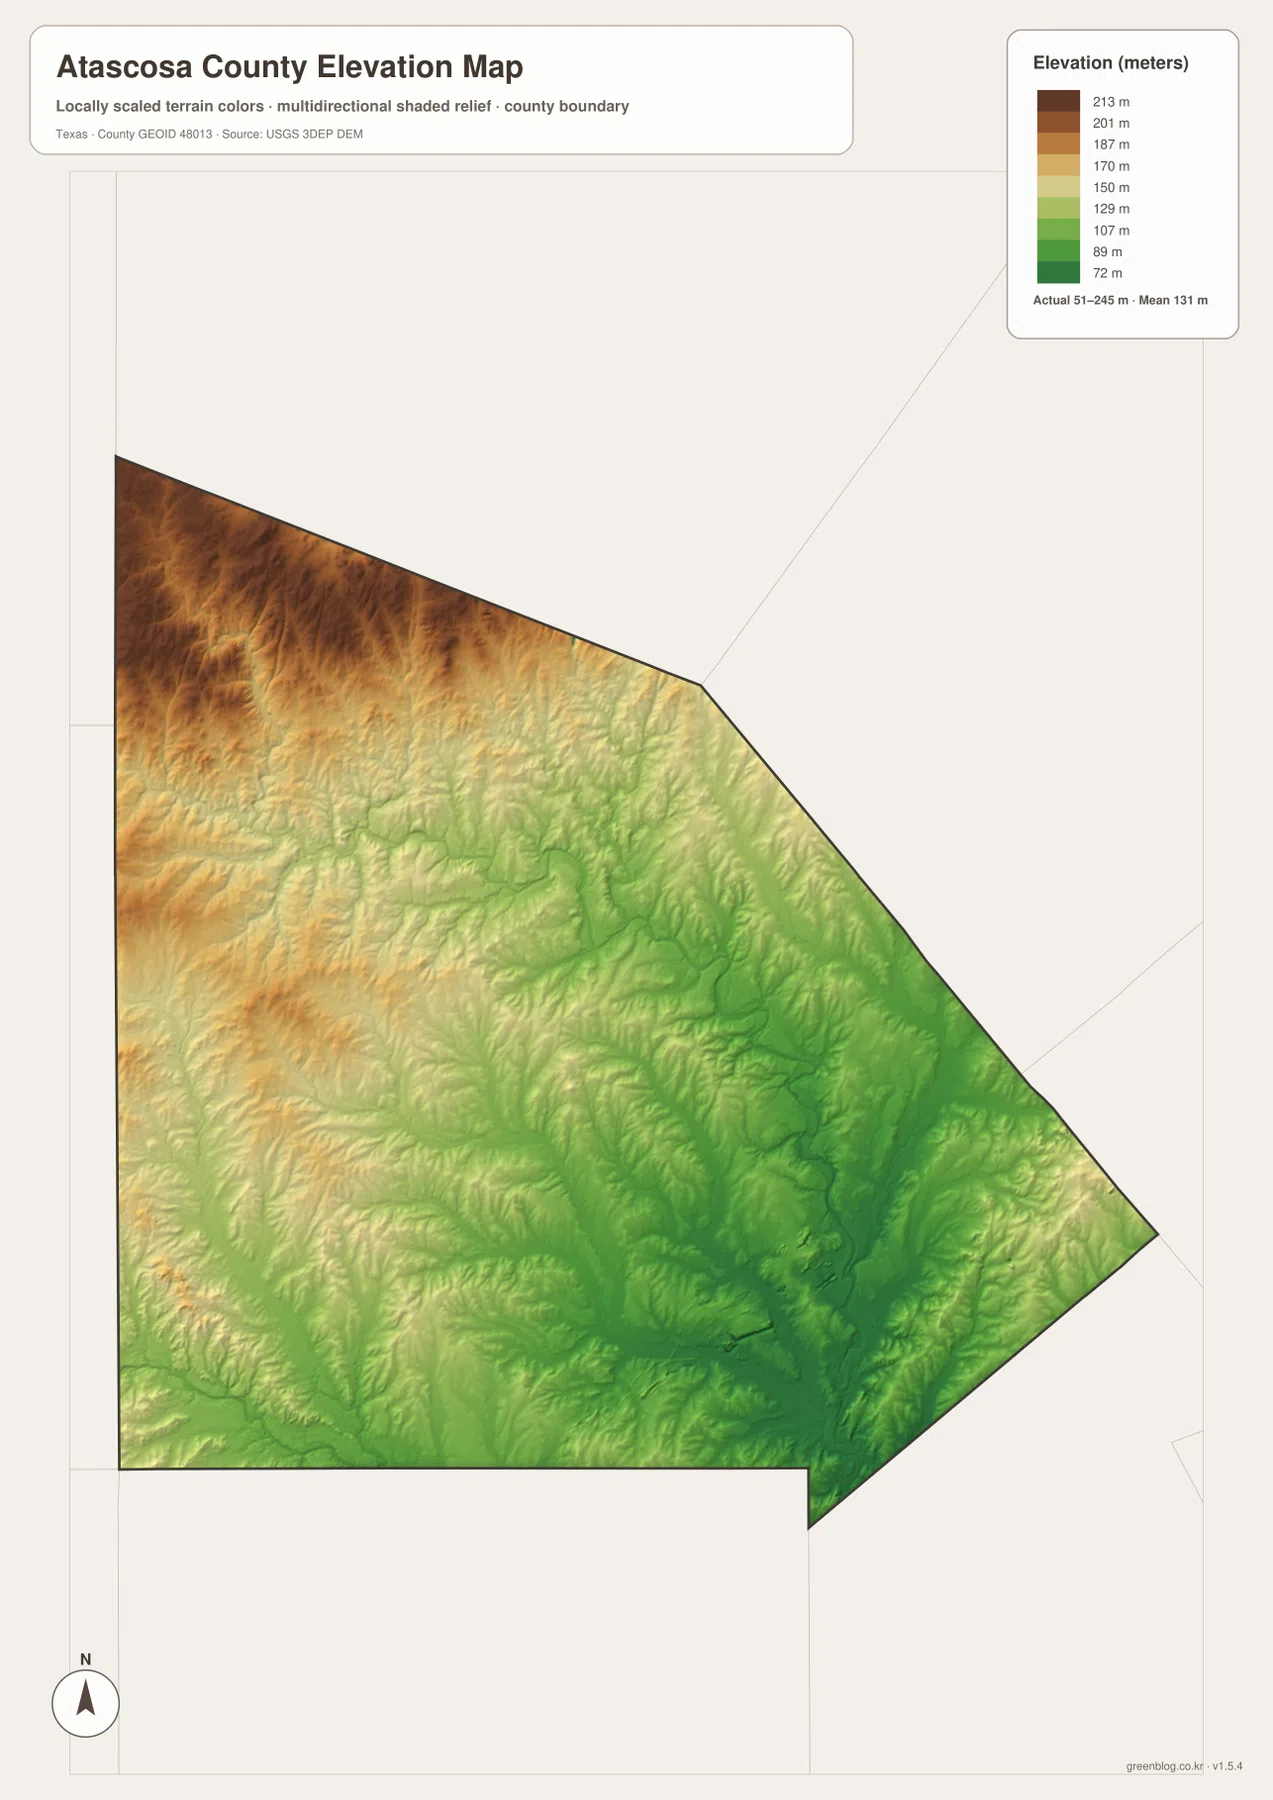
Comparing this layer with the water map makes the relief easier to interpret. The Atascosa River and several tributary valleys occupy lower green areas, while the far northwest remains higher. Poteet and Lytle sit closer to the higher side of the county, whereas the river continues into lower southeastern terrain. Because the elevation surface is generalized for county-scale comparison, it should not be used as survey-grade or engineering-grade elevation data.
What the four maps reveal when they are compared
The reference map explains the road network, but the city map shows that the road network serves several separate settlement directions. Jourdanton and Pleasanton form the central pair, Poteet extends the settled area northward, Lytle creates a distinct northwest connection to the San Antonio side, and Charlotte and Christine pull the pattern south and southwest. That arrangement is more informative than simply listing the six names because it shows why different routes matter in different parts of the county.
The water and elevation maps add another layer to the same pattern. The Atascosa River crosses the middle of the county and continues into lower southeastern ground, while the northwest remains higher and connects toward Lytle and Poteet. Smaller creeks branch through the central and southern areas, so many road crossings and local place relationships make more sense when the drainage network is visible. The county therefore reads as a combination of a central urban pair, scattered outer towns, one dominant river, and gently changing South Texas relief.
Choosing the most useful map for your task
Use the county reference map when you need named places, road numbers, streams, and the county outline together. The city map is cleaner when the main question is where Pleasanton, Jourdanton, Poteet, Lytle, Charlotte, and Christine sit relative to one another. The water map is the better choice for tracing the Atascosa River and named creeks or locating small lakes, while the elevation map is most useful for comparing the higher northwest with lower terrain toward the center and southeast.
For a school project or printed county profile, the reference map and elevation map work well as a pair because they connect settlement and roads with the shape of the land. If the topic involves natural drainage, add the water map so that the Atascosa River and tributaries are visible. When a larger image is needed, use the downloadable A3 JPG files rather than enlarging the web preview.
A few details to keep in mind when reading the maps
The population values printed in the supplied city index belong to the map’s dataset and should not be treated as the latest official estimates without checking a current Census release. Lytle also requires special attention because the city extends across Atascosa, Bexar, and Medina counties. If a precise municipal or county boundary is important, use the boundary line on the reference map and verify the current legal boundary with an authoritative source.
The elevation colors are locally scaled to Atascosa County. A brown or green shade on this map should therefore be interpreted with its own 51–245 m legend rather than compared directly with the same color on another county’s map. The water map has a similar limitation: it is designed to show the relative locations of rivers, creeks, and lakes, not current flood conditions, water quality, or property rights.
Frequently Asked Questions
How close are Jourdanton and Pleasanton on the map?
They form the closest major pair in central Atascosa County, with Jourdanton southwest of Pleasanton. The Handbook of Texas places Pleasanton about five miles northeast of Jourdanton, which matches the compact relationship visible on the county map.
Which direction does the Atascosa River cross the county?
The river enters from the northwest, bends through the middle of Atascosa County, and continues toward the southeast. Galvan Creek, Lucas Creek, La Parita Creek, and other tributaries connect to that larger drainage system.
Where is the highest ground shown on the elevation map?
The highest colors are concentrated in the northwest, while the central and southeastern parts of the county are lower. The supplied legend shows an overall mapped range of about 51–245 m and a mean near 131 m.
Map File Information
The ZIP contains four high-resolution A3 JPG files for Atascosa County: the county reference map, city map, water map, and elevation map. They are suitable for larger viewing, printing, classroom material, and personal reference.
- Included Files: County map, city map, water map, elevation map
- File Type: ZIP containing four high-resolution A3 JPG files
Related Maps
Sources and references
County and place background can be checked in the Handbook of Texas entry for Atascosa County, while the Atascosa River entry provides additional river context. Boundary data are available from the U.S. Census Bureau TIGER/Line program, hydrography can be checked through USGS National Hydrography, and elevation data are available from the USGS 3D Elevation Program.
Green Map creates custom-edited map images using open geographic data sources such as geoBoundaries, Natural Earth, OpenStreetMap, and government open data.
These maps are edited visual materials, not raw data files, and are provided for education, documents, presentations, and graphic reference.