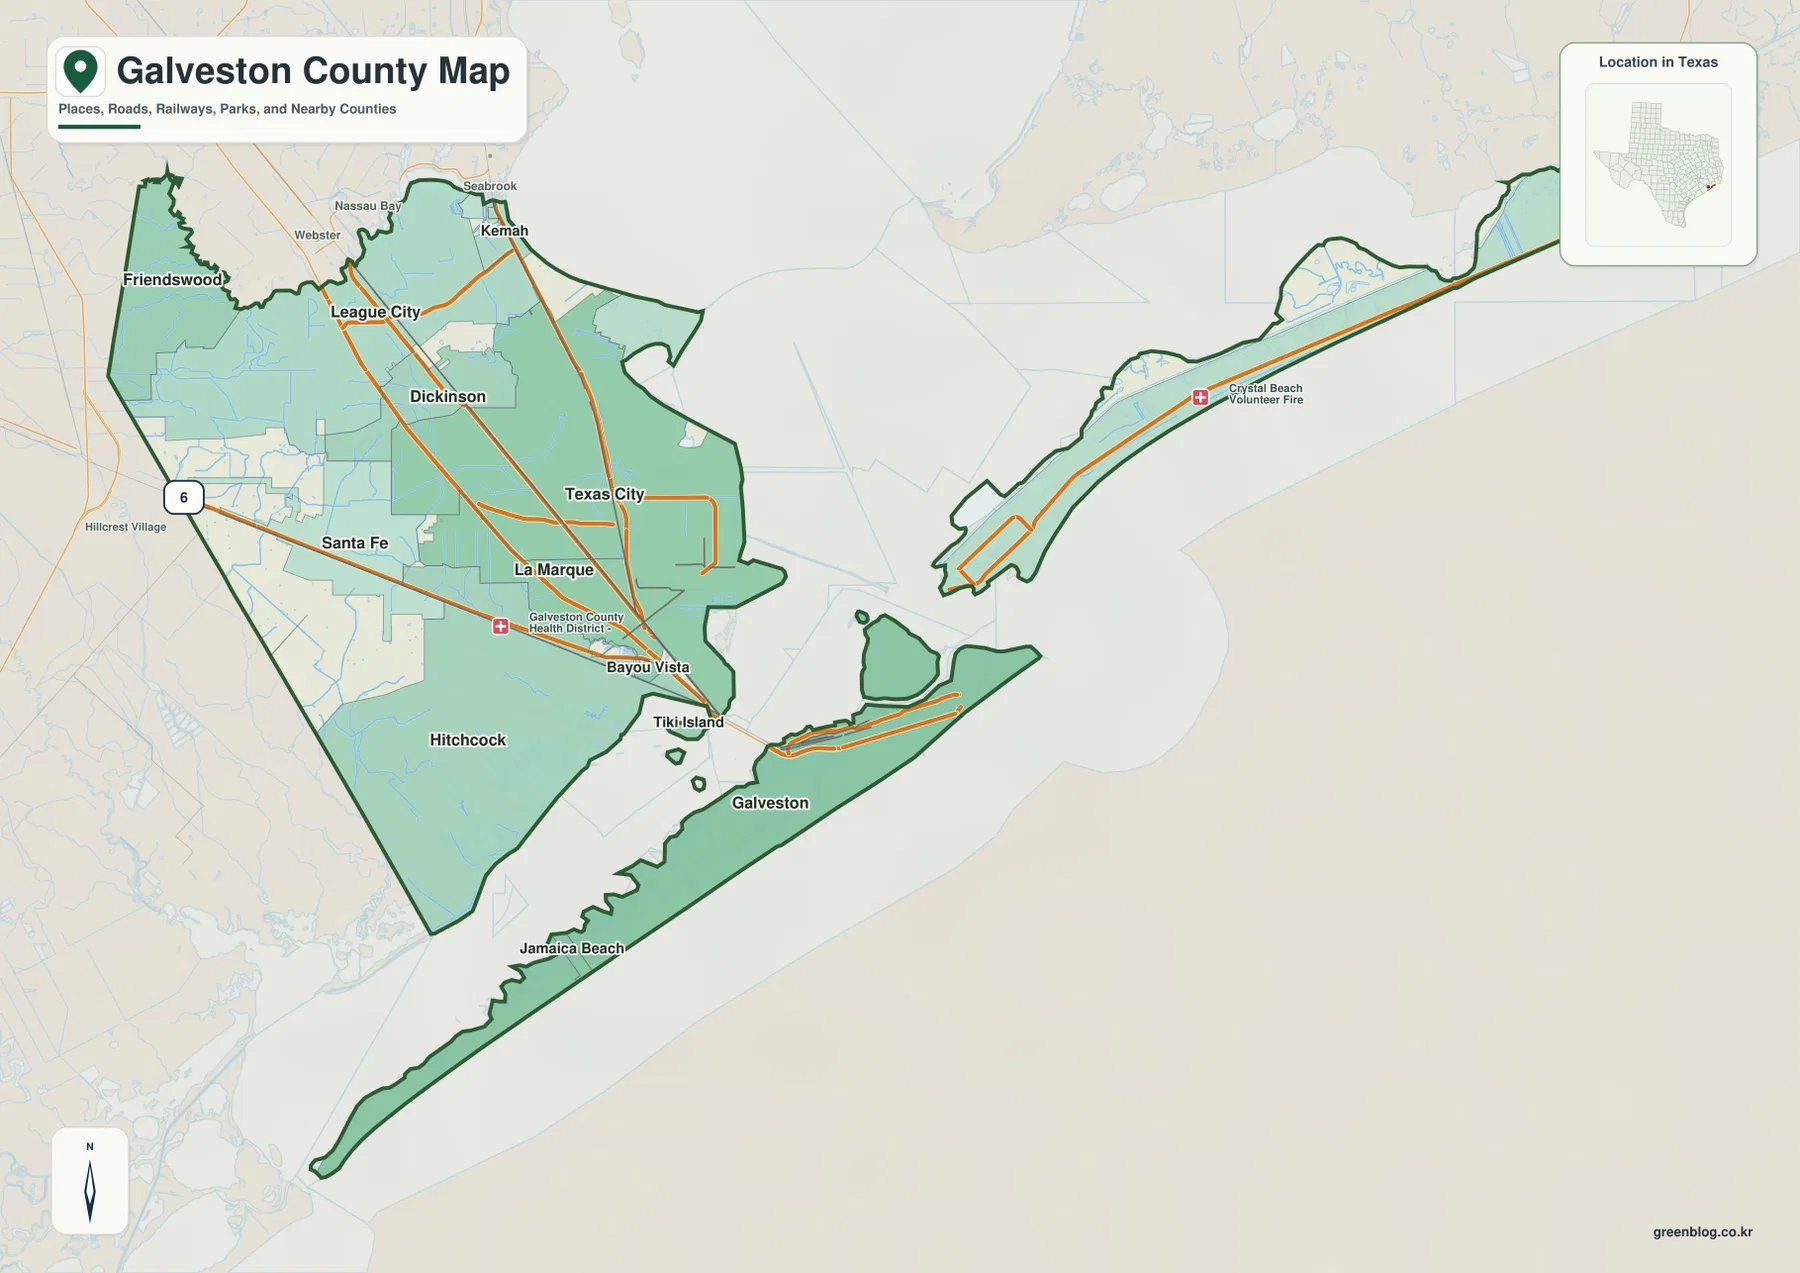
Download high-resolution A3 JPG maps of Galveston County, Texas from the ZIP box on this page, including the county, city, water, and elevation views shown below. This county is shaped as much by water as by land: League City and Friendswood occupy the northern mainland, Texas City and La Marque sit farther south near the bay, and Galveston and Jamaica Beach lie on the long island along the Gulf-facing edge. East of the main bay, Crystal Beach is shown on another narrow coastal strip. Reading the maps together makes it clear that roads, cities, bays, islands, and very low coastal terrain all contribute to the county’s unusual shape.
For orientation, start with the mainland corridor from League City through Dickinson and La Marque toward Galveston. Texas City sits east of that line on the mainland side of Galveston Bay, while Santa Fe and Hitchcock are farther west. Kemah appears at the northern edge of the bay, and the county then stretches far eastward along the coast to the Crystal Beach area. The northern mainland has the densest city pattern, but the county extends well beyond that urban cluster through bays, islands, canals, marshy lowlands, and barrier shore.
Table of Contents
From League City to Galveston Across the Mainland-Island Corridor
The general county map makes the north-south mainland corridor the easiest route to follow. Interstate 45 links the League City area with Dickinson, La Marque, and Galveston, continuing across water to the island. League City is near the northern end of the county’s busiest urban band, with Kemah to the northeast and Friendswood to the west. Moving south brings Dickinson, Texas City, and La Marque into a tighter cluster before the road reaches the island.
State Highway 6 is clearly marked on the western side near Santa Fe, giving the mainland another strong road reference away from Interstate 45. Hitchcock lies south of Santa Fe, and Bayou Vista and Tiki Island appear near the narrow water crossings between the mainland and Galveston. Here, transportation is strongly influenced by the shape of the coast: routes cannot simply continue in straight lines when bays, channels, and small islands occupy the gaps.
Galveston sits on the long island in the south, with Jamaica Beach farther west along the same coastal strip. Crystal Beach is shown far to the northeast on a separate narrow coastal area. Two places can look relatively close on a small map while broad water lies between them, so the county map should be read by land-and-water connections rather than by straight visual spacing alone.
Six Ranked Cities from the Northern Mainland to Galveston Island
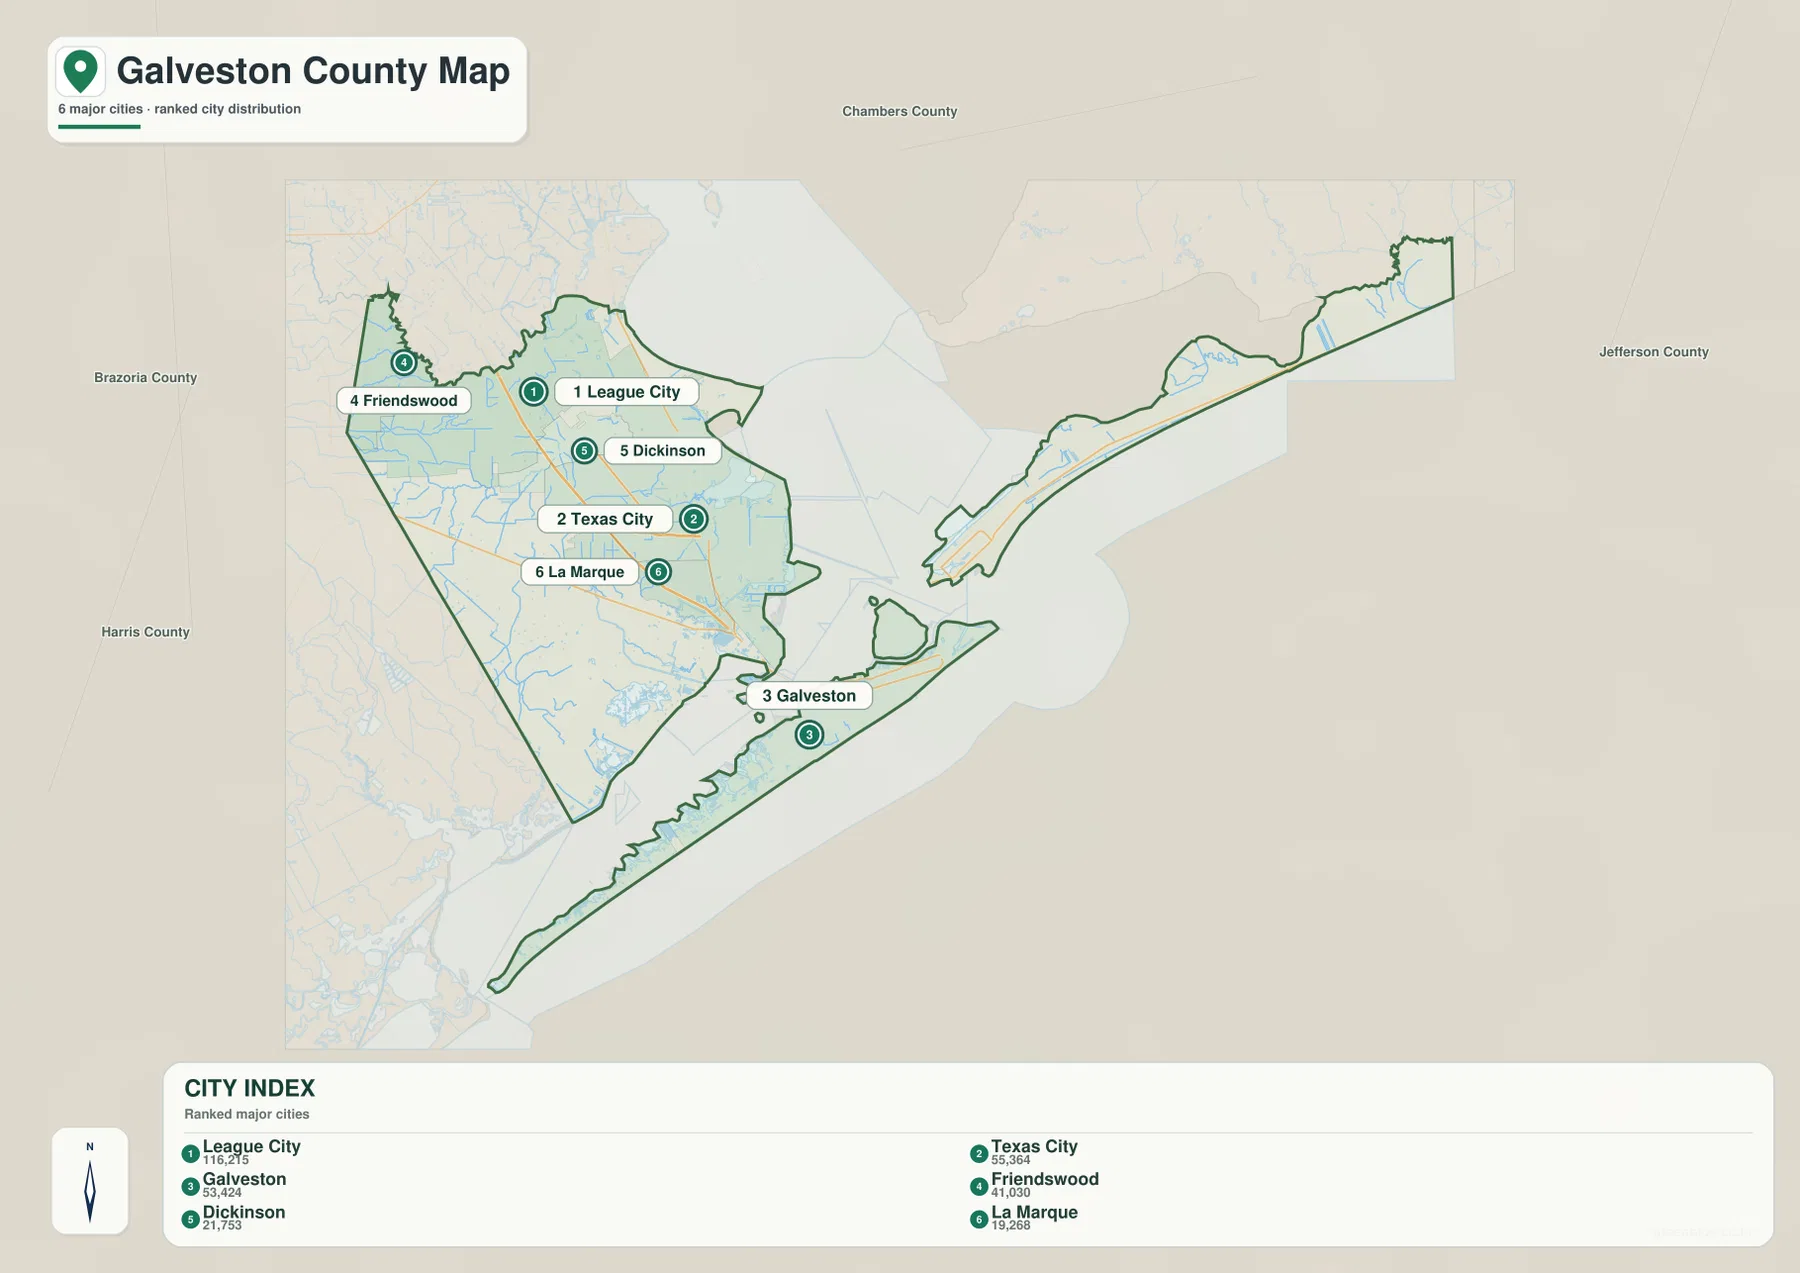
The city map highlights six communities. League City is ranked first at 116,215, followed by Texas City at 55,364 and Galveston at 53,442. Friendswood is fourth at 41,030, Dickinson fifth at 21,753, and La Marque sixth at 19,268. These values are printed on the supplied CITY INDEX and provide a useful size comparison, but the map becomes more informative when the city positions are considered at the same time.
League City and Friendswood are grouped in the northern mainland, while Dickinson lies farther south between that northern cluster and the Texas City–La Marque area. Texas City is pushed toward the bay on the mainland, and Galveston is physically separated on the island. This arrangement means that the six cities do not form one simple line or one compact urban center. They occupy different parts of the mainland and coast, with water creating real separation between some of the most important places.
Galveston being third rather than first in the city ranking is also useful context. The county and its best-known island city share the same name, but League City has the largest displayed city value. At the same time, Galveston remains the clearest reference for the island, bay entrance, and southern coastal geography. Population rank and geographic importance therefore provide different kinds of information on these maps.
The city graphic does not provide straight-line mileage connectors, so it should not be used to estimate exact distances between the six communities. Use it to compare rank and relative placement, then return to the general county map when road connections, water crossings, or smaller place names matter.
Galveston Bay, East Bay, and the Mainland Creek Network
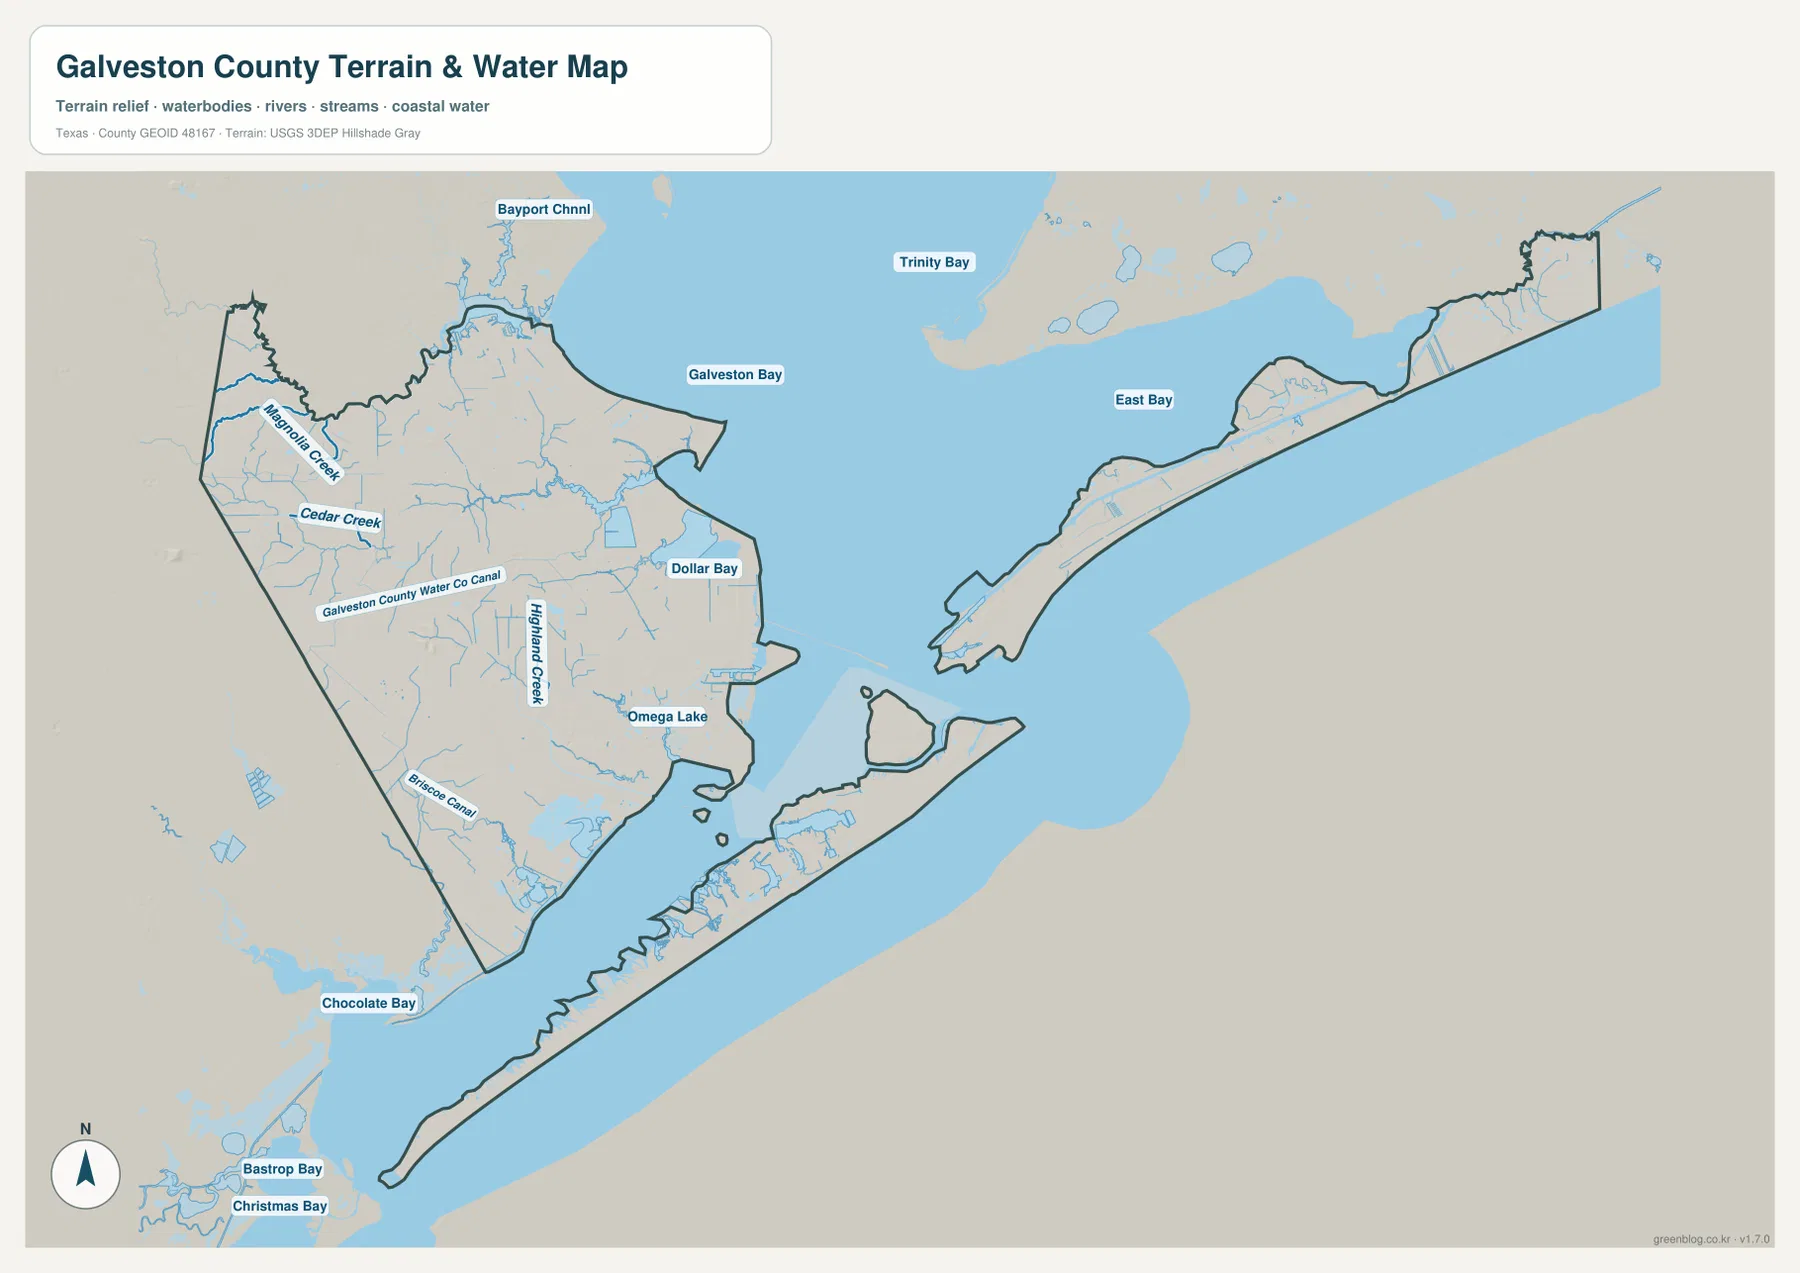
Galveston Bay dominates the water map and occupies much of the open space between the mainland and the eastern coastal sections of the county. Trinity Bay continues to the north, while East Bay lies inside the long eastern coastal strip near the Crystal Beach side. Dollar Bay is labeled near the Texas City side of the main bay. The scale of these water bodies explains why the county boundary looks fragmented and why communities that are close in a straight line may require very different travel routes.
The mainland contains a second, finer network of waterways. Magnolia Creek and Cedar Creek run through the western and northwestern interior, while Highland Creek appears farther south. The Galveston County Water Co Canal and Briscoe Canal are also labeled, showing that the water map includes both natural drainage and constructed channels. Omega Lake sits in the south-central mainland, and Bayport Channel appears near the northern bay edge.
The southwestern coast has its own set of smaller bays. Chocolate Bay lies close to the mainland edge, with Bastrop Bay and Christmas Bay farther southwest outside the main Galveston Bay basin. These names show that the county’s coastal geography is not one large bay with a single shoreline. Large bays, smaller embayments, creeks, canals, islands, and narrow water passages repeat across the map.
This water reference is intended for geographic orientation, not for flood-risk, depth, legal shoreline, or navigation decisions. Coastal water levels and storm conditions can change quickly, and the map does not replace specialized hazard or marine information. Its strongest use is showing where the major bays and smaller waterways sit relative to League City, Texas City, Galveston, and the long coastal landforms.
Very Low Islands and Bay Shores Versus Higher Western Mainland
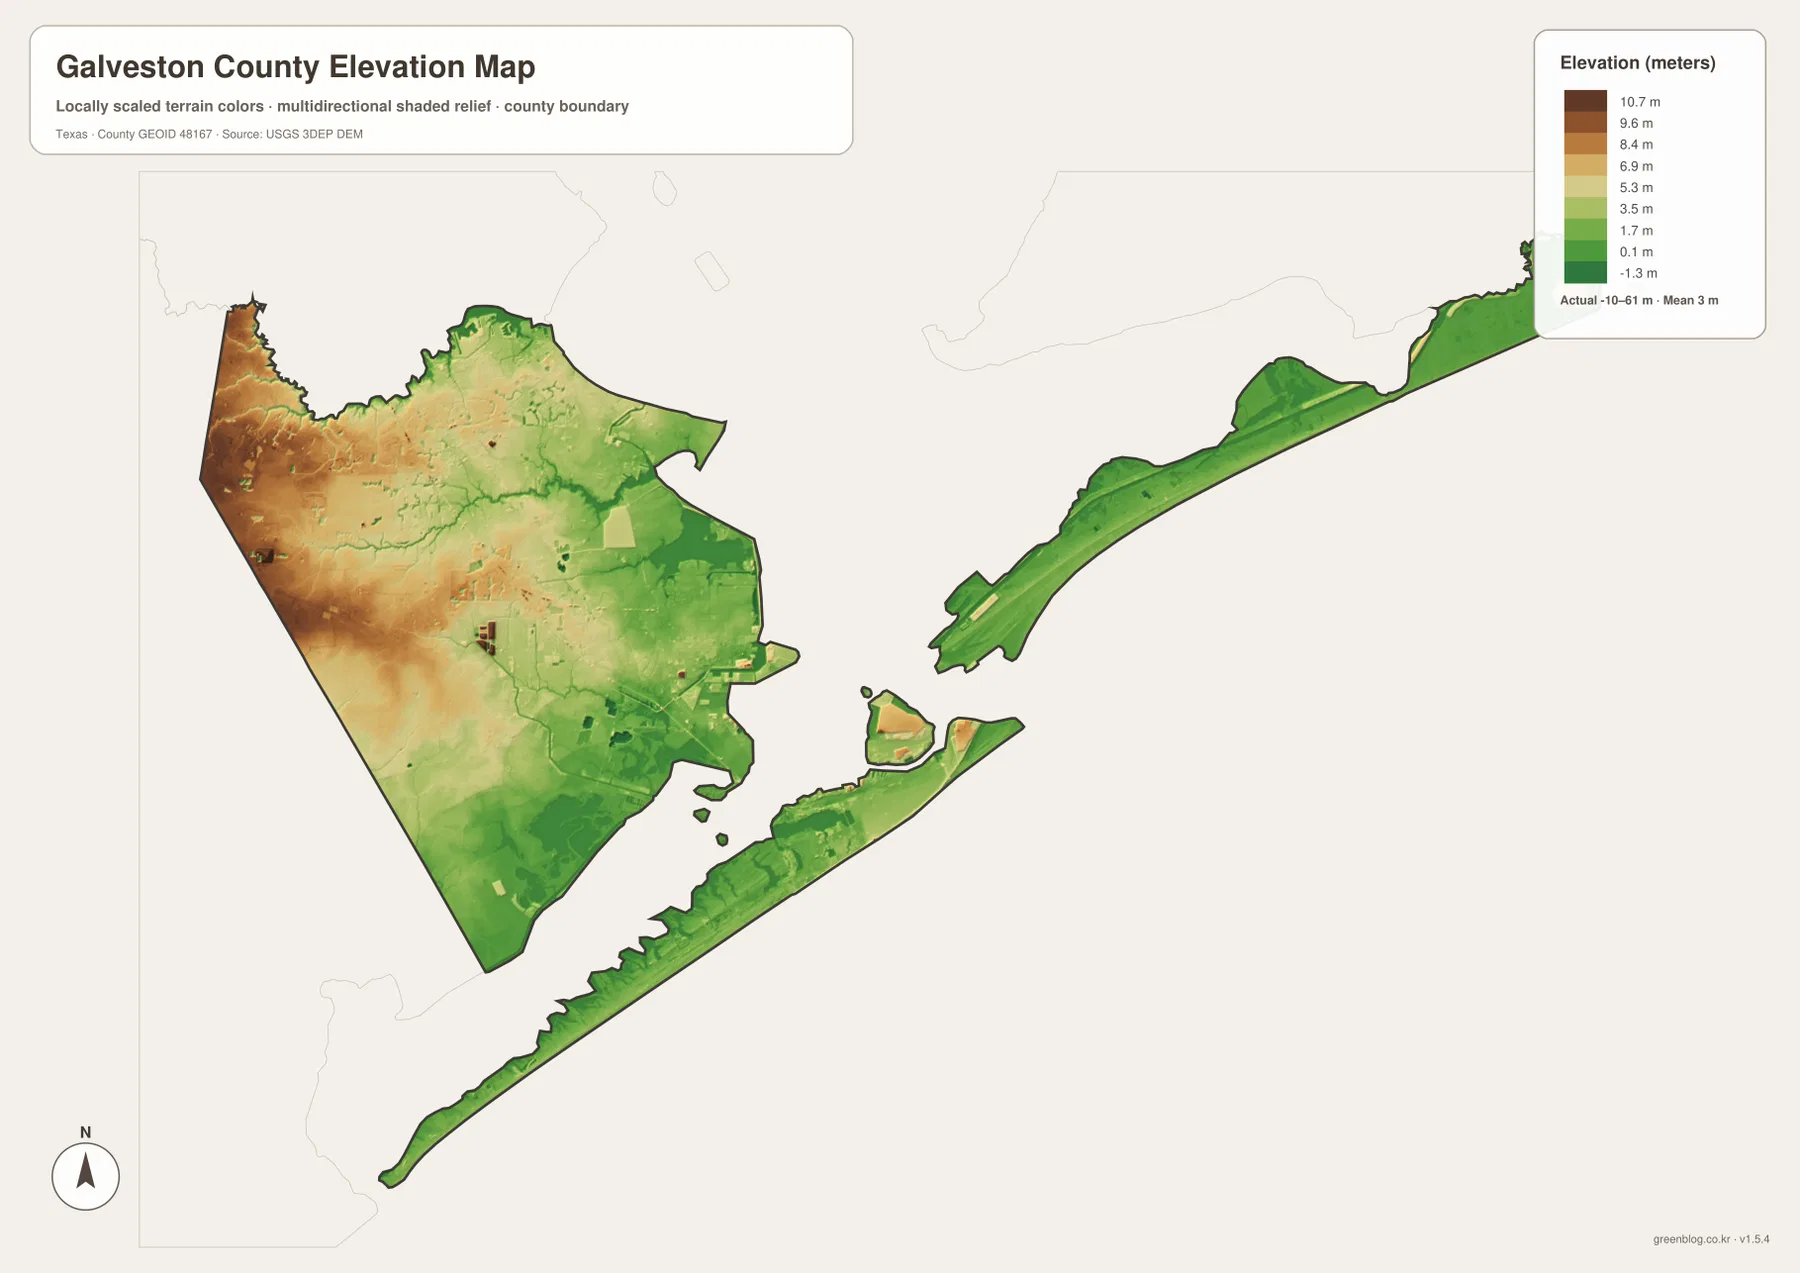
The elevation map lists an actual range of about -10 to 61 meters and a mean near 3 meters. The strongest brown and tan colors are concentrated on the western and northwestern mainland, where the county reaches its higher mapped ground. Moving east and south toward the bay, the colors become progressively greener. Galveston Island and the long eastern coastal strip are mostly shown in low green shades, emphasizing how close much of the county lies to sea level.
The mainland is not uniformly high. Friendswood and the western Santa Fe side contain more of the warmer elevation colors, but terrain becomes lower toward Texas City and the bay-facing edge. Narrow low corridors also follow creeks such as Magnolia Creek, Cedar Creek, and Highland Creek. Comparing the elevation and water maps makes these relationships easier to recognize because many green bands align with drainage or coastal water.
The negative end of the mapped range should be interpreted carefully. A county-scale DEM can include water surfaces and coastal cells, so a -10-meter minimum does not mean every nearby road or neighborhood is below sea level. This map is not a parcel survey, engineering elevation product, or flood-elevation reference. Its useful message is the broad contrast between somewhat higher western mainland terrain and the extremely low islands, shorelines, and bay margins.
Reading the County as Mainland, Bay, and Island Rather Than One Urban Block
League City and Galveston make useful opposite reference points. League City is the largest ranked city and belongs to the dense northern mainland road system, while Galveston sits on the island and anchors the county’s southern coastal geography. Dickinson, Texas City, and La Marque fill the middle ground, but the transition is interrupted by bay shorelines, channels, and island crossings. The county therefore cannot be understood as a single continuous urban surface even though several cities are relatively close together.
The west and east add further contrast. Friendswood, Santa Fe, and Hitchcock sit on the mainland, where the elevation surface is generally higher than the coastal islands. Crystal Beach occupies a long low coastal strip on the opposite side of the bay system. The water map places Galveston Bay and East Bay between these areas, and the elevation map reinforces the same separation with widespread low green terrain. Looking across all four views makes the relationship among settlement, water, and elevation much clearer than a city list alone.
Choosing a Map for Cities, Bays, Roads, or Coastal Elevation
Use the general county map when you need League City, Texas City, Galveston, Santa Fe, Kemah, the Interstate 45 corridor, Highway 6, and the county outline together. The city map is the fastest way to compare the six ranked communities without the extra water and road detail. Choose the water map for Galveston Bay, Trinity Bay, East Bay, Chocolate Bay, creeks, and canals. The elevation view is most useful when the question is how the higher western mainland differs from the very low island and bay-margin terrain.
The WebP images are convenient for viewing on the page, while the ZIP below contains the matching high-resolution A3 JPG originals for printing and larger displays. The archive includes the county, city, water, and elevation maps shown here, so you can keep the complete set or use only the file needed for classroom work, a trip-planning reference, a presentation, or a personal map collection.
Frequently Asked Questions
Which city is ranked largest on the supplied Galveston County city map?
League City is ranked first with a displayed CITY INDEX value of 116,215. Texas City is second and Galveston third. Galveston remains a major geographic reference because it sits on the island, even though it is not the top-ranked city by the value printed on this map.
How are Galveston Bay and East Bay positioned on the water map?
Galveston Bay fills the broad central and northeastern water space between the mainland and coastal land. East Bay lies farther east inside the long coastal strip near the Crystal Beach side, making the two bays useful references for separating the mainland, island, and eastern coast.
Where are the higher and lower parts of Galveston County?
The elevation map shows the higher broad terrain mainly on the western and northwestern mainland. Galveston Island, the eastern coastal strip, and much of the bay margin are very low. The mapped range is about -10 to 61 meters with a mean near 3 meters, but it is not a parcel-level elevation survey.
Sources and Reference Data
USGS The National Map Viewer — Official map service for terrain, roads, hydrography, and other geographic layers used for map reference.
USGS National Hydrography — Official reference for bays, streams, canals, and other hydrographic features.
USGS 3D Elevation Program — U.S. Geological Survey program for elevation and terrain data.
U.S. Census Bureau TIGER/Line Shapefiles — Official source for county boundaries, roads, and related base geography.
Map File Information
Download the Galveston County county map, city map, water map, and elevation map as high-resolution A3 JPG files. The ZIP contains the original map files shown on this page.
- File Type: JPG
Related Maps
- Wharton County Texas map
- Waller County Texas map
- Austin County Texas map
- Orange County Texas map
- Polk County Texas map
Green Map creates custom-edited map images using open geographic data sources such as geoBoundaries, Natural Earth, OpenStreetMap, and government open data.
These maps are edited visual materials, not raw data files, and are provided for education, documents, presentations, and graphic reference.