Izard County’s 2025 land-cover picture is dominated by forest, but the county is far from uniform. Forest accounts for 62.33% of the mapped area, while agriculture makes up 28.46%. The largest wooded expanses sit across the south and southwest, and more open agricultural patches become frequent toward the north and east. Developed land is limited overall, yet it forms recognizable clusters around Horseshoe Bend, Melbourne, and smaller communities.
The page includes four Izard County map views: current land cover, forest and farmland, impervious surface, and mapped class differences from 1985 to 2025. Each view keeps a different part of the landscape easy to see. The four original JPG files are packaged together for download, so the same map set can be used in print, classroom work, presentations, or local reference without relying on screen captures.
Table of Contents
A forest-dominant county with open land woven through it
Dark green covers most of the southern half of Izard County and continues through broad parts of the west and center. Yellow agricultural areas become more numerous farther north and east, where they break the forest into smaller pieces. The result is not a clean forest-versus-farm split. Wooded tracts and working land repeatedly meet along irregular edges, and that mixture is more informative than the countywide totals alone.
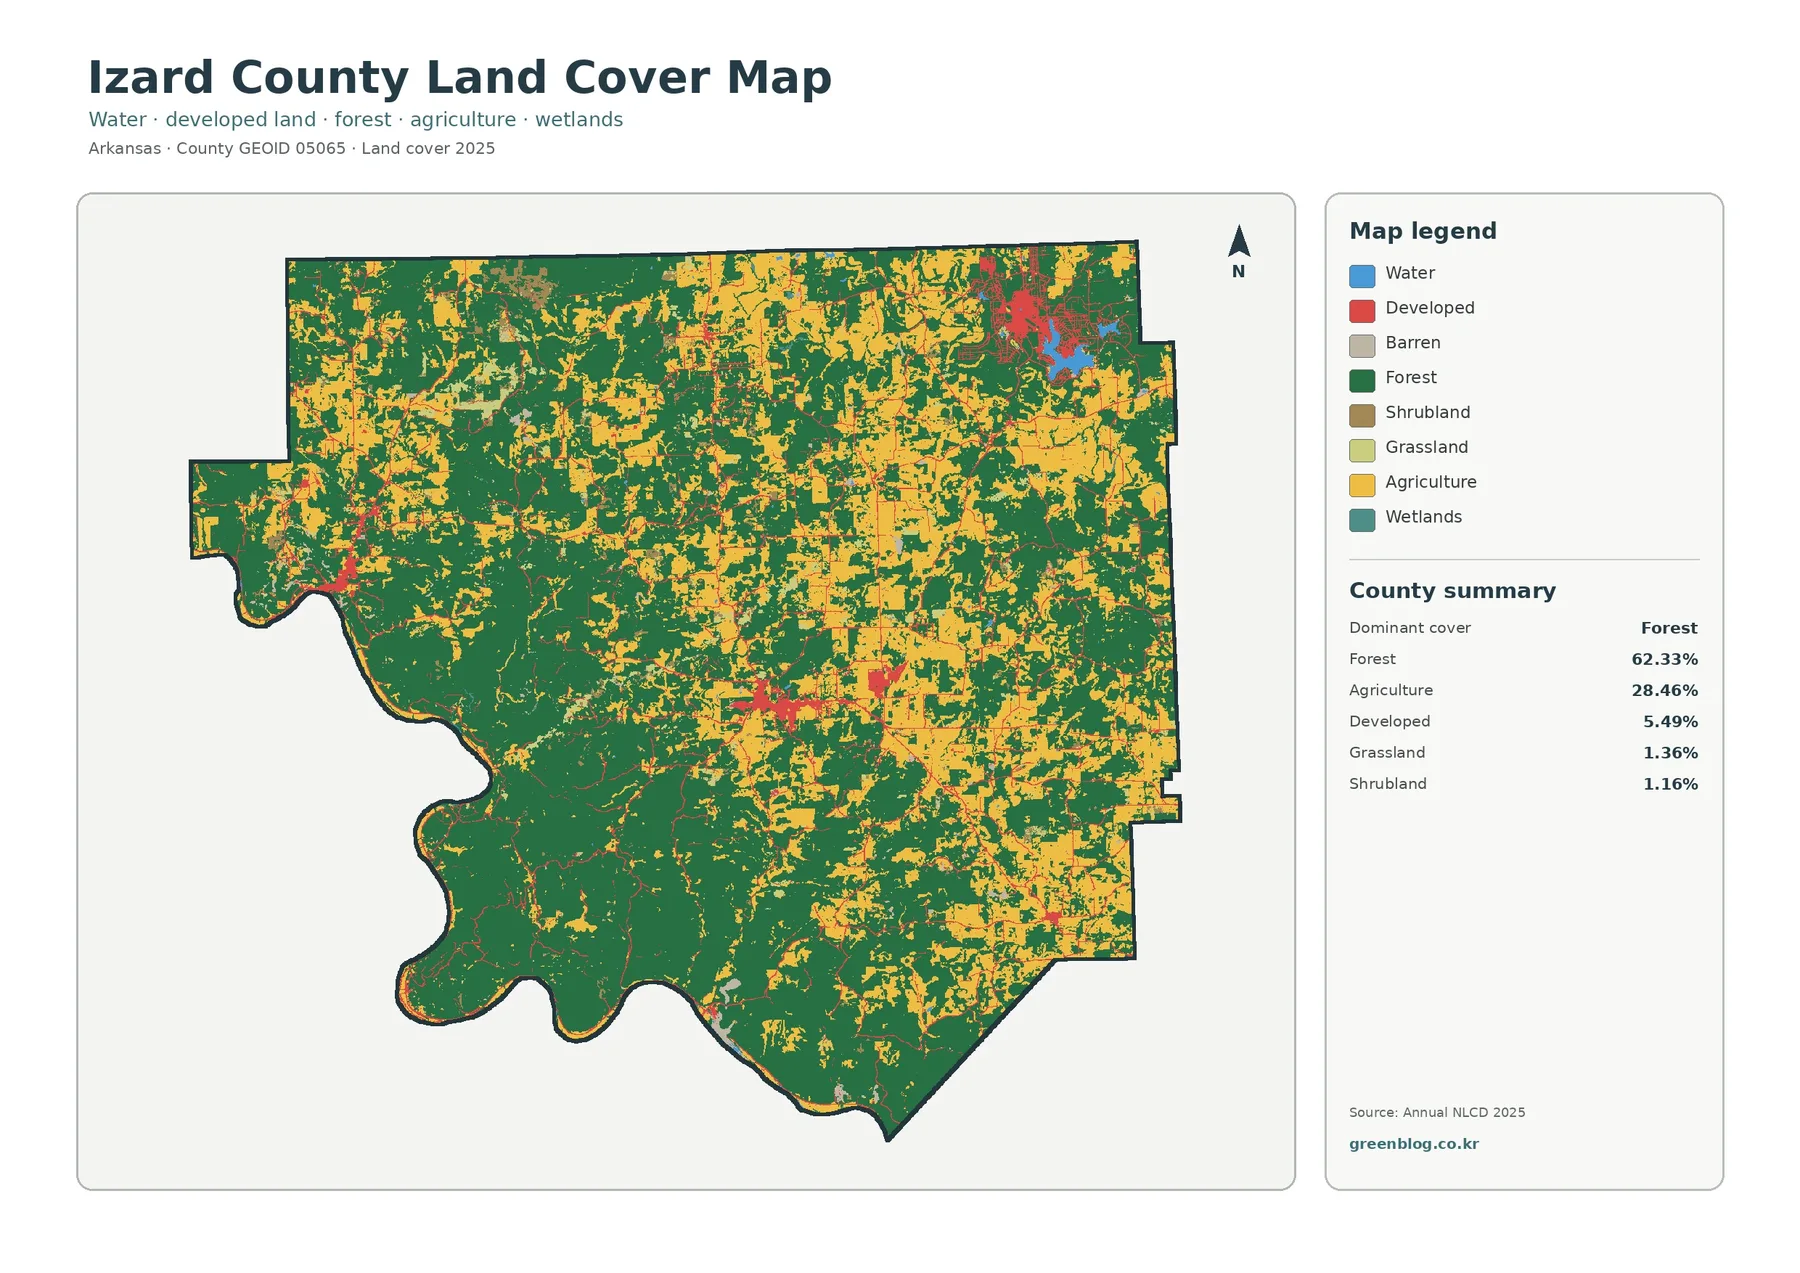
The summary beside the map puts forest at 62.33%, agriculture at 28.46%, and developed land at 5.49%. Grassland contributes 1.36% and shrubland 1.16%. Water is 0.60%, while wetlands are only 0.09% of the county summary. Those smaller percentages are easy to overlook in a table, but the colored cells still matter when a reader is tracing river edges, small openings, or transitions between wooded and settled areas.
Development does not form one continuous urban area. A prominent red cluster appears in the northeast around Horseshoe Bend, another concentration sits near centrally located Melbourne, and a smaller western cluster corresponds to the Calico Rock area. Thin red lines and scattered cells connect some rural locations, but they remain minor compared with the surrounding forest and agricultural cover. That contrast gives the county map its strongest visual hierarchy: broad natural and working-land cover first, compact built areas second.
Land-cover classes describe the surface, not zoning or property rights. A green cell represents forest at the dataset scale; it does not identify who owns the land or what legal uses are allowed there. Agricultural and developed colors work the same way. Parcel boundaries, permits, ownership, and assessed land use require separate local records.
Where forest gives way to fields, pasture, and other open ground
The forest-and-farmland version strips away some of the visual competition from the full classification and makes the rural pattern easier to compare. Forest remains the dominant surface, especially in the south and southwest. Across the northern and eastern portions, light agricultural colors occupy more of the map and divide the woods into smaller blocks. The center contains both patterns, with open land extending around rural roads and community areas while wooded tracts remain close by.
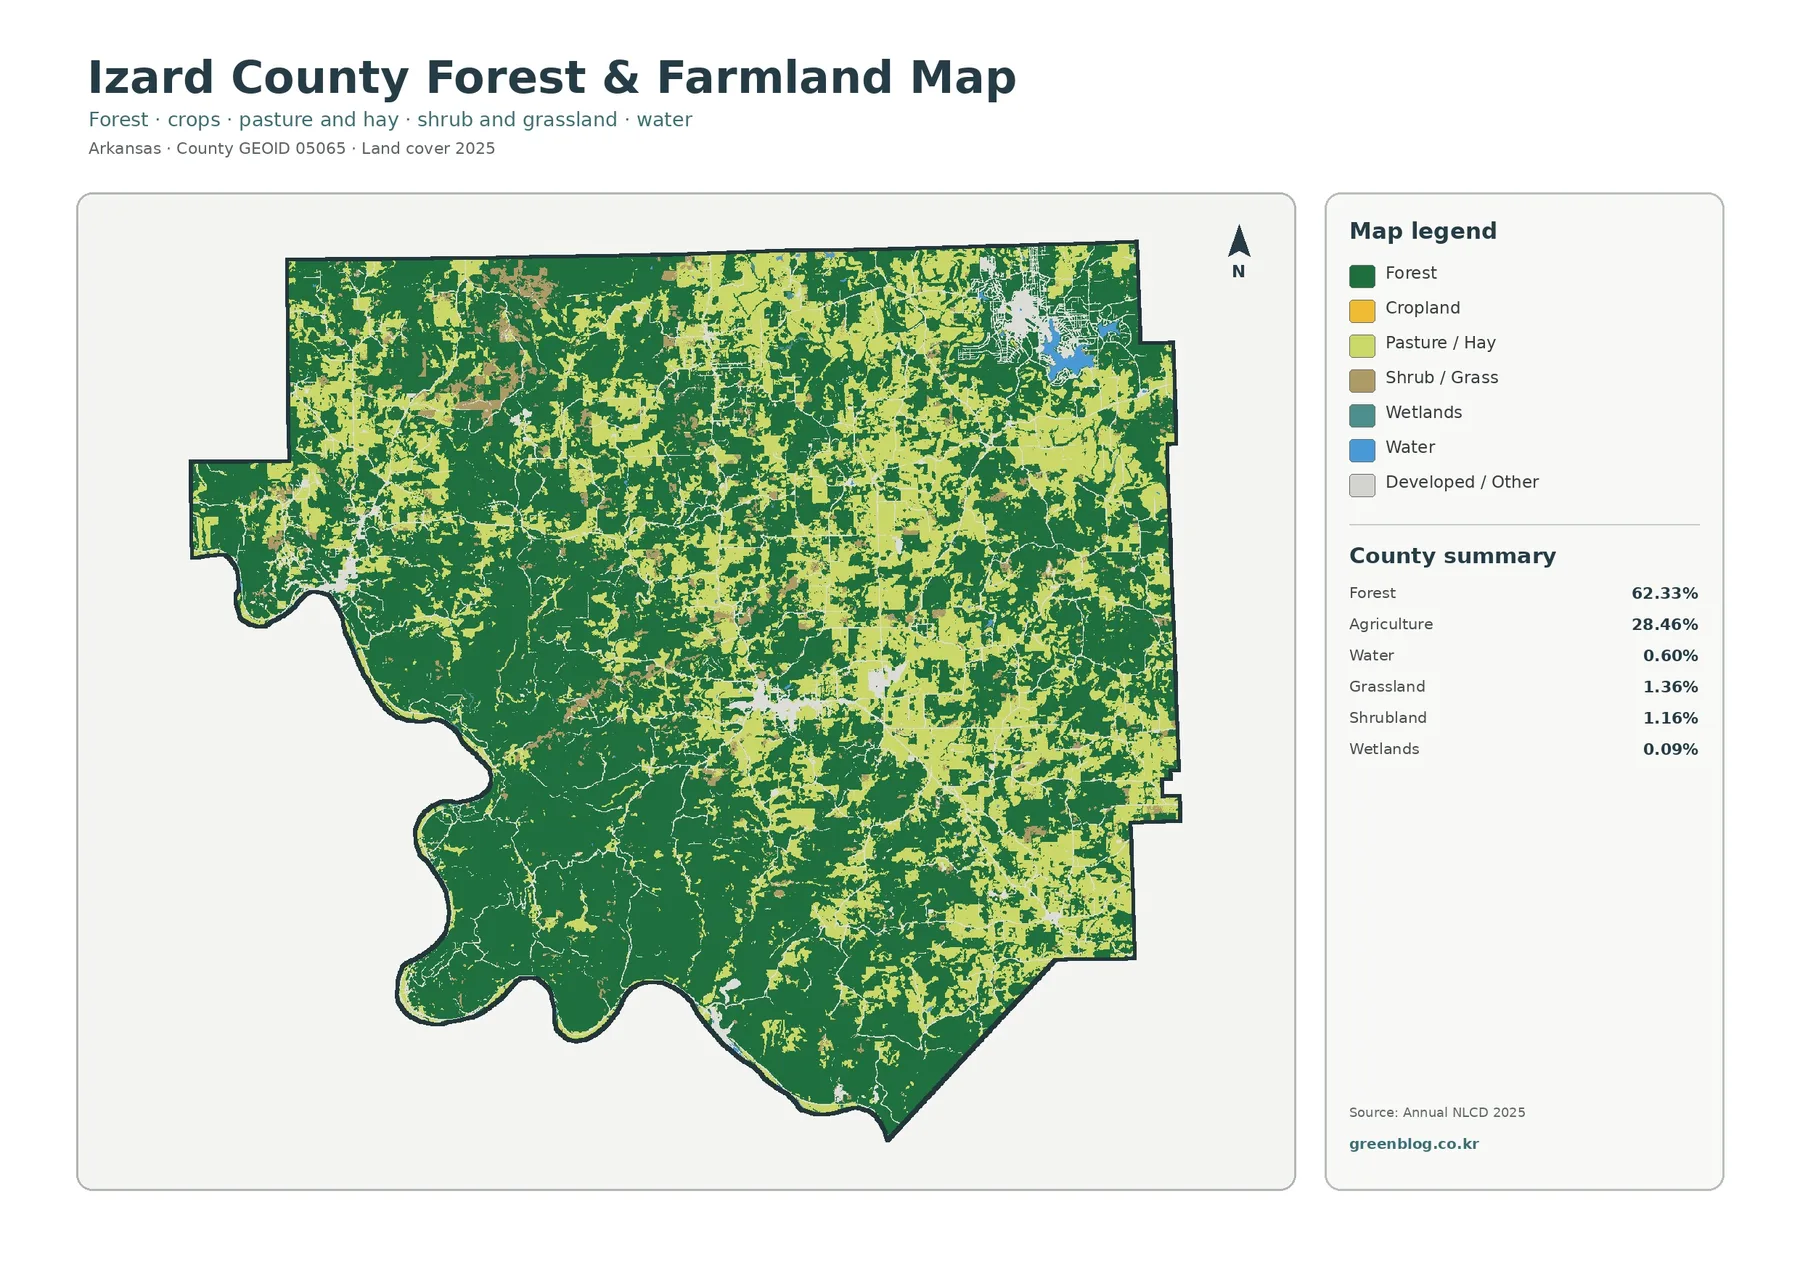
Agriculture totals 28.46% in the supplied 2025 summary, but its shape matters as much as the percentage. Much of it appears as many medium and small patches rather than one uninterrupted agricultural plain. That arrangement fits the county’s broken terrain and produces frequent forest-field boundaries. For habitat or watershed discussions, these edges are often the places where a countywide statistic becomes too coarse and the actual map becomes more useful.
Grassland and shrubland together occupy a much smaller share than forest or agriculture, yet they fill gaps that would disappear in a simple two-class forest/farm graphic. Grassland is listed at 1.36% and shrubland at 1.16%. Water and wetlands are smaller again. Keeping those classes visible prevents readers from treating every nonforest patch as farmland, which would overstate the agricultural footprint.
The University of Arkansas System Cooperative Extension’s Izard County program page covers local subjects such as forage, grazing, hay, cattle, and soil testing. That local context explains why pasture and other working-land categories deserve attention, but the land-cover layer itself does not count farms, livestock, or acres under a particular management practice. It records the mapped surface class, not the business or legal status of the land.
Pavement and rooftops stay concentrated around a few developed clusters
Impervious surface means ground covered by materials that shed water instead of absorbing it readily, such as pavement, parking areas, and rooftops. On the Izard County impervious-surface image, most of the county is almost white. Stronger orange and red values gather around the northeast, the Melbourne area near the center, and smaller western development. Narrow road traces are visible between otherwise lightly sealed rural areas.
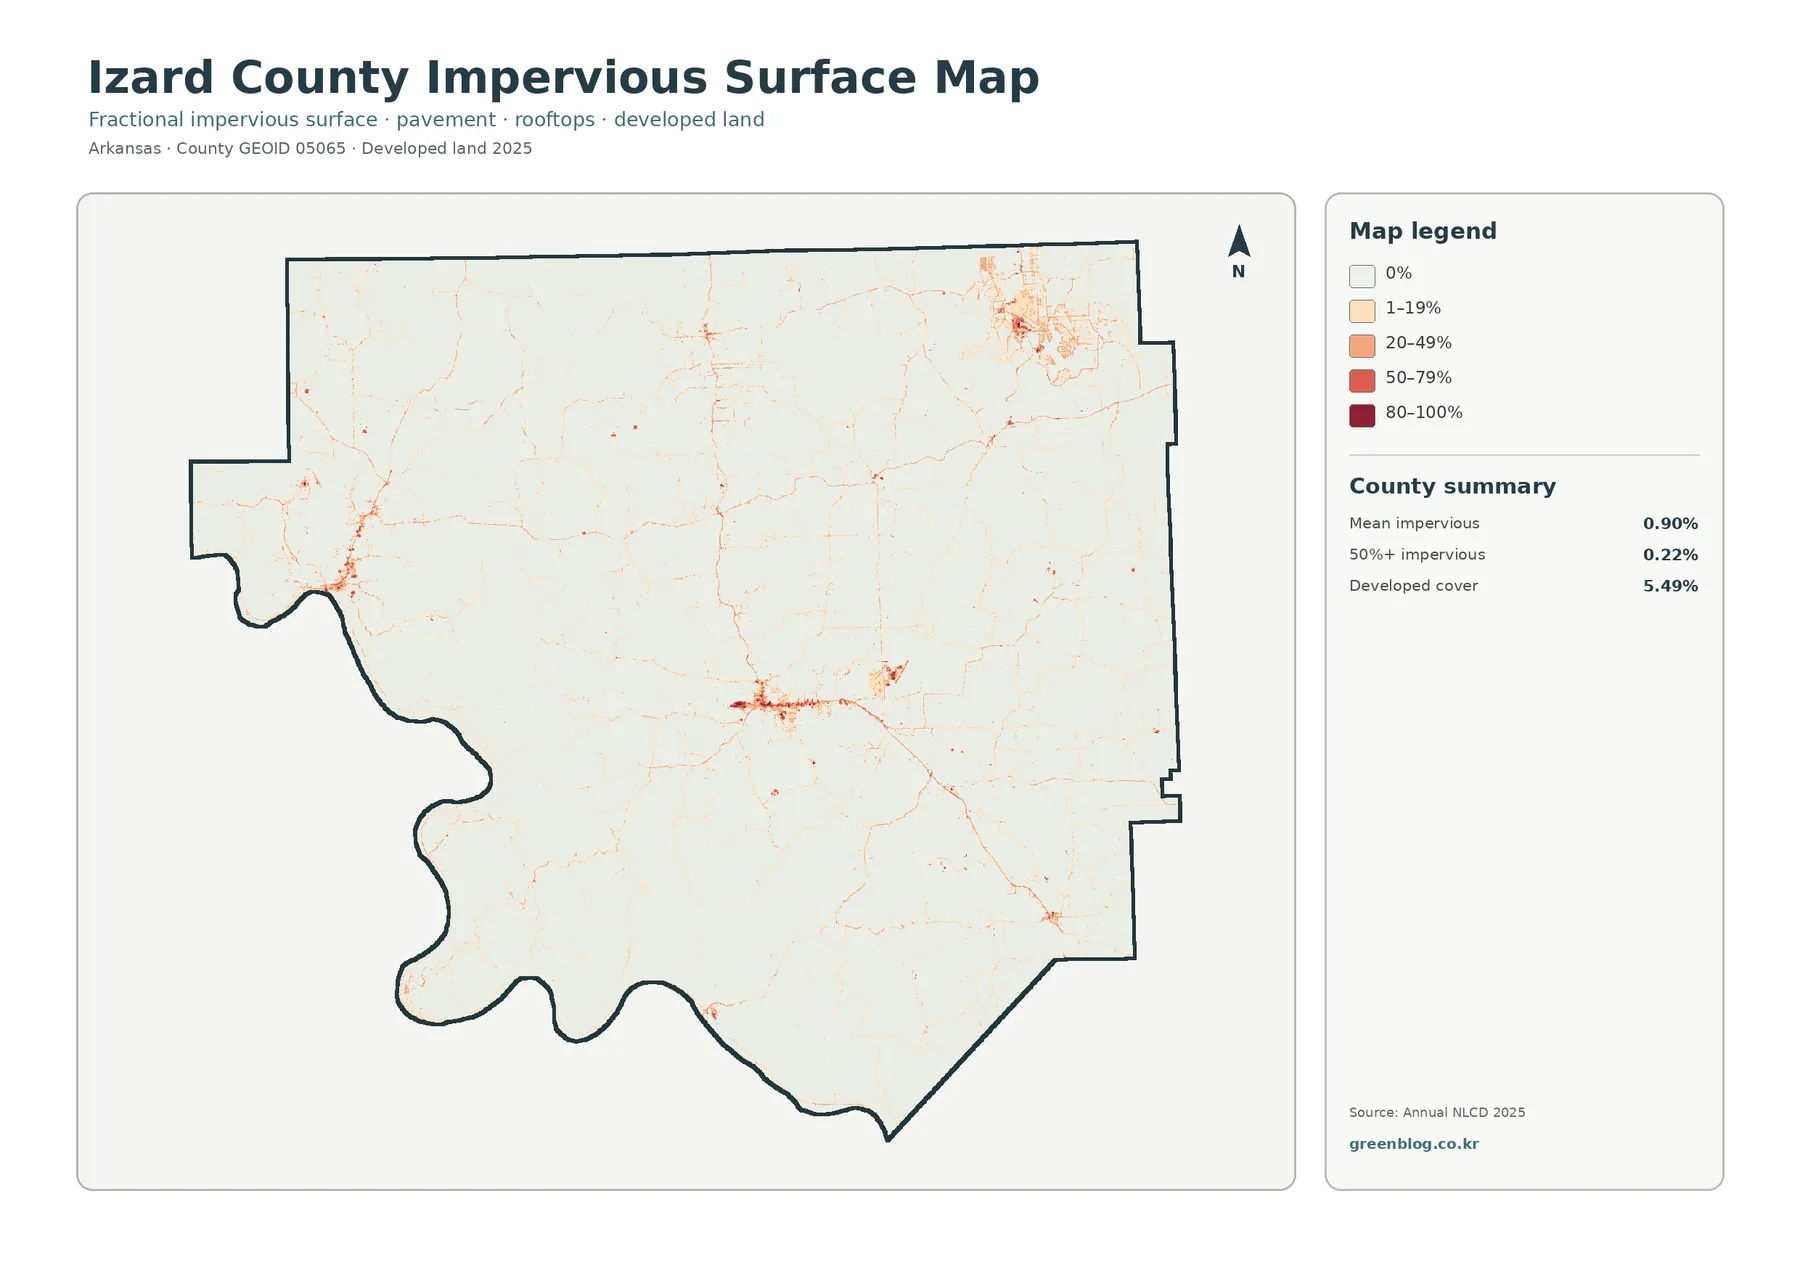
The countywide mean impervious value is 0.90%, and only 0.22% of the mapped area falls in the 50% or higher impervious range. Those numbers are much lower than the 5.49% developed-land share on the general land-cover image. There is no contradiction. A developed land-cover class can include lawns, trees, bare soil, and other surfaces around buildings, while the impervious layer focuses on the portion sealed by pavement, roofs, or similar materials.
Horseshoe Bend illustrates the difference clearly. The general classification marks a sizable developed cluster in the northeast. On the impervious image, many cells inside that broader area stay pale, while stronger values follow parts of the street and building pattern. Melbourne produces a smaller but similarly distinct concentration. Comparing the two files separates “land classified as developed” from “land covered heavily by hard surfaces,” which are related but not interchangeable measurements.
Impervious percentage can add background to a runoff or development discussion, but it is not a flood-hazard map. Water movement also depends on terrain, soil, drainage, stream conditions, and rainfall. The countywide raster is suitable for seeing where built surfaces cluster; engineering, drainage design, or parcel-level decisions need site-specific information.
The 1985–2025 comparison records scattered change, not one advancing front
Most of the change image remains in the pale “no class difference” category. The colored cells are spread across Izard County, with orange forest-loss patches especially noticeable in the north, center, and east. Purple cells for other class differences are mixed through many rural areas, while red change-to-developed cells are more concentrated near existing communities and along narrow routes. The distribution is patchy rather than a single band moving across the county.
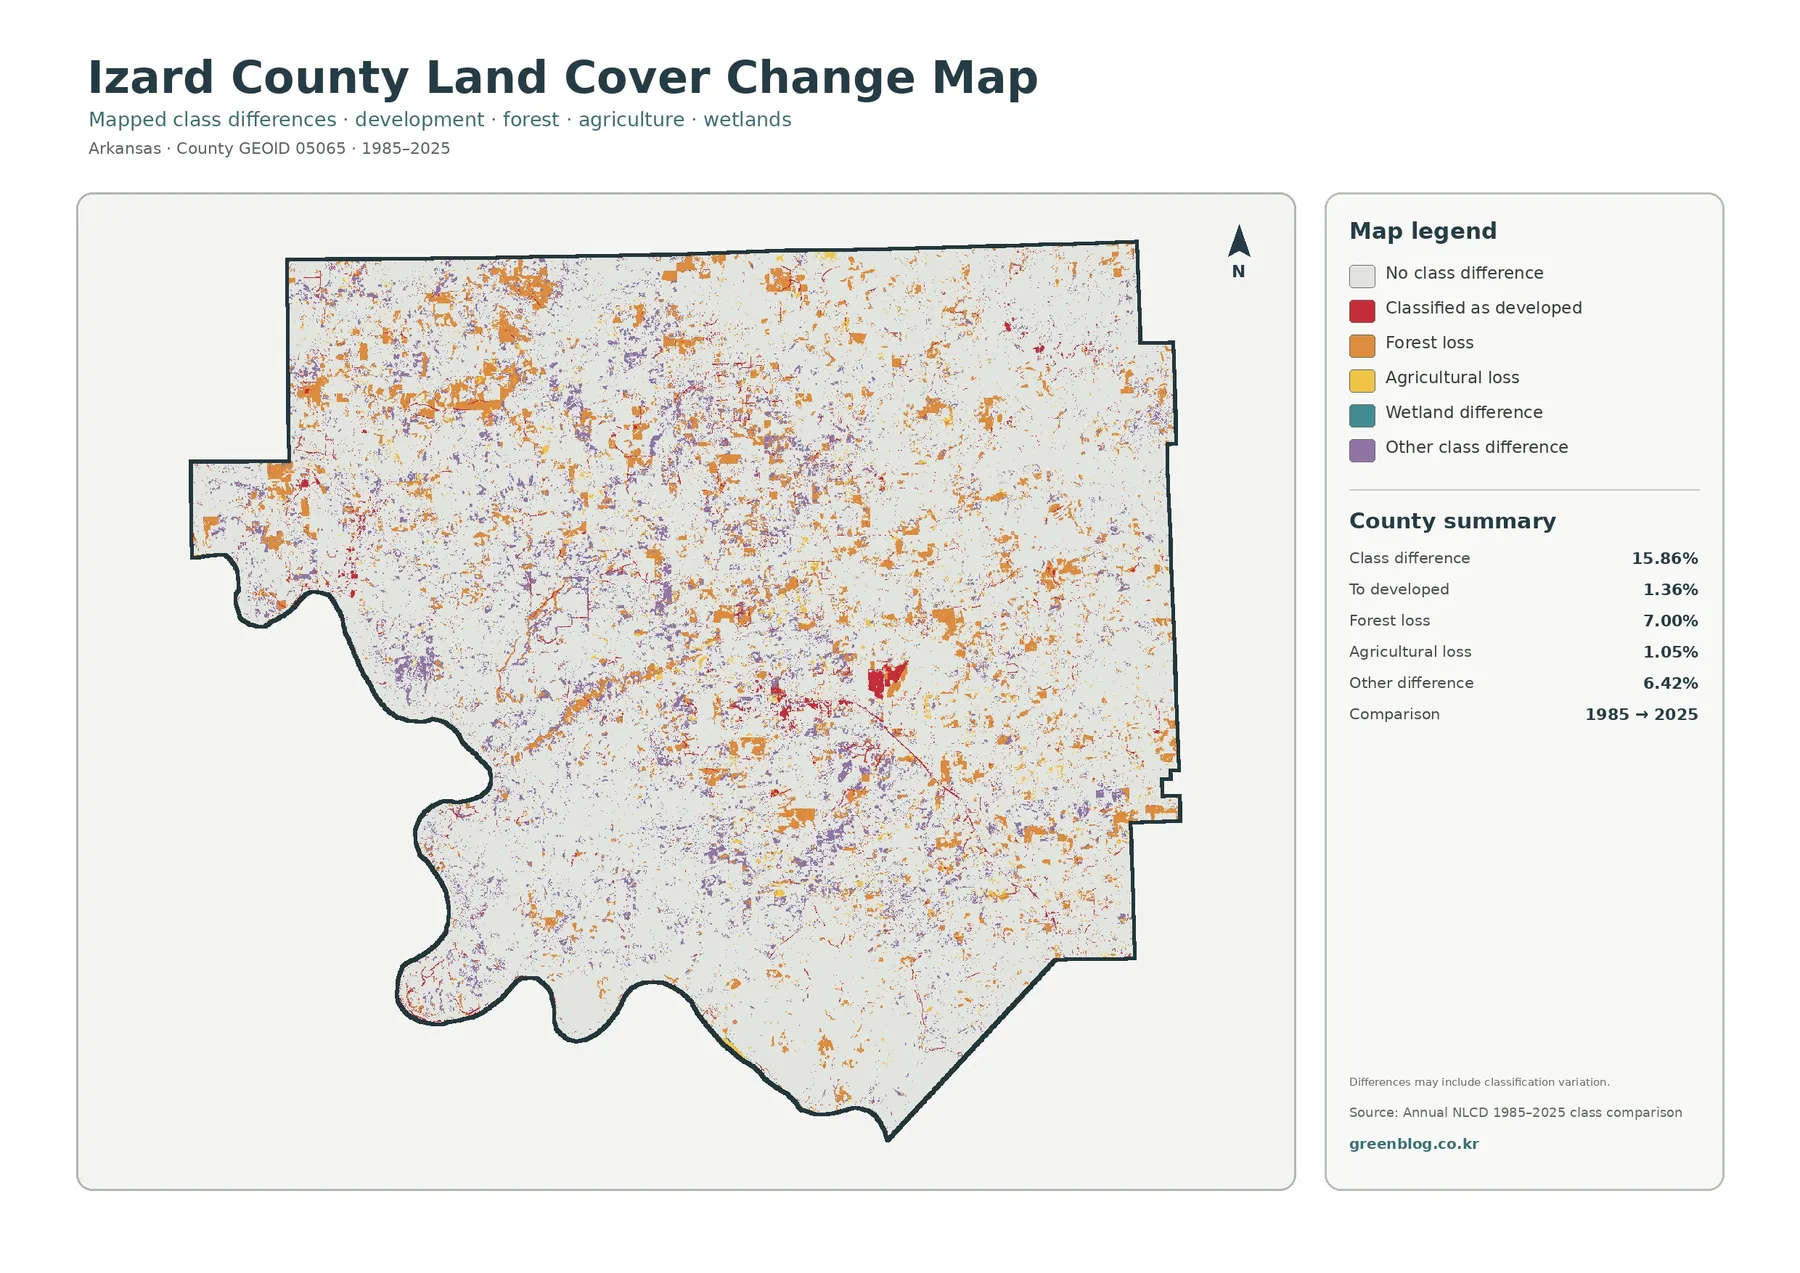
The supplied summary reports a class difference over 15.86% of the county. Forest loss accounts for 7.00%, other class difference for 6.42%, change to developed for 1.36%, and agricultural loss for 1.05%. Forest loss is the largest named change category, but the label should be read literally. It marks cells classified as forest at the earlier endpoint and as another class at the later endpoint. The graphic does not identify logging or any other single cause.
The note printed on the image states that differences may include classification variation. A 30-meter raster cell can contain more than one real-world surface, and the selected class can change when vegetation, imagery, or the mixture inside a cell differs between dates. For that reason, a small orange or purple patch should be treated as a location to investigate rather than proof of a specific event.
One practical way to check a change patch is to compare the same location across the current land-cover, forest-and-farmland, and impervious files. Red change cells in the northeast can be viewed beside the current Horseshoe Bend development pattern. A rural orange cell can be compared with the 2025 forest-and-farmland image to see the broad class surrounding it now. This cross-check keeps the time comparison tied to what the other supplied maps actually display.
Match the file to the detail you need
For a countywide description, the full land-cover image carries the most information in one frame. It lets a reader compare forest, agriculture, development, water, wetlands, grassland, and shrubland without switching files. The forest-and-farmland version is better when the main concern is the boundary between wooded land and working or open land, because those rural classes receive more visual emphasis.
A project about settlement intensity should pair the general classification with the impervious image. The first identifies the broader developed category; the second reveals where hard surfaces are actually concentrated within it. For historical comparison, the change file belongs beside a current-condition image rather than by itself. That pairing reduces the chance of confusing a 1985–2025 class difference with the county’s present surface type.
These distinctions matter in classroom exercises as well. Students can begin with the county totals, locate the largest classes, and then compare where those classes are concentrated. A presentation can use the full classification for orientation, the forest-and-farmland image for rural detail, and the change file for a separate time-based question. Keeping the questions separate makes the maps easier to explain without adding technical GIS language.
Download the four original JPG map files
The ZIP contains the current land-cover map, forest-and-farmland map, impervious/developed-land map, and 1985–2025 land-cover-change map as the supplied original JPG files. They can be placed directly into a report or lesson, printed as reference sheets, or kept together for side-by-side comparison. Because the legends and county summaries carry important information, retaining the full map frame is preferable to cropping only the county shape.
When a map is reduced for a page or slide, check the legend before final export. The impervious graphic depends on percentage ranges from 0% through the darkest 80–100% class, and the change graphic needs its 1985→2025 comparison label. Removing those elements can make a perfectly clear image ambiguous to someone who did not build the map.
Reading the colors without treating them as parcel boundaries
Annual NLCD is raster data, which means the landscape is divided into grid cells and each cell receives a class or value. The supplied land-cover products use generalized cells rather than surveyed property lines. Narrow roads, small buildings, thin streams, and complicated forest-field edges may therefore look wider, narrower, or simpler than they do on the ground.
A cell that contains several surfaces can become a mixed pixel. For example, trees, grass, a roof, and pavement may all occur within one cell, yet the classification must represent that location with a limited set of map classes. This is one reason a county-level land-cover image should not be substituted for a parcel survey or a site plan.
The current classification represents 2025 in the supplied dataset, and the change graphic compares 1985 with 2025. Construction, vegetation change, road work, farming activity, or timber activity after the mapped period may not appear. The change file also does not provide a year-by-year history between the two endpoints. Recent imagery and local records are needed when the current condition of a specific property matters.
Colors that occur next to one another establish location, not cause. Development near a road does not prove that the road created the development, and forest-loss cells beside agricultural cover do not prove that the forest was converted to farming. The maps are strongest when they are used to locate a pattern first and then guide a more detailed question with appropriate local data.
Frequently Asked Questions
How much of Izard County is forest in the 2025 map?
Forest is the dominant class at 62.33%. It forms large connected areas in the south and west and remains common throughout much of the county, while agricultural and other open classes become more frequent toward the north and east.
Why is developed cover 5.49% when mean impervious surface is only 0.90%?
Developed land cover is broader than impervious surface. A developed area can contain lawns, trees, soil, and other surfaces that absorb water. Impervious percentage focuses on pavement, rooftops, and similarly sealed surfaces, so its countywide value can be much lower.
Does 7.00% forest loss mean that all of that area was logged?
No. The change map marks cells whose classification differs between 1985 and 2025. A forest cell may have shifted to agriculture, grass, development, or another category, and classification variation may also contribute. The map does not identify a specific cause without additional evidence.
Map File Information
Izard County Land Cover Maps
- Included Files: Current land cover, forest and farmland, impervious/developed land, and 1985–2025 land cover change
- File Type: Four original JPG map files in one ZIP
- Intended Use: Printing, education, presentations, and map-based reference
Related Maps
- A Craighead County Arkansas Land Cover Map
- Arkansas County Arkansas Land Cover Map
- Ashley County Arkansas Land Cover Map
Sources and reference data
- MRLC Annual NLCD Data – source access for Annual NLCD land-cover and related raster products.
- USGS Annual NLCD Land Cover Classification – class definitions and background for interpreting Annual NLCD land-cover products.
- U.S. Census Bureau TIGER/Line Shapefiles – official geographic boundary data used for county mapping.
- Izard County AR Government – county information for Melbourne and other local municipalities.
- University of Arkansas System Cooperative Extension – Izard County – local agricultural education topics including forage, grazing, hay, cattle, and soil.
Green Map creates custom-edited map images using open geographic data sources such as geoBoundaries, Natural Earth, OpenStreetMap, and government open data.
These maps are edited visual materials, not raw data files, and are provided for education, documents, presentations, and graphic reference.