Sebastian County occupies Arkansas’s western edge, where Fort Smith sits beside the Arkansas River and the Oklahoma line while Greenwood anchors a very different inland setting farther south. The county changes quickly from a broad river-side urban area to long ridges and narrow valleys. This Sebastian County Map page shows those differences through settlement, roads, waterways, and elevation. The original high-resolution A3 JPG map files can also be downloaded together in one ZIP from the download box below.
The page provides a county reference map, a ranked city-distribution map, a terrain-and-water map, and an elevation map. The reference view is the best place to start if you need roads and local place names, while the water and elevation views explain why Fort Smith’s northern setting differs so much from the land around Greenwood, Huntington, Mansfield, and Hartford. Each map is useful on its own, but comparing two of them often makes the county easier to understand.
Table of Contents
Fort Smith and Greenwood anchor opposite sides of the county’s daily geography
Fort Smith and Greenwood are the first two places to locate when reading Sebastian County. Fort Smith lies at the far northwest edge, pressed between the Oklahoma border and a large bend of the Arkansas River. Greenwood sits well to the south in the county interior. Their separation is not only a map-reading convenience: Sebastian County has two county seats, one in each of these cities.
The Encyclopedia of Arkansas explains that the county was divided into two judicial districts in 1861, allowing Fort Smith and Greenwood to continue as separate courthouse centers. Their map positions make the arrangement easier to picture. Fort Smith serves the dense river-and-border urban area, while Greenwood is a more central reference point for the roads and communities spread across the southern half.
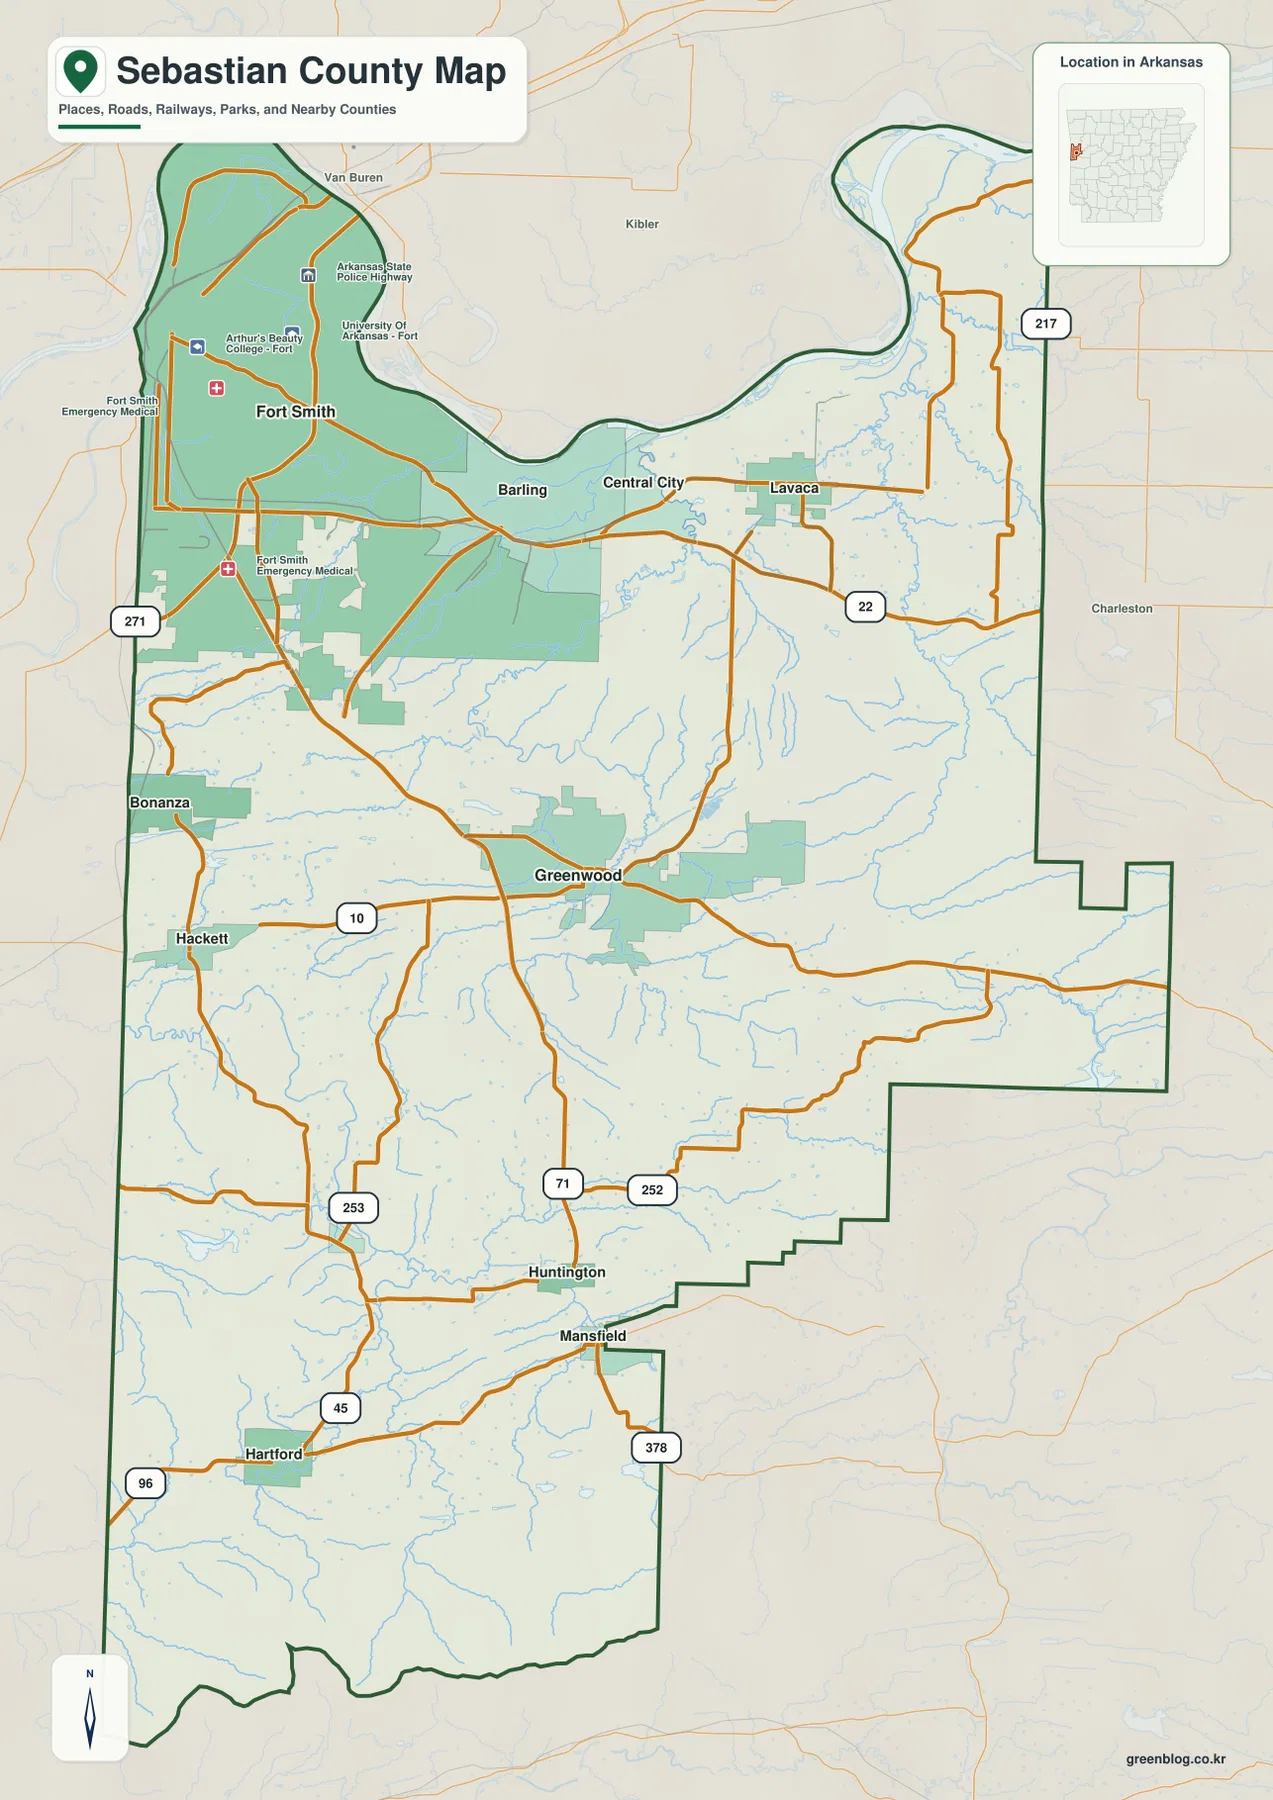
The reference map also shows how settlement density changes away from Fort Smith. Barling and Central City extend east from the urban area toward Lavaca, while Bonanza and Hackett sit close to the Oklahoma side. South of Greenwood, places such as Huntington, Mansfield, and Hartford are separated by much larger rural gaps. Roads remain important, but the network becomes less dense as the terrain grows more strongly ridged.
The county boundary itself is irregular. The Arkansas River forms large bends along much of the north, the western edge meets Oklahoma, and the eastern and southeastern sides step in and out around neighboring counties. Because of that shape, the full reference map is useful for checking whether a town, road, or stream is actually inside Sebastian County rather than just nearby.
The major-city pattern is concentrated toward Fort Smith
The city-distribution map removes much of the road and facility detail so the largest places stand out. Fort Smith is ranked first and is visually dominant in the northwest. Greenwood is second and sits farther south, while Barling and Lavaca remain in the northern half of the county. Hackett and Bonanza appear close to the western state line. The arrangement makes the northwestern concentration obvious without requiring the reader to scan every local label.
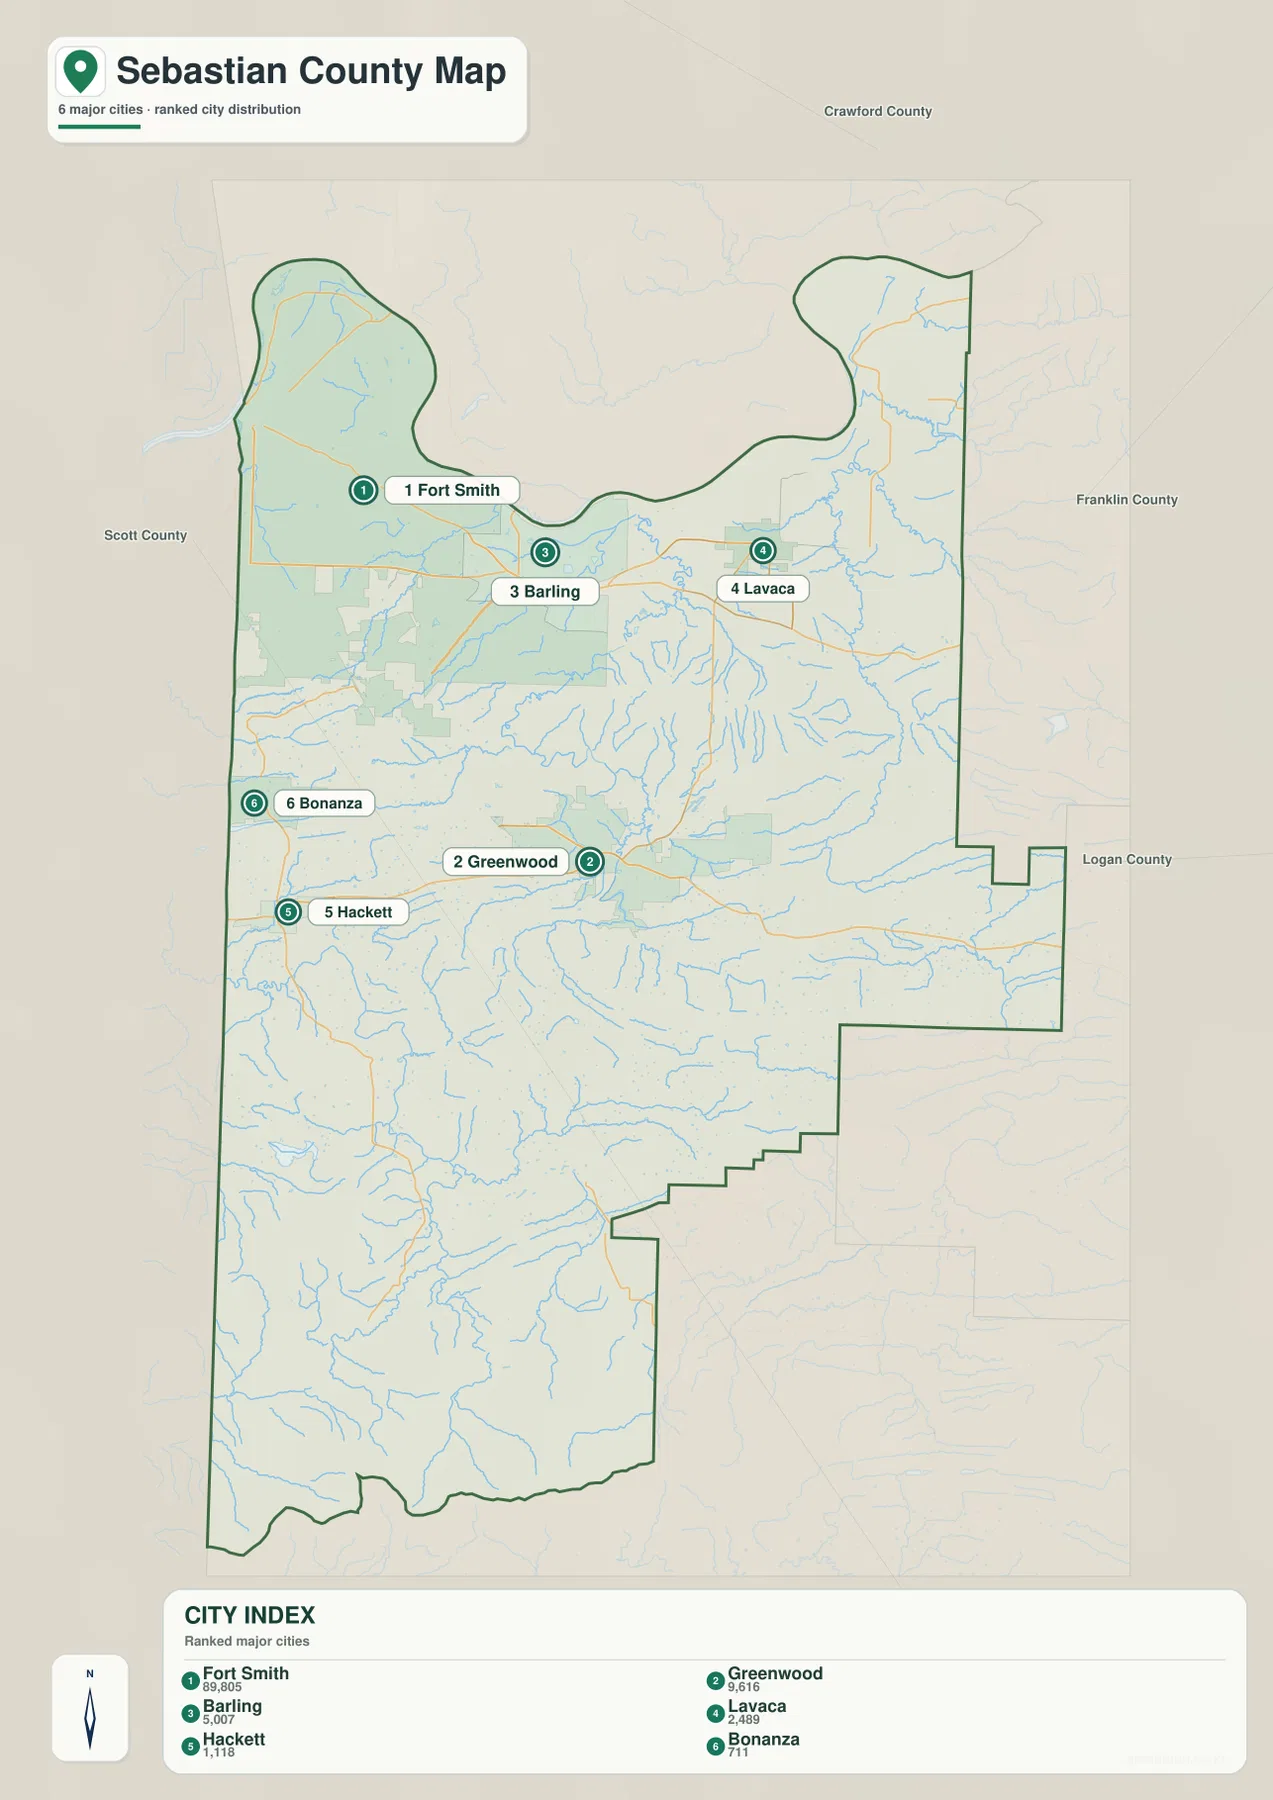
This simplified city view does not include every named community. Huntington, Mansfield, and Hartford, for example, are visible on the reference map but are not among the six ranked city labels. That is why the two maps answer different practical questions. Use the city map for a quick comparison of the largest places, then switch to the reference map when you need the southern road network or smaller communities.
The population figures printed on the supplied city graphic are best treated as reference values for that map. Current population estimates and demographic details should be checked against the latest U.S. Census Bureau data. The main value of this image is geographic: it shows where the largest settlements are located relative to the river, the state line, and the rest of the county.
The Arkansas River defines the north, while smaller streams follow interior valleys
The terrain-and-water map gives the northern edge an immediate identity. The Arkansas River sweeps across the top of Sebastian County, and the Poteau River approaches it near the Fort Smith side. Ozark Lake is labeled farther east along the river corridor. These large water features sit beside the lowest and most urbanized part of the county, making them useful landmarks for understanding Fort Smith, Barling, and the northern road network.
Farther inland, the drainage becomes smaller and more closely tied to the ridge-and-valley terrain. Vache Grasse Creek and Big Creek run through the northern and central interior, and Lake Jack Nolen is labeled near the middle of the county. Sebastian Lake lies toward the west. South of Greenwood, James Fork, Prairie Creek, West Creek, and Cherokee Creek wind through narrower valleys, while Sugarloaf Lake and Lake Spur appear among the southern water bodies.
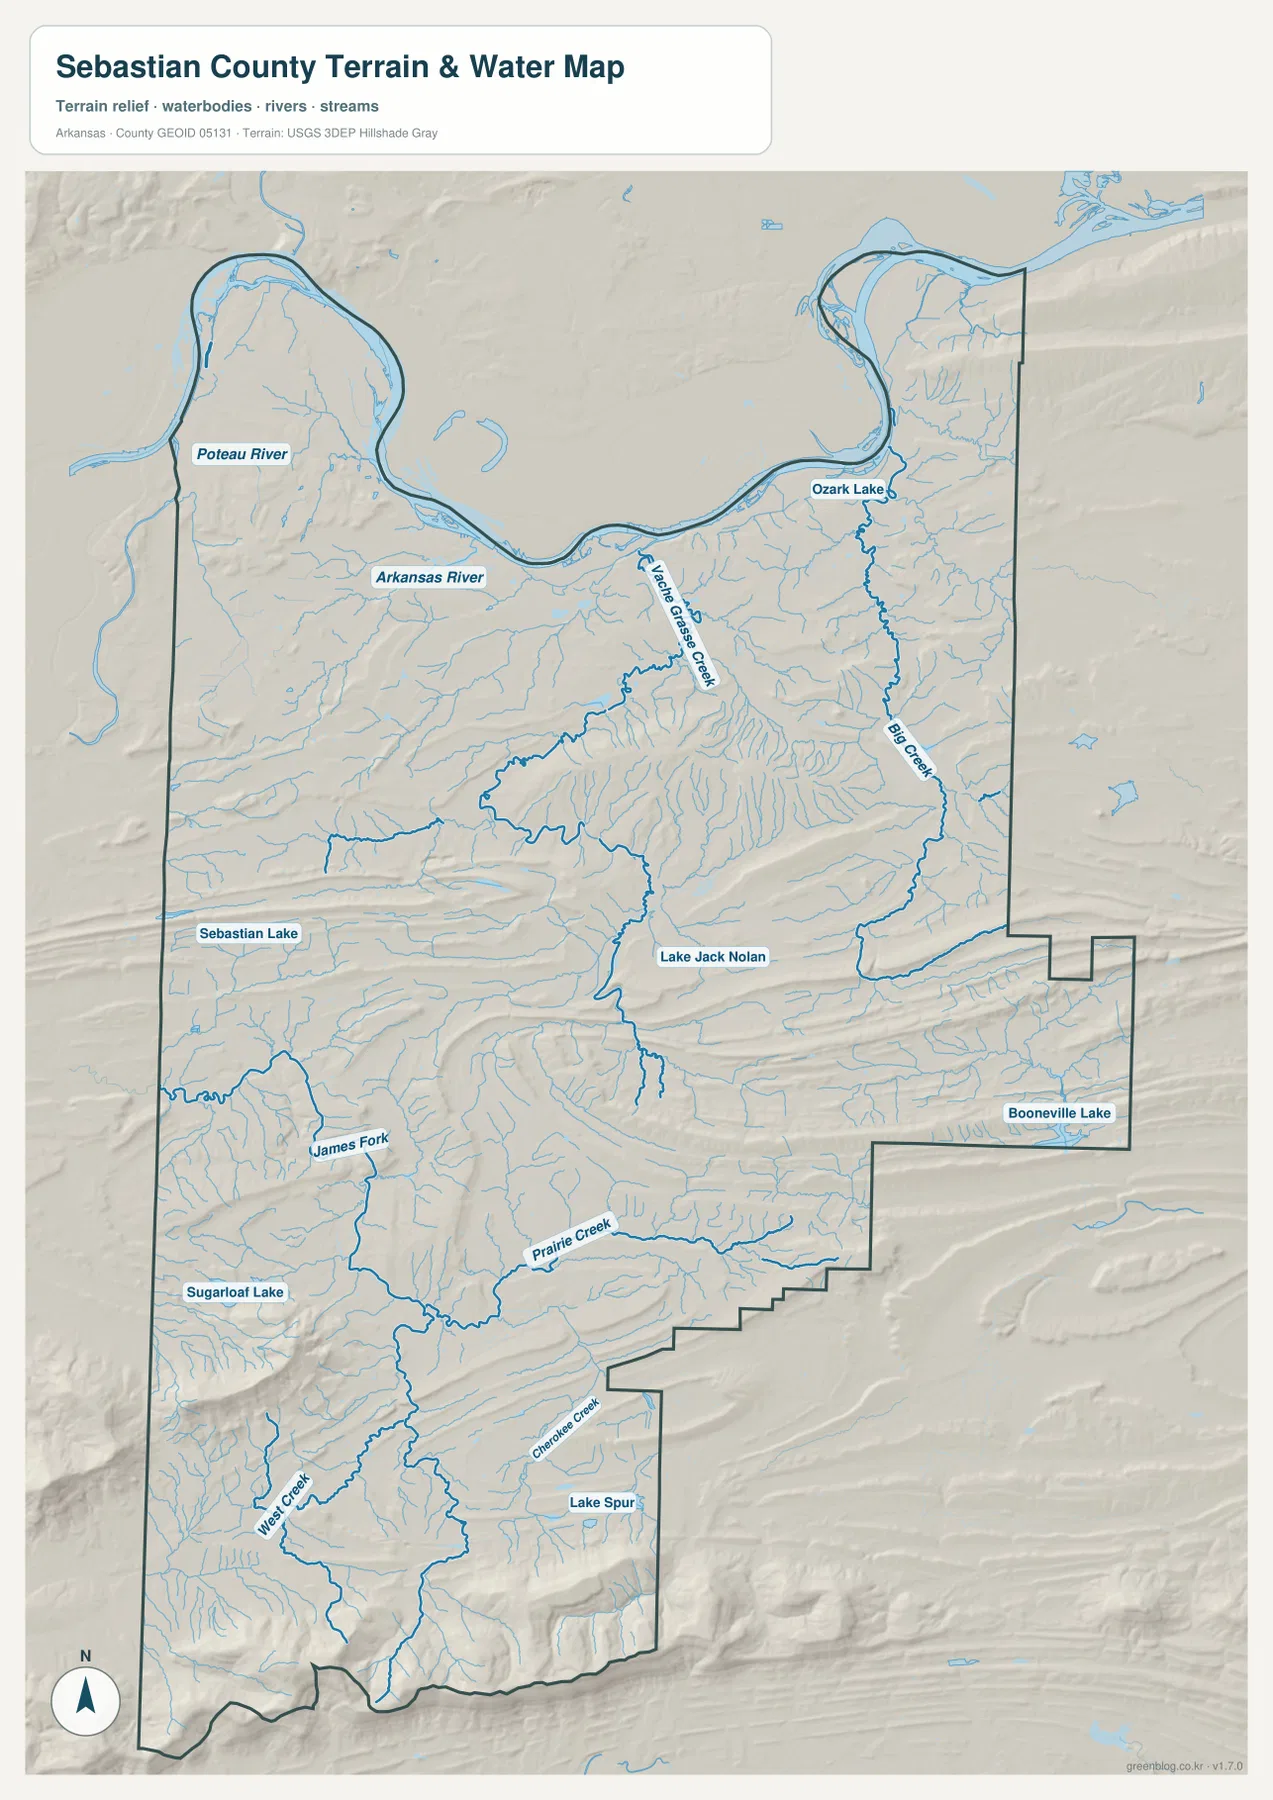
The relief beneath the water lines helps explain why the streams change shape from north to south. Near the Arkansas River, drainage crosses broader low ground. In the southern half, many channels occupy narrow spaces between elongated ridges. The road map shows a similar tendency in several places, because routes also favor lower passes and valleys instead of crossing every ridge directly.
This is a county-scale water reference map, not a flood-hazard, legal-boundary, parcel, navigation, or water-quality product. A line showing a creek does not establish a property boundary or a current flood limit. For emergency planning, construction, or legal decisions, use the appropriate agency’s latest detailed data. Here, the water map is intended to show the relative position of named rivers, creeks, lakes, and surrounding terrain.
Elevation climbs from the northern river corridor into the southern ridge country
The elevation map makes Sebastian County’s north-to-south transition especially clear. The graphic reports an actual elevation range of roughly 110 to 814 meters, with a mean near 195 meters. Low green terrain spreads around Fort Smith and the Arkansas River. Moving south, long narrow ridges become more frequent, and the strongest high-elevation areas appear near the southern and southwestern edges.
Greenwood lies in a transition zone between these two extremes. It is south of the broad northern lowlands but still north of the county’s highest terrain. Beyond Greenwood toward Huntington, Mansfield, and Hartford, repeated ridge bands and enclosed valleys become increasingly obvious. Some of the southern ridges are almost parallel, creating a landscape very different from the broad river corridor around Fort Smith.
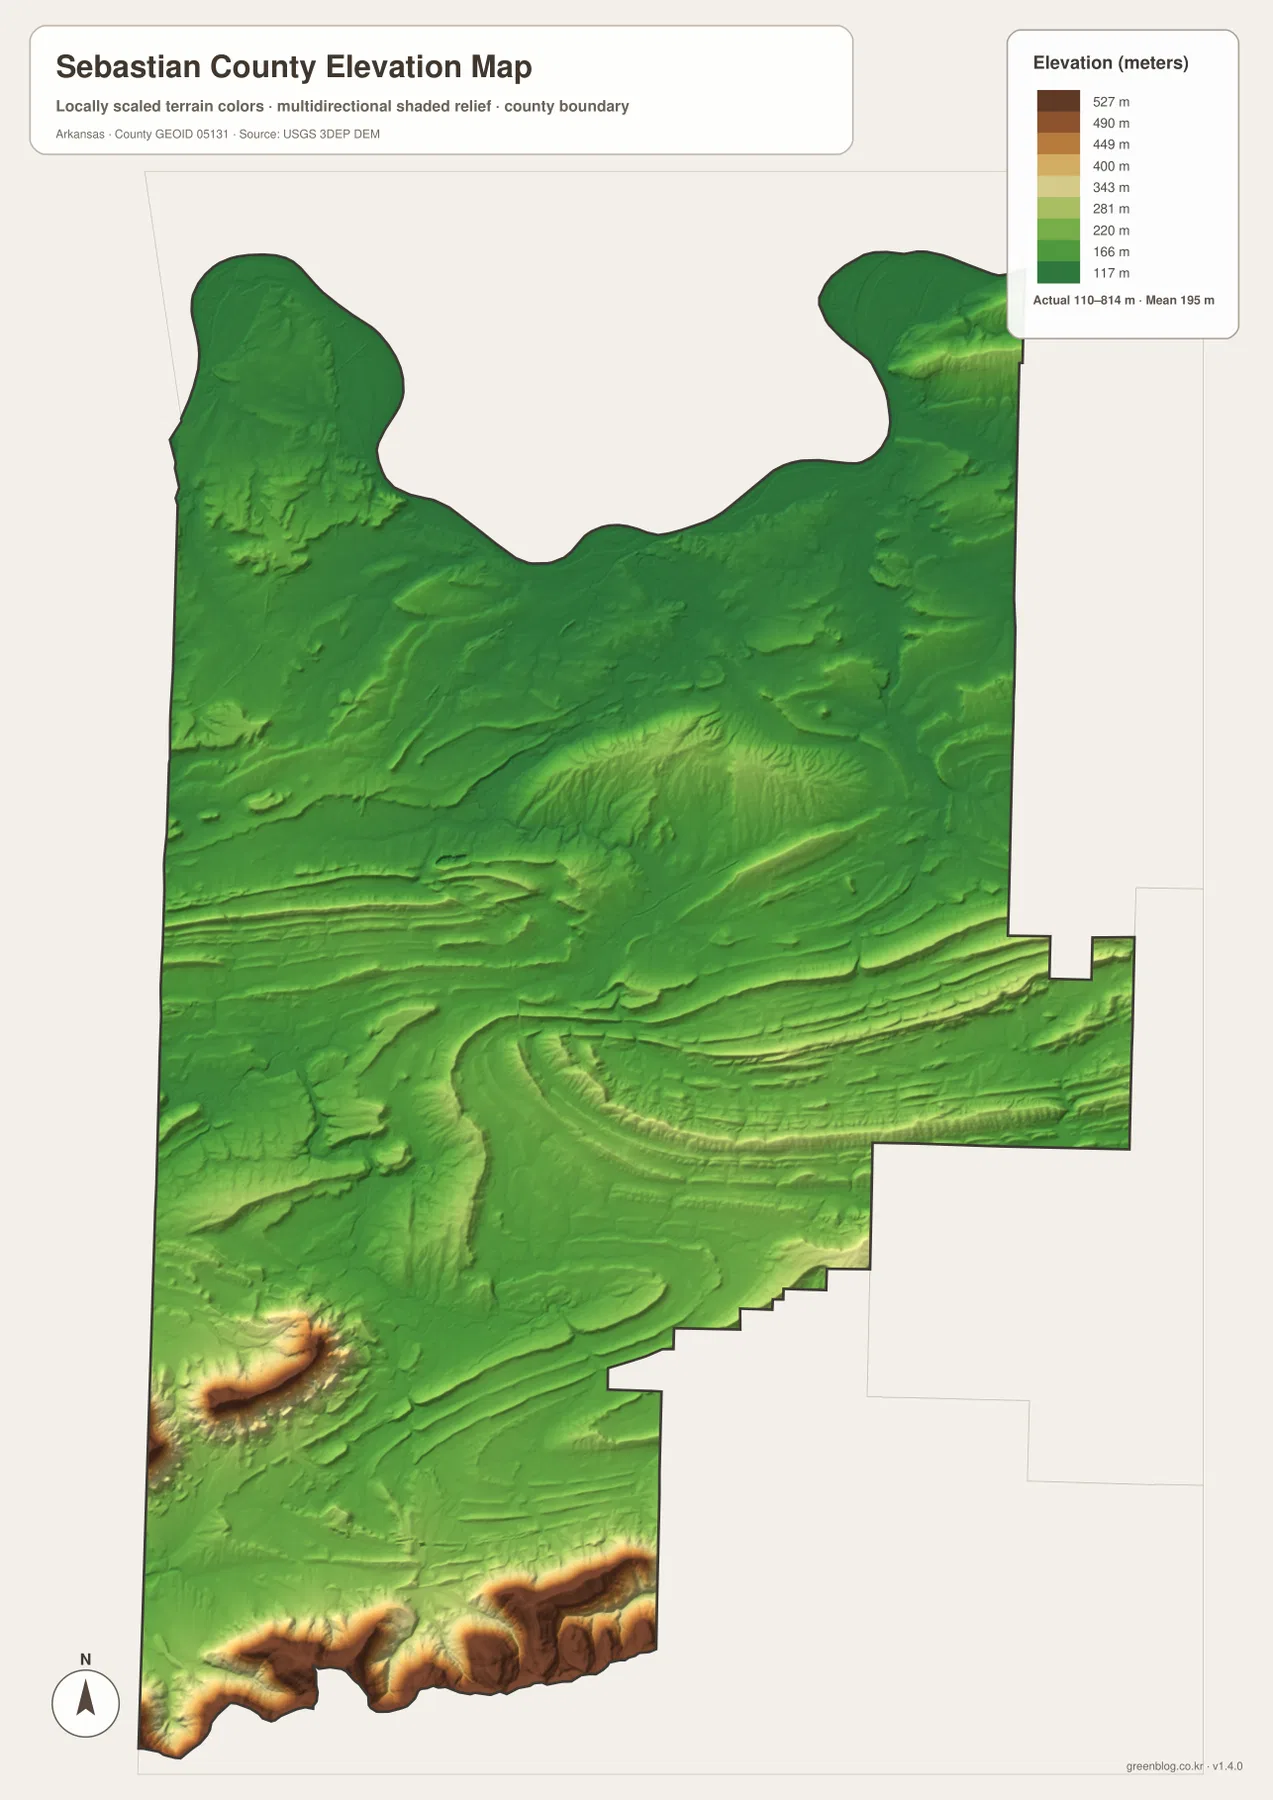
The Encyclopedia of Arkansas places Sebastian County in the Arkansas Valley and notes that the southern boundary reaches the Ouachita Mountains. The supplied elevation map makes that regional transition visible inside a single county. Broad low terrain dominates the north, while the south is broken by higher, longer ridges. Comparing this image with the terrain-and-water map also shows why so many southern creeks occupy narrow valleys between elevated bands.
The elevation colors are designed for regional comparison, not engineering or survey work. They are appropriate for identifying the higher and lower parts of the county and for discussing ridge-and-valley terrain. Exact parcel elevation, slope, drainage design, or construction decisions require detailed elevation data or field surveying. USGS 3D Elevation Program data are a better starting point when precise measurements are needed.
Reading from Fort Smith southward makes the road network easier to follow
A practical way to orient yourself is to begin at Fort Smith in the northwest. The Arkansas River and Oklahoma line establish the county’s top and left sides immediately. From Fort Smith, the road network leads east toward Barling and Lavaca, while the main southward routes eventually reach Greenwood. Once Greenwood is located, the more widely spaced communities of the southern half become easier to place.
Several route numbers help confirm direction on the reference map. U.S. 271 appears near Fort Smith, Arkansas 22 crosses the northern interior, and Arkansas 10 links the Greenwood and Hackett area. U.S. 71 continues through the central-southern corridor, while routes such as 45 and 96 help locate Hartford in the southwest. Rather than memorizing every number, use Fort Smith and Greenwood as anchors and then follow the route that reaches the place you need.
The same approach works for terrain. After finding Greenwood, Huntington, or Hartford on the reference map, locate the same area on the elevation map. The long ridges explain why the southern road pattern differs from the Fort Smith area. For water features, start with the Arkansas River and Poteau River in the north, then move inward to Big Creek and the smaller southern forks and creeks.
Pick the map that matches the detail you need
The county reference map is the best all-purpose view because it combines communities, roads, water features, facilities, and the county boundary. The city-distribution map is cleaner when you want to show where the largest settlements are concentrated. The terrain-and-water map is better for the Arkansas River, Poteau River, named creeks, lakes, and valley shapes. The elevation map is the clearest choice for explaining the large difference between the northern lowlands and southern ridges.
Two maps can be more useful than one when the topic combines settlement and physical geography. A Fort Smith presentation can pair the reference map with the water map to show the city’s position beside the Arkansas River and close to Oklahoma. A lesson about Greenwood and the southern communities can pair the road map with the elevation image to show how travel corridors pass between long ridge bands.
The WebP images on this page are optimized for on-screen viewing. The downloadable JPG originals are better for A3 printing, zooming into labels, or inserting a map into a document. Each supplied JPG is 2572 × 3638 pixels. Preserve the original proportions when resizing and allow for printer margins so place names, boundary lines, and road symbols are not stretched.
Frequently Asked Questions
Why does Sebastian County have two county seats?
Fort Smith and Greenwood both serve as county seats because Sebastian County was divided into two judicial districts in 1861. The map makes the geographic separation easy to see: Fort Smith anchors the northwest river-and-border urban area, while Greenwood is farther south in the county interior.
Where is Fort Smith in relation to the Arkansas River?
Fort Smith is in the northwest corner of Sebastian County beside a large bend of the Arkansas River and close to the Oklahoma line. The Poteau River also approaches the Arkansas River in this area, so the terrain-and-water map is the clearest view for understanding Fort Smith’s river setting.
Which map is most useful for the southern part of the county?
Use the reference map first to locate Greenwood, Huntington, Mansfield, and Hartford, then compare the same area on the elevation map. The southern half contains long ridges and narrow valleys that are much more obvious in the elevation view, so the two maps together explain both place location and terrain.
Map File Information
The ZIP contains four high-resolution JPG originals for Sebastian County: the county reference map, city-distribution map, terrain-and-water map, and elevation map.
- Included Files: County reference, city, terrain-and-water, and elevation maps
- Printable Size: 2572 × 3638 pixels each
- File Type: Four high-resolution JPG files in one ZIP archive
Related Maps
Sources and References
- Sebastian County Government – Official county information and courthouse details for Fort Smith and Greenwood.
- Encyclopedia of Arkansas – Sebastian County – County history and geography, including the two county seats, Arkansas Valley, Arkansas River, and Ouachita Mountains.
- U.S. Census Bureau QuickFacts – Sebastian County – Current official population, area, and other county statistics.
- USGS National Hydrography – Official information about U.S. rivers, streams, lakes, and hydrographic data.
- USGS 3D Elevation Program – Official elevation and terrain data information.
Green Map creates custom-edited map images using open geographic data sources such as geoBoundaries, Natural Earth, OpenStreetMap, and government open data.
These maps are edited visual materials, not raw data files, and are provided for education, documents, presentations, and graphic reference.