The Dade County Georgia Land Cover Map is dominated by forest, but the county does not look uniform from end to end. Forest accounts for 68.93% of the 2025 classification, while agriculture covers 16.80% and developed land 11.38%. Much of the built and farmed surface is concentrated in the long central valley, leaving broad wooded areas on the mountains to either side.
This page compares four views: 2025 land cover, forest and farmland, impervious surface, and the 1985–2025 class-difference map. The WebP images are provided for quick reading, and the four original 2480 × 1754-pixel JPG maps are available together in one ZIP for county profiles, classroom use, presentations, and broad landscape comparisons.
Table of Contents
A narrow Appalachian county where forest covers the mountains
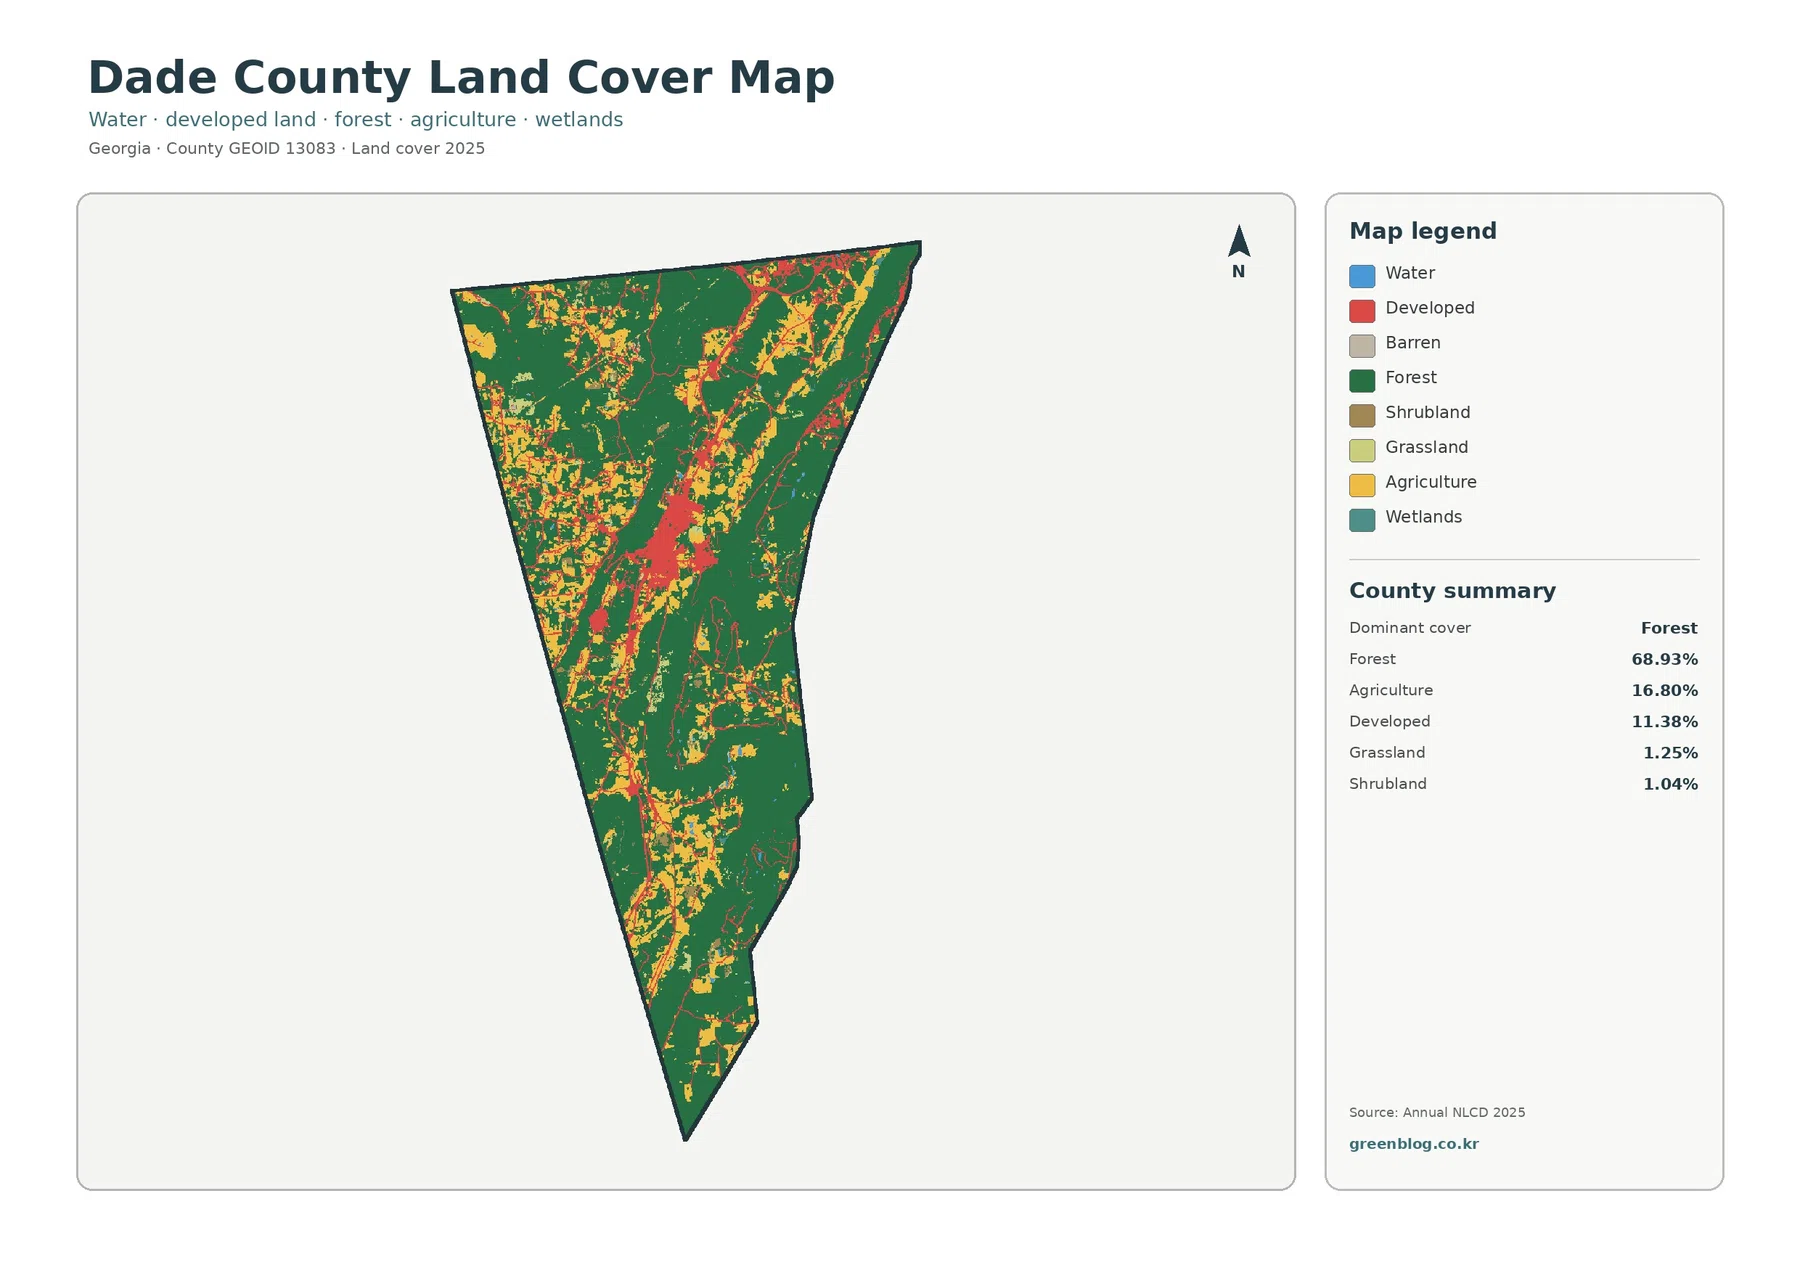
Dark green forest fills most of the county outline. Large continuous wooded areas appear along the eastern side and across much of the southern half, with another extensive forested area on the west. The county and City of Trenton comprehensive-plan material describes a central Lookout Valley between Lookout Mountain on the east and Sand Mountain on the west. That local setting helps explain why the map has such a strong contrast between wooded uplands and a more intensively used valley floor.
The county summary puts forest at 68.93%, making it by far the largest class. Agriculture is second at 16.80%. Yellow agricultural patches appear repeatedly through the central and western portions of the map, including several long or irregular openings that follow the county’s north-south shape. Developed land covers 11.38% and is much more clustered, especially around the middle and upper part of the valley.
Grassland accounts for 1.25% and shrubland for 1.04%. Open water is only 0.30%, while wetlands are 0.22%. Those small percentages are important when comparing Dade with counties where lakes, broad rivers, or coastal wetlands occupy large areas. Here, the map is primarily a forest-valley story rather than a water-dominated one. Narrow streams can also occupy less area than their importance to drainage would suggest.
The general map should not be read as a zoning map. A forest-colored cell says that tree cover was the predominant mapped surface, not that the property is protected forest or unavailable for development. Likewise, an agricultural cell does not establish a farm boundary or legal agricultural use. These distinctions matter in Dade County because the mountain-and-valley pattern can make the broad classes look sharper than actual parcel boundaries.
Farm openings and settled areas occupy the valley between wooded slopes
Dade County’s local planning documents place Trenton, Interstate 59, and Lookout Creek in the valley between the two mountain systems. On the land-cover image, the same central part of the county contains many of the agricultural and developed patches. The map does not label individual roads or parcels, so this is best treated as a geographic association rather than a claim that a specific road or settlement caused a particular land-cover class.
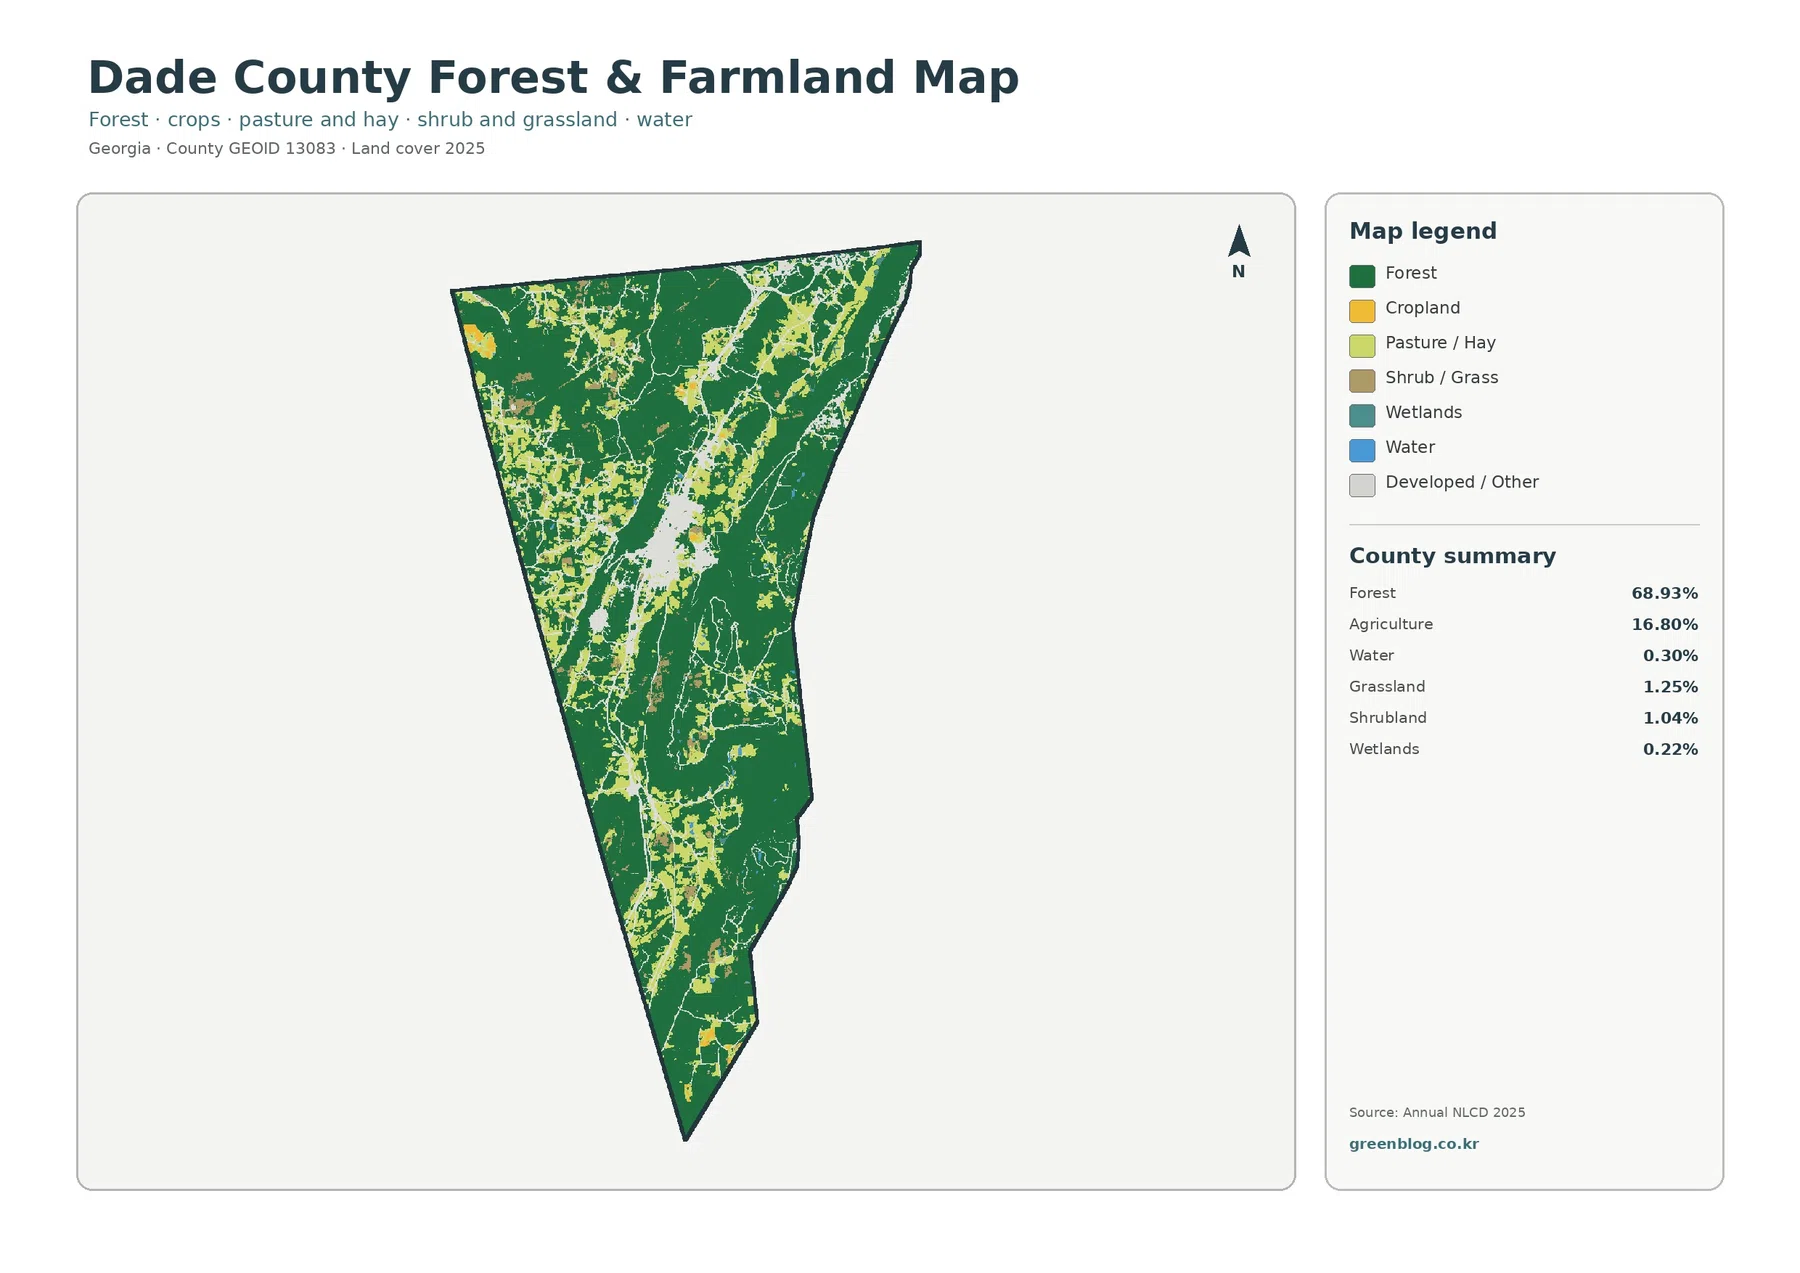
The forest-and-farmland view removes some of the visual complexity of the full legend. Forest remains the overwhelming background, but the openings become easier to compare. Agriculture appears in a chain of fields and open areas rather than as one continuous block. Many of these patches lie in the central corridor, while the mountain sides remain much more consistently wooded.
Water, at 0.30%, and wetlands, at 0.22%, are minor parts of the countywide area summary. That does not mean streams and watershed conditions are unimportant. The comprehensive plan discusses Lookout Creek and water-resource concerns in the valley, while the mapped percentages simply measure the area assigned to those surface classes. A narrow creek can be locally significant without occupying much of a 30-meter land-cover grid.
UGA Extension’s Dade County office provides agriculture and natural-resource education and services such as soil and water testing. That local context is useful when using the farmland map for a county profile. The map can show where agricultural cover is concentrated, but it cannot identify crops, ownership, productivity, or current farm management. Those questions require local records or field information.
Hard surfaces are limited countywide but concentrated around Trenton
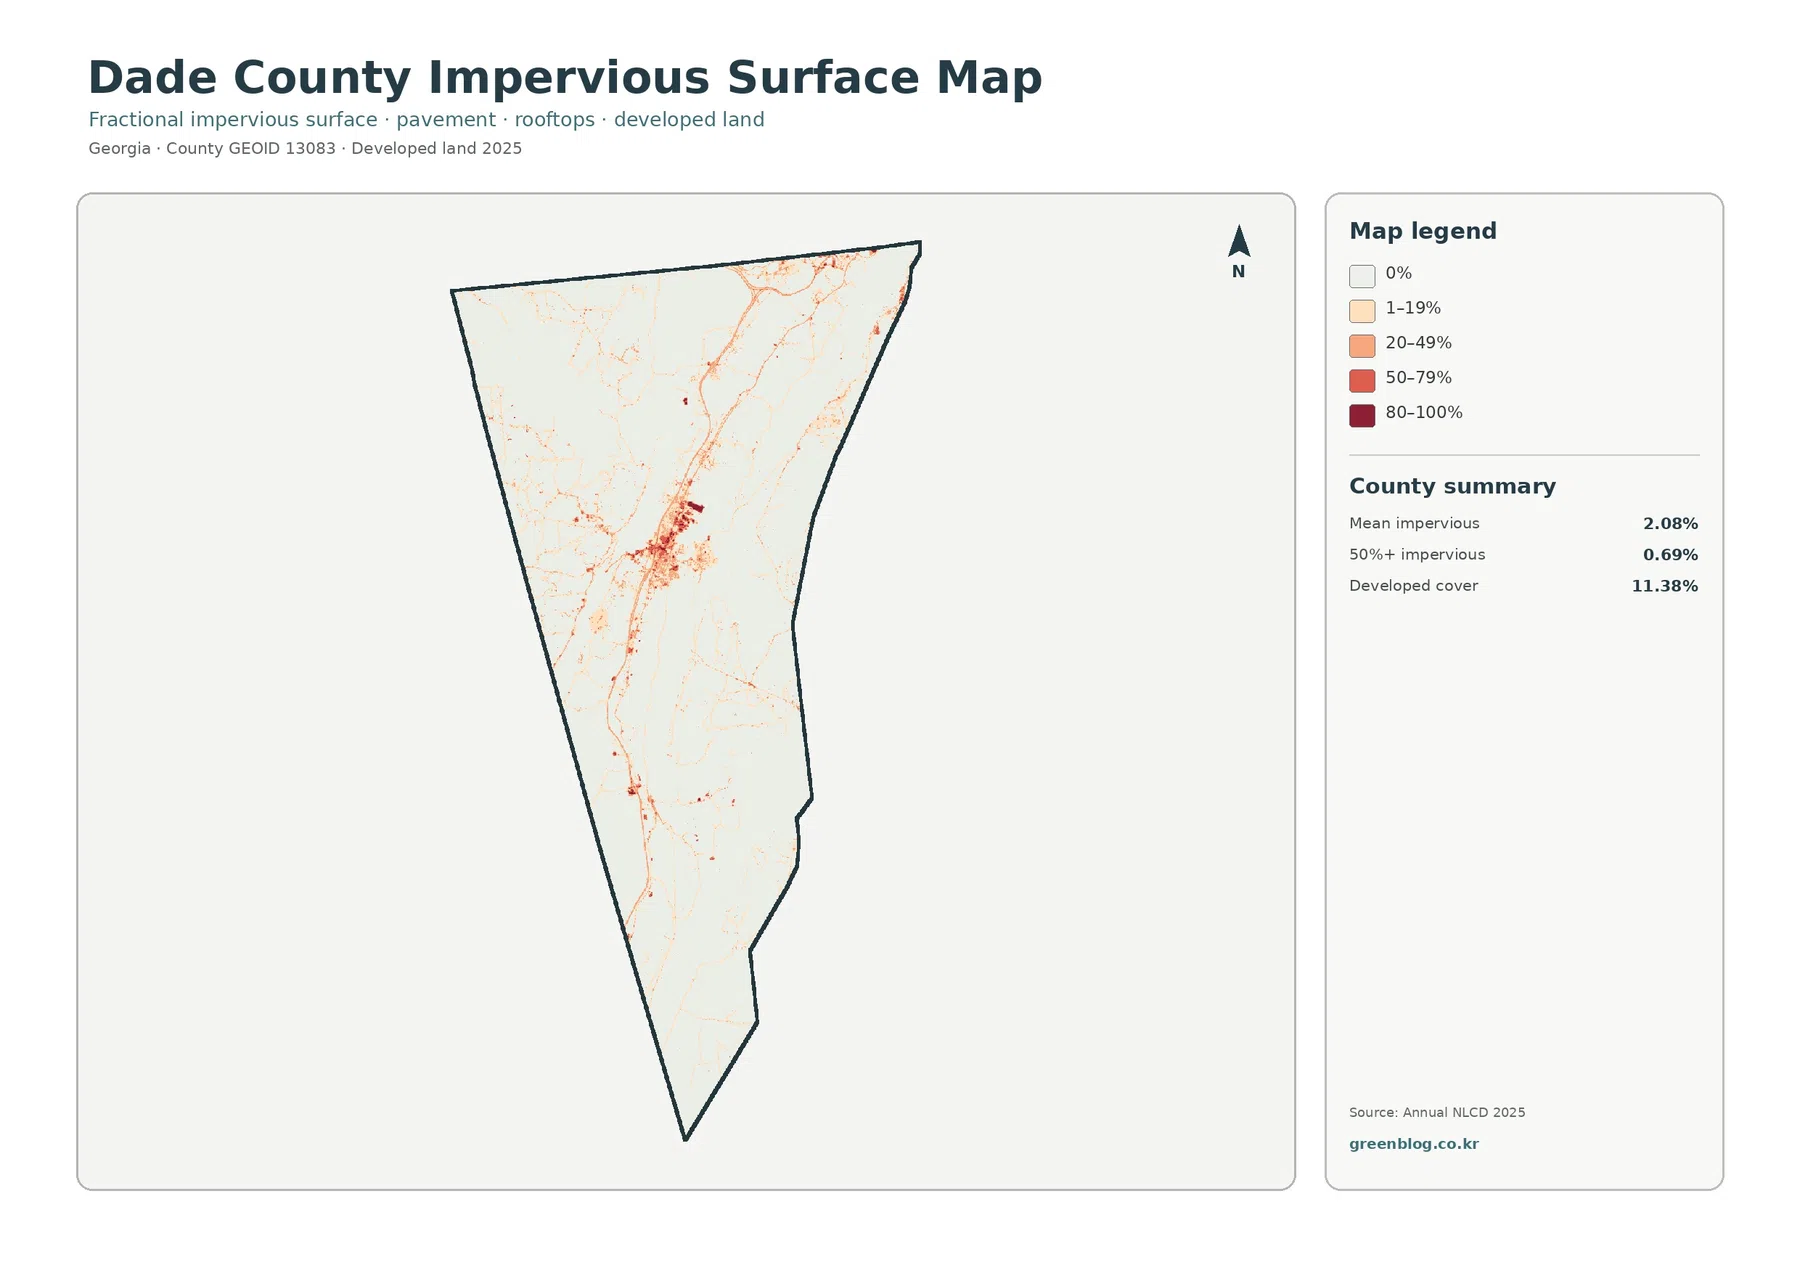
Impervious surface means pavement, rooftops, parking areas, and similar hard surfaces that do not readily absorb water. The countywide mean is 2.08%, and only 0.69% of Dade County is mapped with at least 50% impervious cover. Those numbers are much lower than the 11.38% developed-land share because a developed class may include lawns, trees, bare ground, and other permeable surfaces around roads and buildings.
The darkest impervious concentration sits in the central-northern valley around Trenton. A thin north-south network extends away from that cluster, matching the general orientation of the valley and the Interstate 59 corridor described in county planning material. Smaller branches appear farther north and south. In contrast, most of the mountain land remains very light on this map.
This difference between 11.38% developed cover and a 2.08% mean impervious surface is useful in presentations. The first number describes a broader land-cover category; the second isolates the hard part of the landscape. A lightly developed residential cell can still contain substantial vegetation, so it should not be treated as if the entire cell were pavement or roof.
The impervious map can support broad discussions of runoff, settlement concentration, and transportation corridors, but it is not a drainage or flood map. Slope, soil, culverts, rainfall, and channel geometry are not represented here. In a county with steep mountains beside a narrow valley, those missing factors can matter greatly, so engineering or property-level decisions require more detailed sources.
The 1985–2025 comparison shows scattered change rather than a countywide replacement
The change product compares two endpoints rather than documenting every year between them. Across Dade County, 15.59% of cells received a different mapped class in 2025 than in 1985. The summary identifies 4.66% as forest loss, 3.04% as classified to developed, 0.79% as agricultural loss, and 7.08% as other class difference.
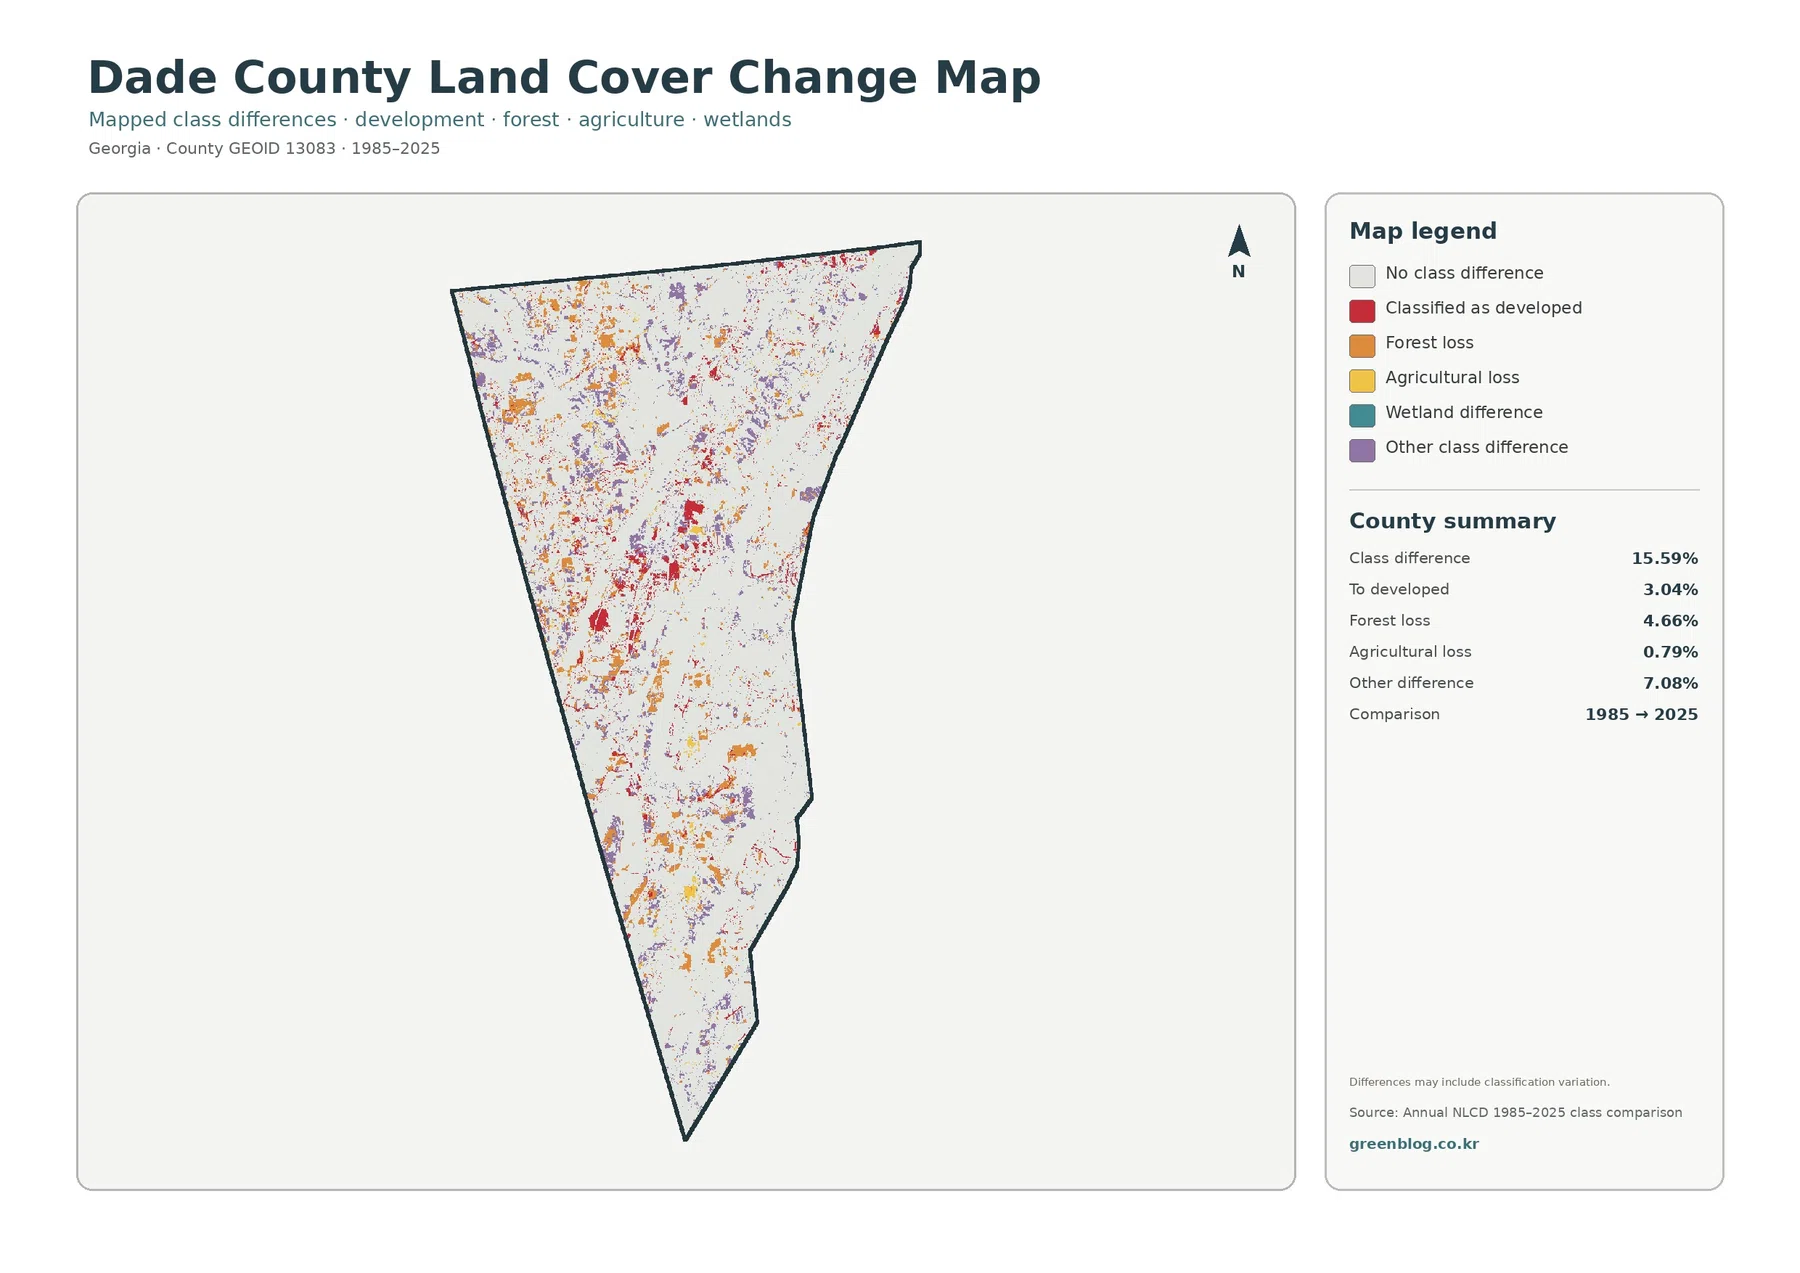
Change colors are most noticeable in the northern and central parts of the county, with additional scattered patches to the south. Red cells classified as developed cluster near the main settled corridor, while orange forest-loss cells appear in numerous smaller patches. Purple other-class differences are also widespread enough to be important; not every changed cell fits a simple forest-to-development story.
A 4.66% forest-loss label should not be interpreted as a complete record of permanent clearing during the forty-year period. A cell may have changed more than once between the two endpoints, and classification can vary because of imagery, mixed pixels, or changes in the mapping method. The map itself notes that differences may include classification variation.
The most defensible use is screening. Areas with many change cells can be selected for closer review using annual NLCD products, historical aerial imagery, planning documents, or local records. That approach turns the map into a starting point for investigation rather than using it to assign a date or cause to each colored patch.
What the four maps say when read together
Each map answers a different part of the same countywide question. The general land-cover map establishes the 68.93% forest majority. The forest-and-farmland view makes the 16.80% agricultural openings easier to see. The impervious product shows that hard surfaces occupy a small share of the county even though development is visually prominent in the valley. The change map adds a time comparison without pretending to be a year-by-year history.
Together, they describe a county where wooded mountains occupy most of the area and human use is concentrated in a narrower central corridor. Trenton is the clearest built cluster, agriculture appears through the valley and other openings, and the large mountain blocks retain strong forest cover. This arrangement is much more informative than calling Dade simply rural or developed because both conditions are present in different parts of a very narrow landscape.
For a classroom lesson, the full map can introduce the county and the impervious map can demonstrate why developed land is not the same thing as pavement. A natural-resource presentation can pair the forest-and-farmland view with the local mountain-and-valley setting. A planning discussion can use the change map to identify places that deserve closer review, while clearly stating that the product does not show zoning, property lines, permits, or development causes.
Scale, resolution, and what these files cannot show
Annual NLCD is a raster dataset built from 30-meter cells. Each square receives one predominant class even when trees, a driveway, grass, a ditch, and a building share the same area. That generalization is suitable for county-scale patterns but not for parcel inspection. Enlarging the JPG will make the cells bigger; it will not reveal detail that was never present in the source classification.
The four original JPG files measure 2480 × 1754 pixels each. They work well for screens, documents, slides, and moderate-size printing. The package does not identify them as meeting an A3 high-resolution reference, so a large poster should be test-printed before final use. The WebP images on this page are preview copies rather than a substitute for the original downloadable JPGs.
Land cover is also different from land use and zoning. Forest means tree-dominated surface, not a legal forest designation. Developed cover does not tell you what a building is used for, and agriculture does not establish ownership or a farm parcel. Anyone making property, permitting, engineering, or legal decisions should use current county records and higher-resolution information.
The observation year matters as well. These maps summarize the supplied 2025 classification, so construction, clearing, vegetation recovery, or other changes after that observation period will not appear. When current conditions are critical, compare the maps with recent imagery and local information rather than assuming the classification is a live view.
Four original JPG maps in the download
The ZIP contains one JPG for 2025 land cover, forest and farmland, impervious surface and developed land, and 1985–2025 land-cover change. Use the general map for a quick county overview, the forest/farmland map for the mountain-to-valley contrast, the impervious map for the Trenton-area hard-surface concentration, and the change map when a two-date comparison is needed.
Frequently Asked Questions
Is Dade County mostly forest in the 2025 map?
Yes at the county scale. Forest is the dominant class at 68.93%. The central Lookout Valley is more mixed, however, with agriculture and development concentrated around Trenton and the main transportation corridor.
Why is developed cover 11.38% when mean impervious cover is only 2.08%?
Developed land is a broader class that can contain lawns, trees, and other permeable surfaces around buildings and roads. Impervious cover isolates hard surfaces such as pavement and rooftops, so its countywide average is much lower.
Does 15.59% class difference mean that much of the county was permanently changed?
No. It is the share of cells assigned different classes at the 1985 and 2025 endpoints. It can include real surface change and classification variation, and it does not identify the exact year or cause of a transition.
Sources and Reference Data
- MRLC Annual NLCD Data – official access to annual land-cover products and comparison data
- USGS Annual NLCD Land Cover Classification – definitions and guidance for mapped land-cover classes
- U.S. Census Bureau TIGER/Line Shapefiles – official county-boundary reference
- Dade County & City of Trenton Joint Comprehensive Plan – current planning information covering growth, transportation, development, and natural resources
- Northwest Georgia Regional Commission – Dade County & Trenton Comprehensive Plan – local context for Lookout Mountain, Sand Mountain, Lookout Valley, I-59, and natural resources
- UGA Extension – Dade County Agriculture & Natural Resources – local agriculture and natural-resource education and services
Map File Information
The ZIP contains four original JPG maps covering Dade County's 2025 land cover, forest and farmland, impervious surface, and 1985–2025 class differences.
- Included Files: General land cover, forest and farmland, impervious/developed surface, and land-cover change maps
- File Type: Four original JPG map files bundled in one ZIP archive
- Intended Use: Printing, education, presentations, and map-based projects
Related Maps
- Appling County Georgia Land Cover Map
- Atkinson County Georgia Land Cover Map
- Bacon County Georgia Land Cover Map
Green Map creates custom-edited map images using open geographic data sources such as geoBoundaries, Natural Earth, OpenStreetMap, and government open data. These maps are edited visual materials, not raw data files, and are provided for education, documents, presentations, and graphic reference.