Illinois has a statewide average population density of about 229 people per square mile, but that number hides one of the sharpest geographic contrasts visible in these maps. The 2024 ACS-based state total is 12,694,798 people across 55,513 square miles of land. A very large share of the densest settlement is concentrated in northeastern Illinois around Chicago, while much of central and southern Illinois consists of lower-density counties punctuated by distinct city clusters.
The five maps answer different questions, so they are most useful when read together rather than treated as interchangeable. Census tract shading shows where people are concentrated at a fine scale. The city map sizes circles by census-place population. County circles represent total population, not density. The county choropleth compares residents per square mile, and the 2010–2020 map measures percentage change over a decade. Keeping those measures separate makes the statewide pattern much easier to understand.
Table of Contents
The tract map shows a continuous high-density region around Chicago
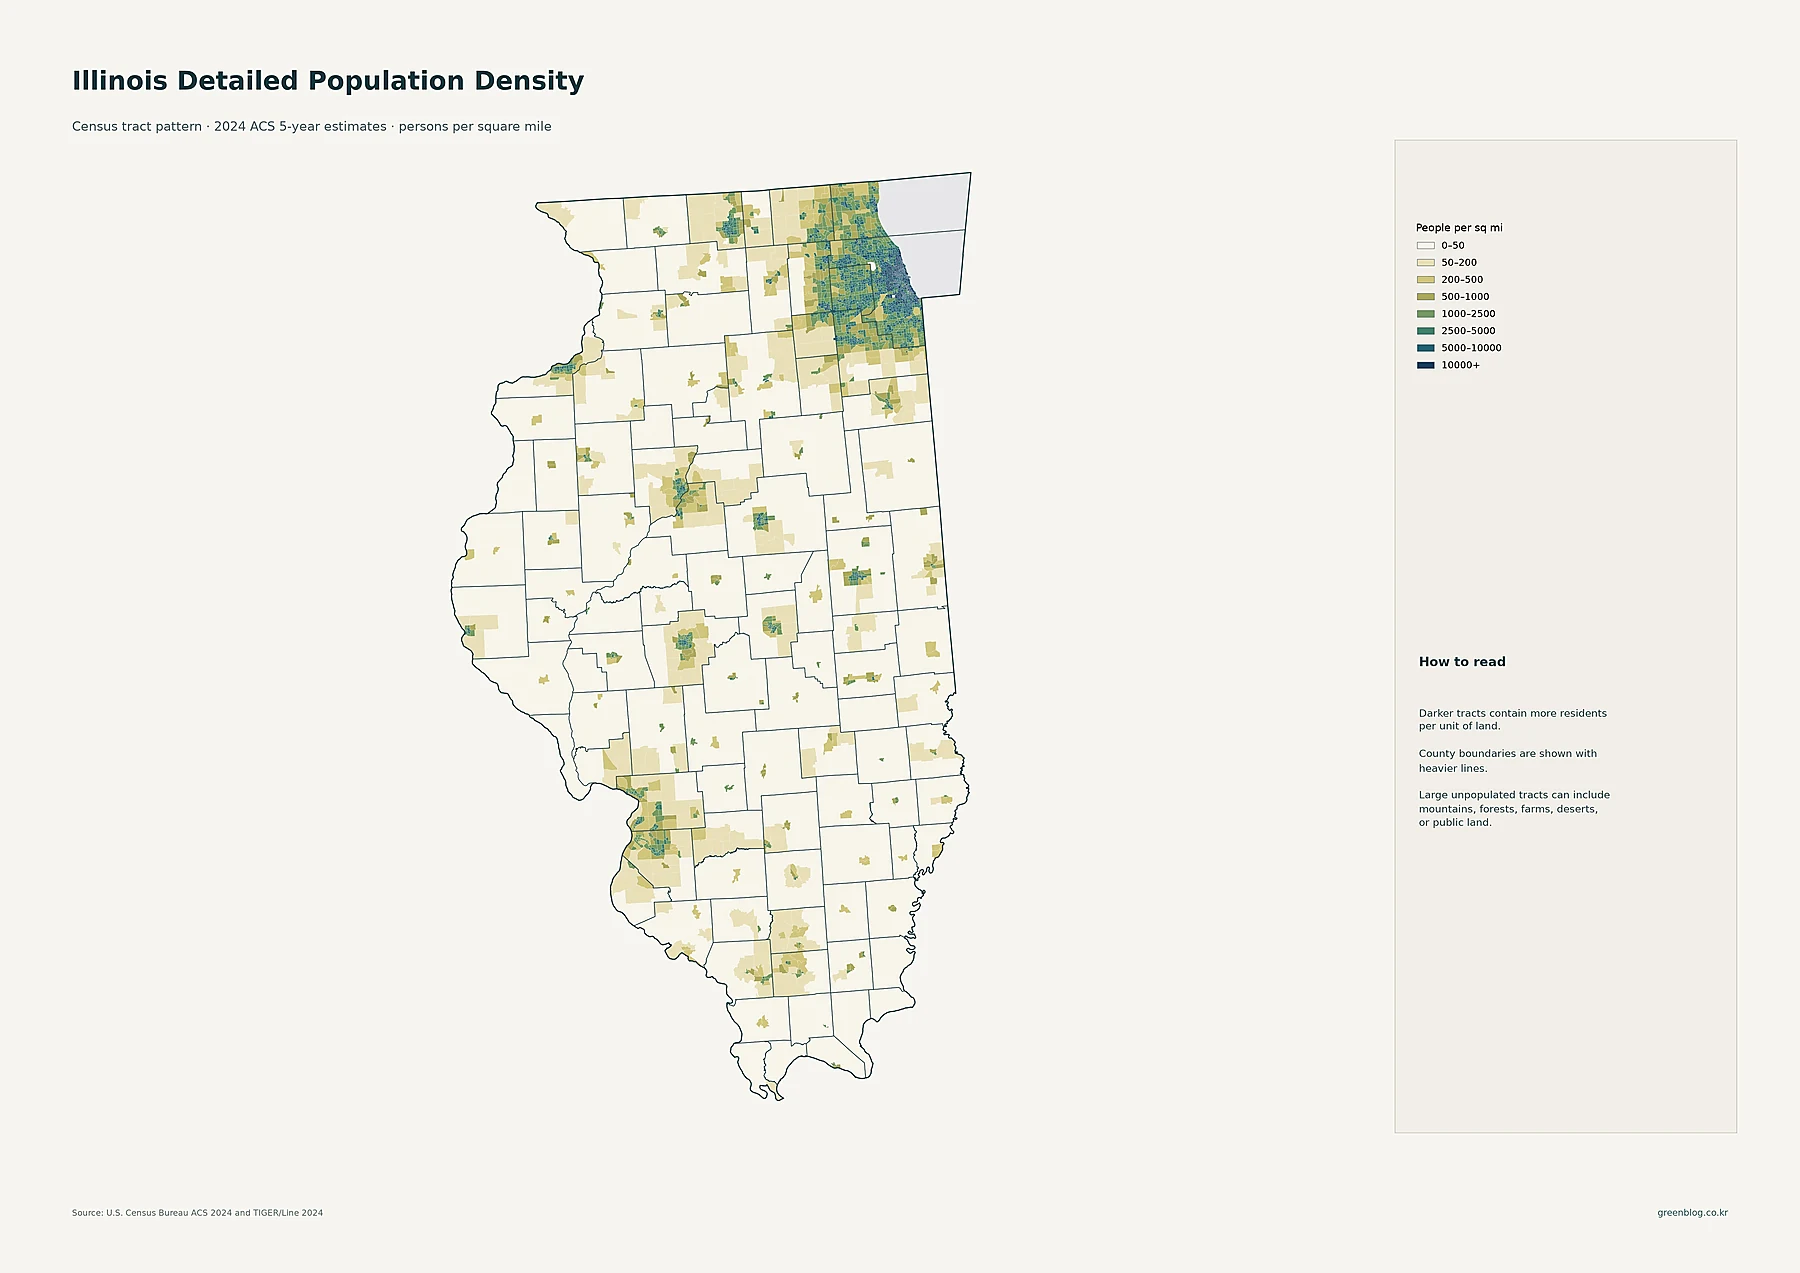
The detailed density legend runs from 0–50 people per square mile to 10,000 or more. Northeastern Illinois contains by far the largest continuous field of medium- and high-density tracts. Chicago and nearby Cook County form the darkest core, but the pattern does not stop at the city boundary. Dense and moderately dense tracts extend through the suburban counties toward DuPage, Lake, Kane, Will, and McHenry, creating a broad urbanized region rather than a single isolated concentration.
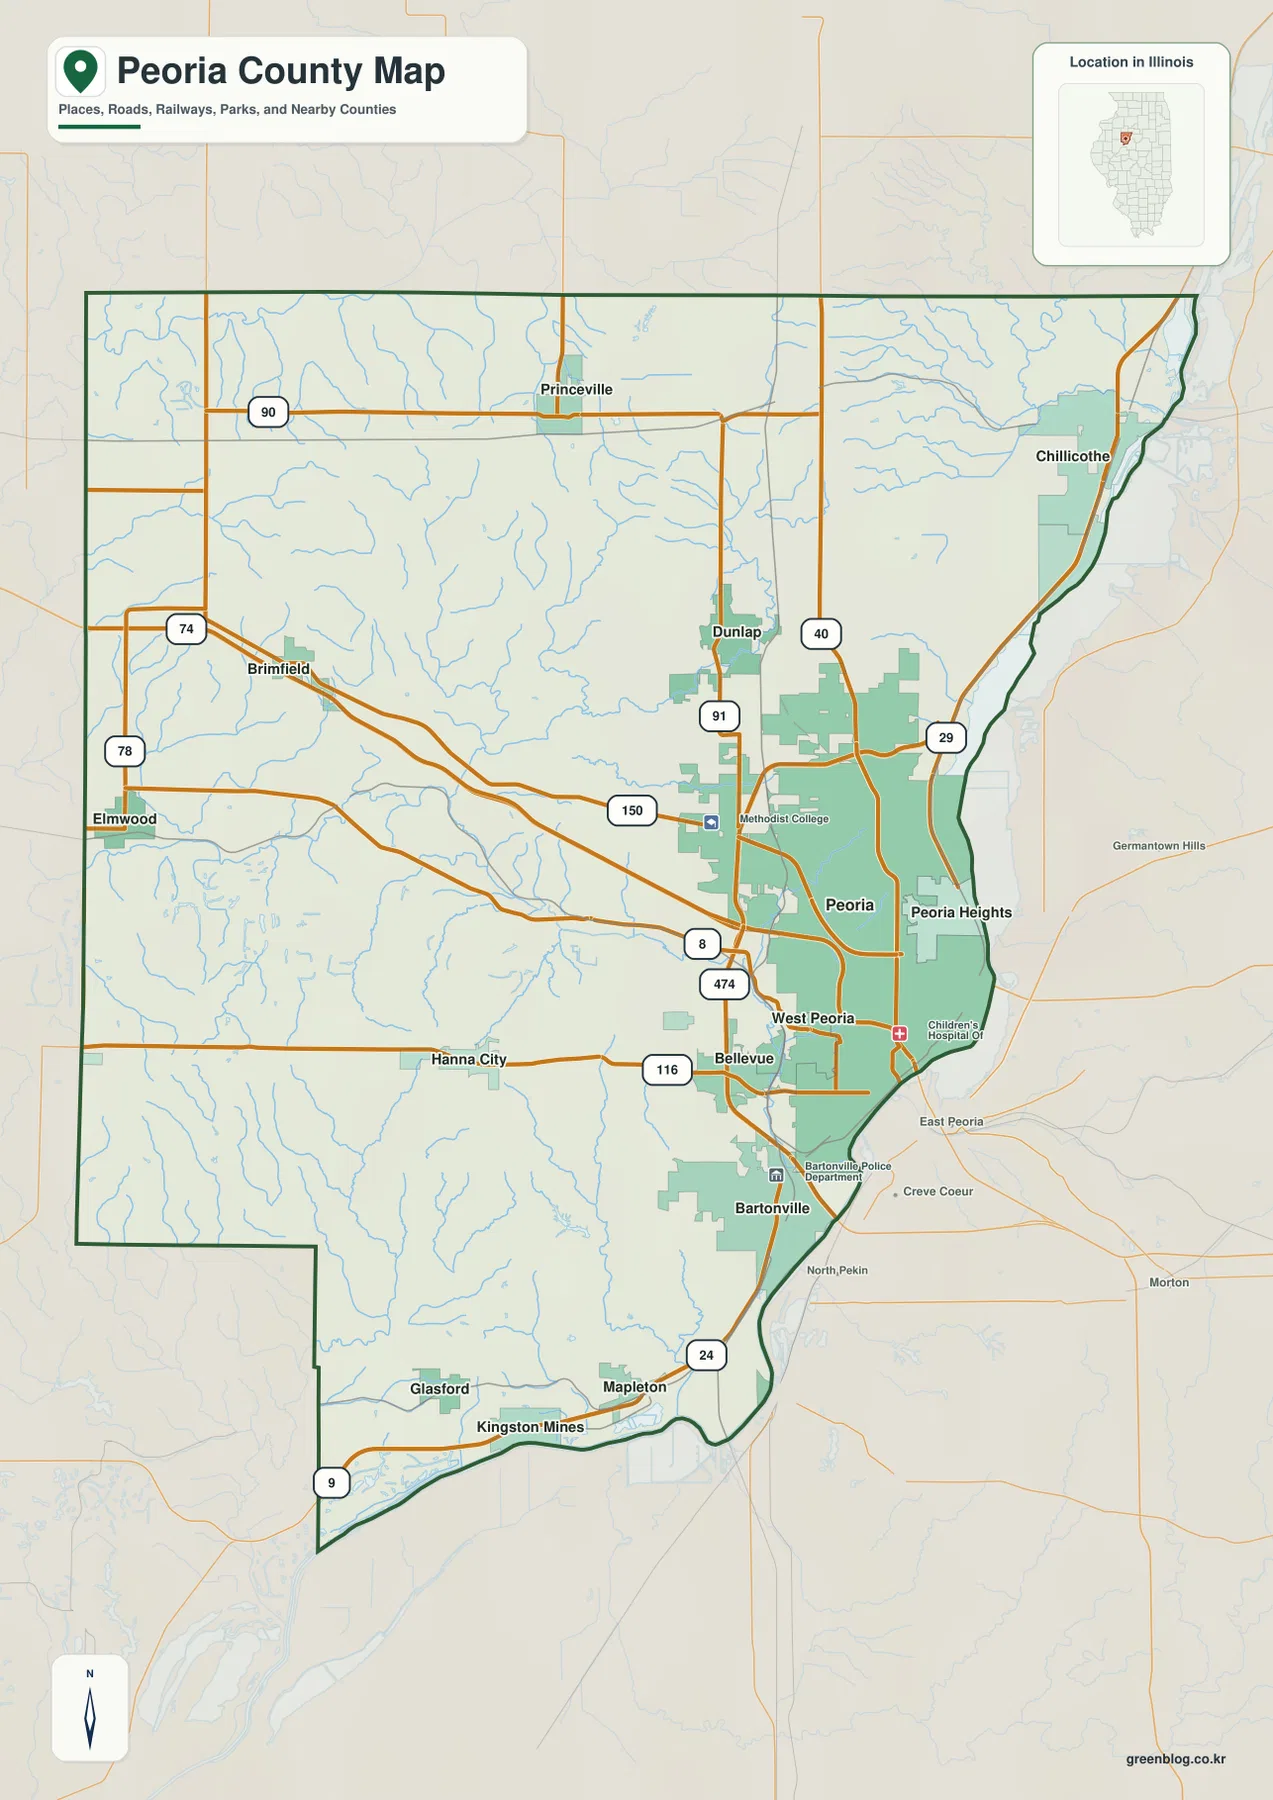
Elsewhere, dense settlement is much more localized. Rockford creates a noticeable cluster in the northwest. Peoria and Bloomington stand out in central Illinois, Champaign appears as a compact east-central concentration, and Springfield forms another urban patch farther south. The Metro East area near St. Louis is also visible in southwestern Illinois. Between those clusters, large portions of the map fall into the lightest density classes. At tract scale, Illinois therefore looks less like a uniformly populated agricultural state and more like one dominant metropolitan region plus a network of separated urban nodes.
County totals show how much of the state’s population sits in the northeast
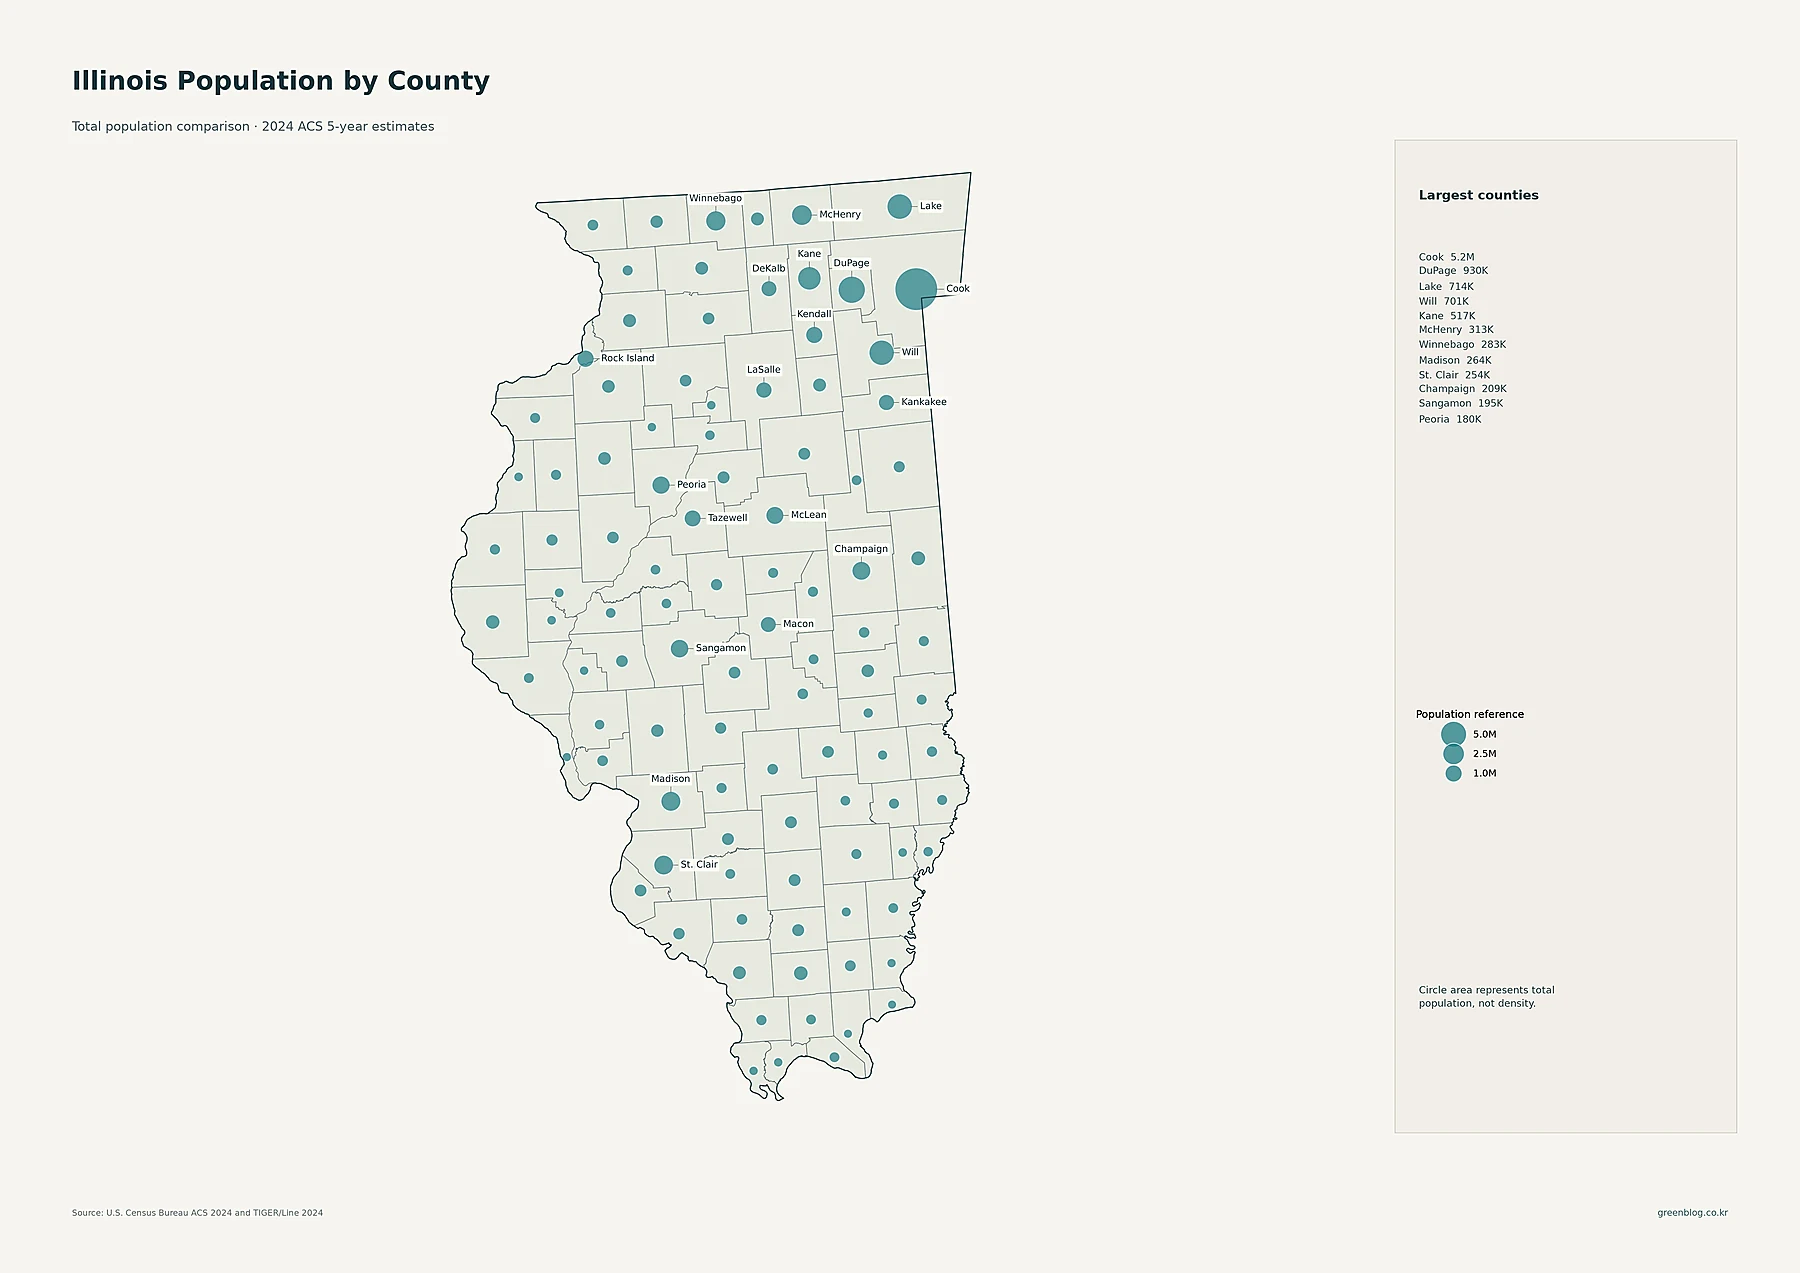
Cook County dominates the county-total map with 5,182,090 residents. The next-largest counties are DuPage at 930,024, Lake at 714,223, Will at 701,462, and Kane at 517,255. McHenry adds another 312,591 people to the group of large northeastern counties. The difference between Cook and every other county is so large that it immediately establishes the geographic imbalance in Illinois population totals.
Large counties outside the Chicago region are more dispersed. Winnebago has 283,292 residents, Madison 264,238, St. Clair 253,694, Champaign 208,741, Sangamon 194,947, and Peoria 179,645. These counties correspond to important regional centers, but none approaches the scale of Cook or the combined concentration of the northeastern counties. The proportional circles should not be read as a density measure: a large circle means many residents in the county as a whole, regardless of county land area.
Major places reveal a dense network of cities and suburbs in northeastern Illinois
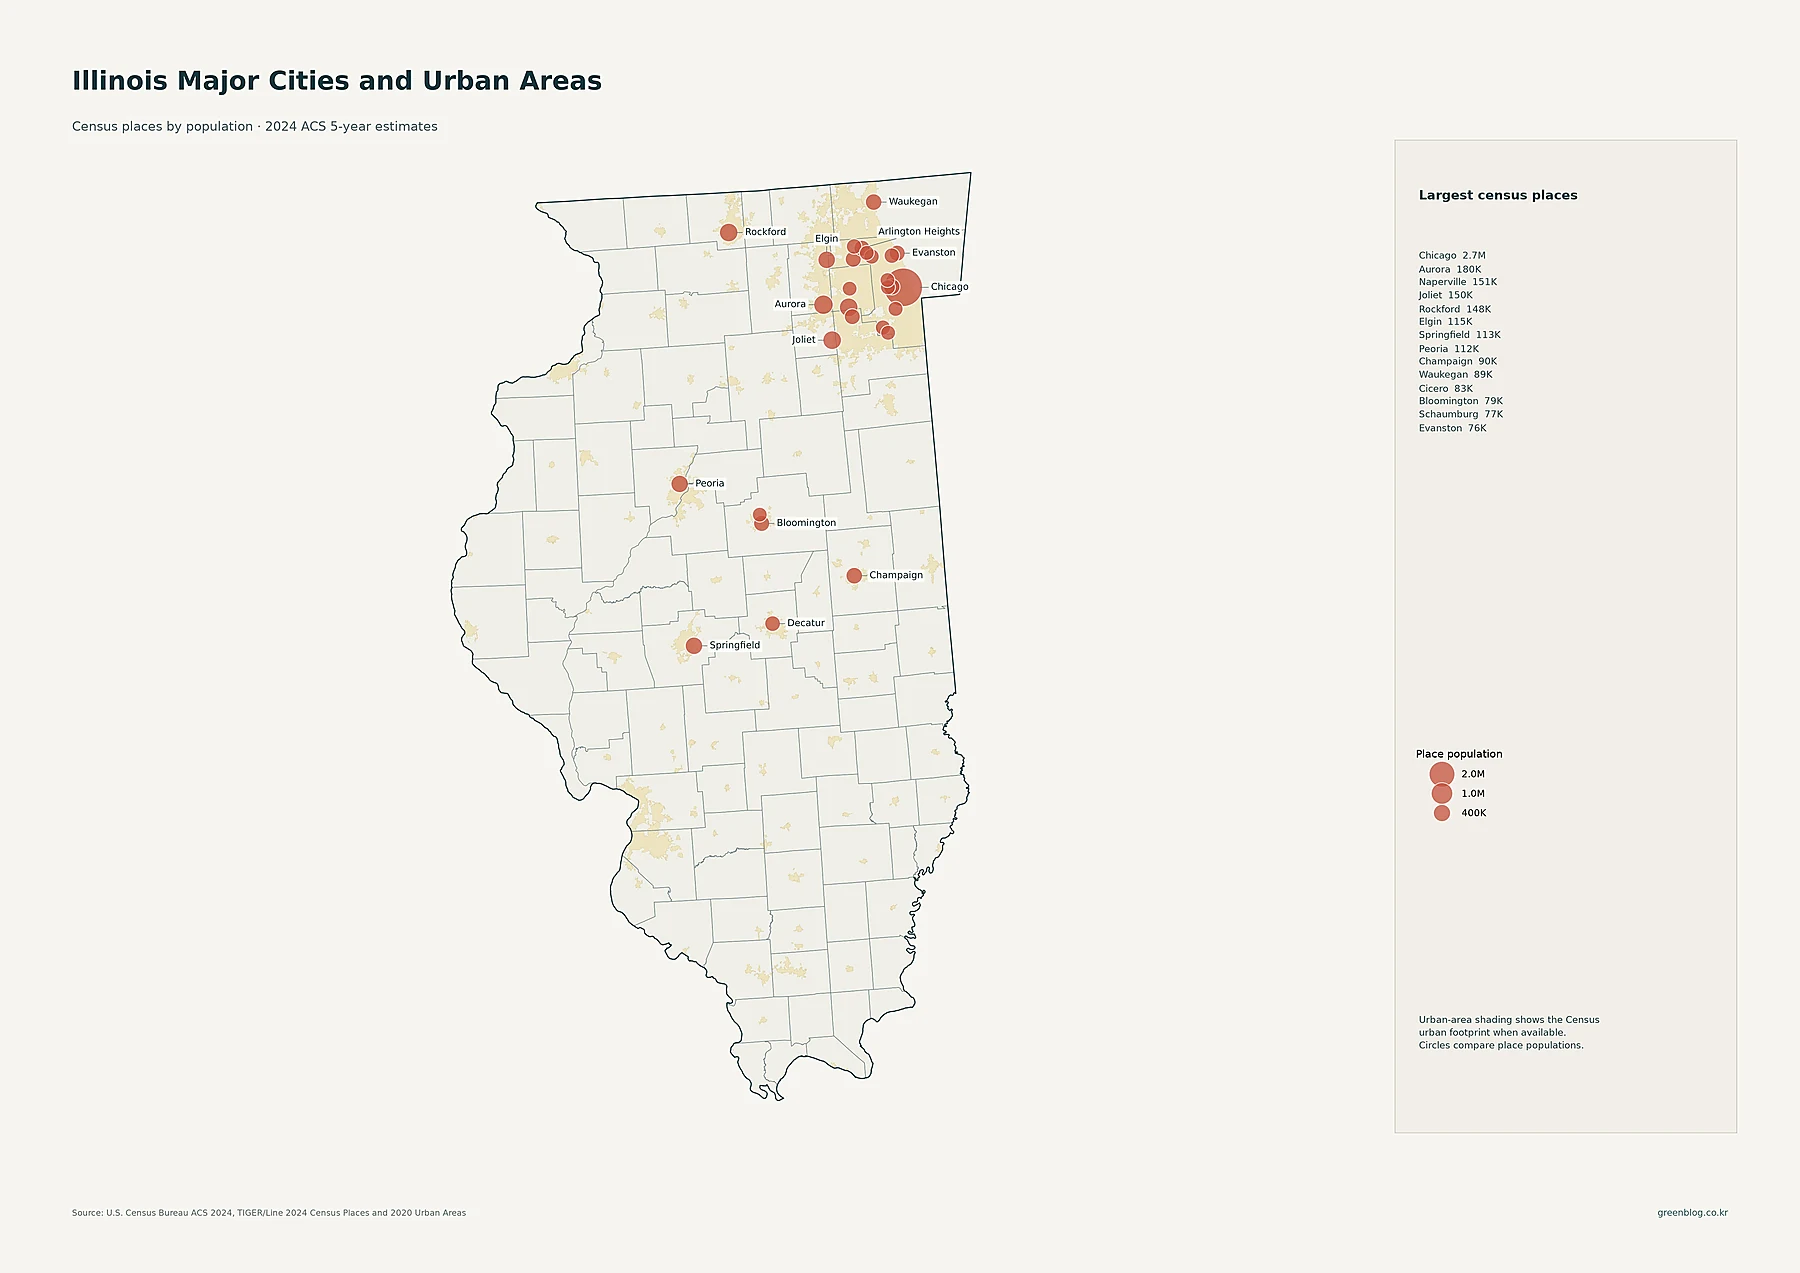
Chicago is estimated at about 2.71 million people on the city map, far larger than any other Illinois census place. Aurora is next at about 180,000. Naperville and Joliet are each around 150,000, followed closely by Rockford at about 148,000. Elgin is about 115,000, Springfield 113,000, and Peoria 112,000. Champaign, Waukegan, Cicero, Bloomington, Schaumburg, Evanston, and Arlington Heights also appear among the largest places.
The spatial arrangement matters as much as the rankings. Many of the larger places are packed into northeastern Illinois around the Chicago urban area, including Aurora, Naperville, Joliet, Elgin, Waukegan, Evanston, Schaumburg, and Arlington Heights. By comparison, the main cities of central and southern Illinois are separated by much larger stretches of low-density territory. This city map helps explain the continuous northeastern pattern on the tract-density map without confusing place population with residents per square mile.
County density puts Cook and DuPage in a different class
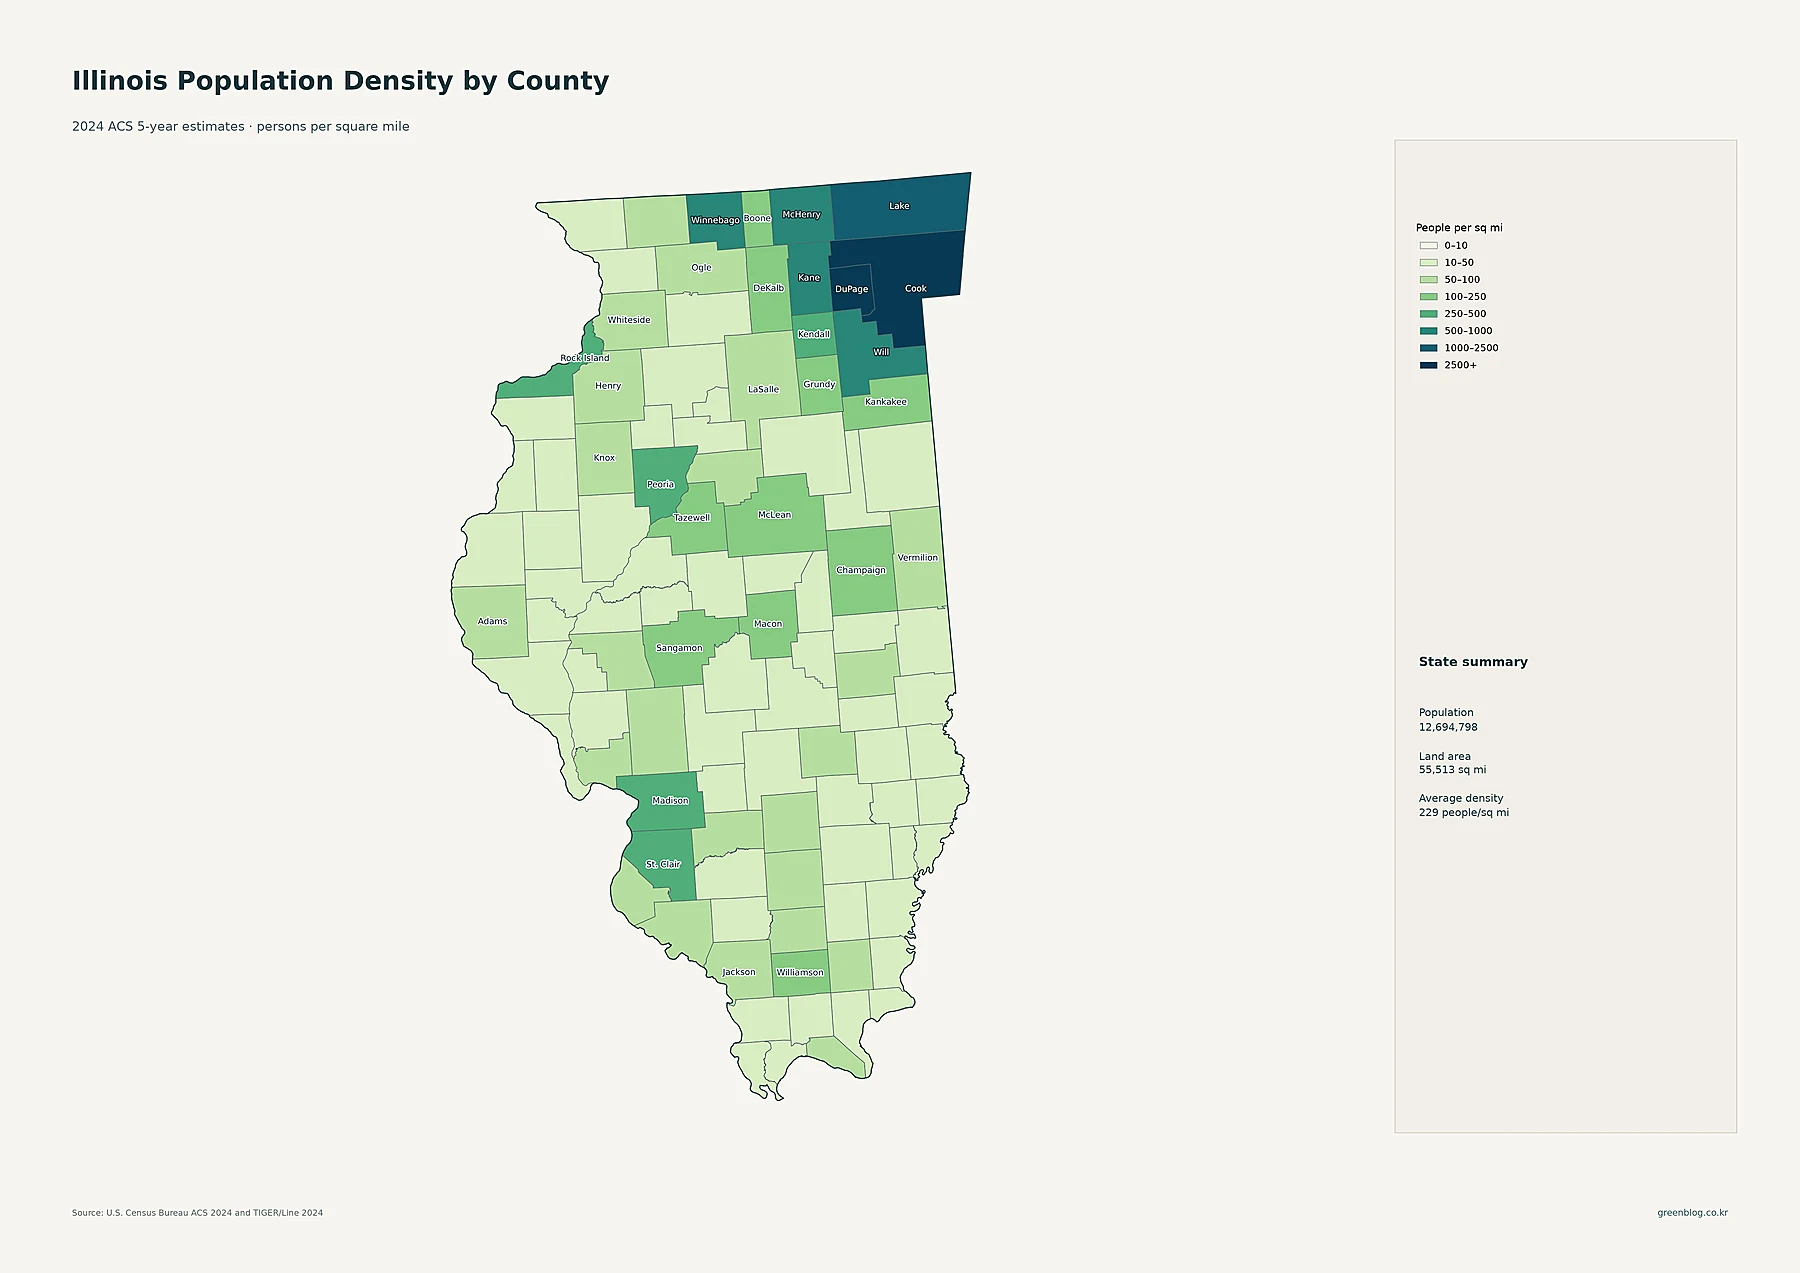
At county scale, Cook has an average density of about 5,484 people per square mile, the highest in Illinois. DuPage follows at roughly 2,837. Lake is about 1,610, Kane 996, and Will 839. Winnebago and McHenry are just above 500, while Kendall is about 430. St. Clair and Madison are approximately 386 and 369 people per square mile. The county map therefore preserves the northeast-to-rest-of-state contrast seen in the tract map, even after local detail is averaged into county boundaries.
Several regional centers also appear darker than their neighbors, including Peoria, Sangamon, Champaign, Madison, and St. Clair counties. Still, many counties in western, central, and southern Illinois fall into the 10–50 or 50–100 people-per-square-mile classes. This is why the statewide average of 229 should not be used as a stand-in for typical local conditions. A resident in dense Cook County and a resident in a sparsely populated southern county are experiencing very different settlement patterns even though both are part of the same state average.
| Measure | Leading area | Value in the supplied data |
|---|---|---|
| Illinois population | Statewide | 12,694,798 |
| Largest county population | Cook | 5,182,090 |
| Highest county density | Cook | about 5,484/sq mi |
| Fastest 2010–2020 growth | Kendall | +14.9% |
| Largest 2010–2020 decline | Alexander | -36.4% |
The 2010–2020 map is a change map, not a snapshot of current size
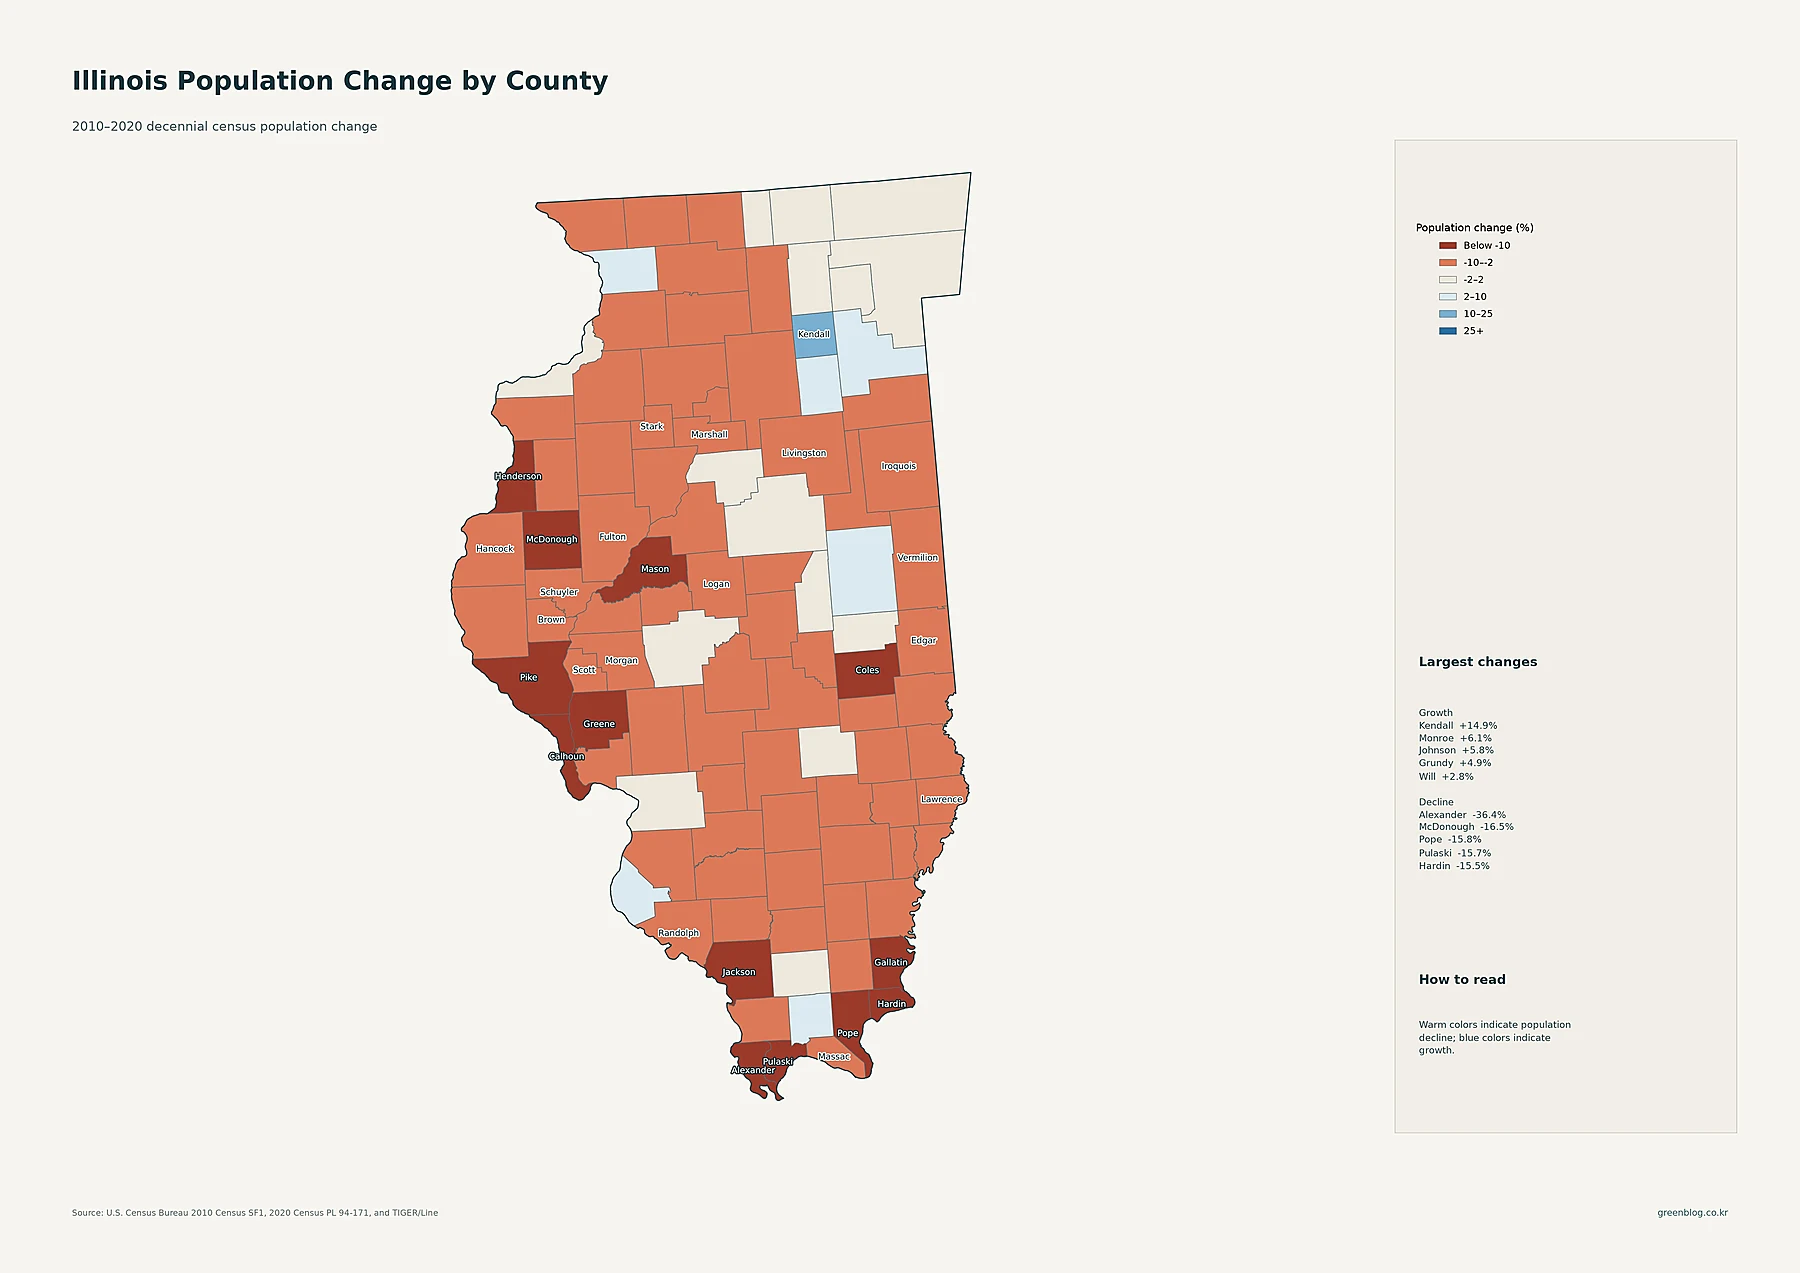
Kendall County recorded the strongest growth in the supplied 2010–2020 comparison at +14.9%. Monroe grew by +6.1%, Johnson by +5.8%, Grundy by +4.9%, and Will by +2.8%. Champaign increased by about +2.4%. Even very large northeastern counties such as DuPage, Cook, and Lake posted only modest percentage gains of roughly +1.7%, +1.6%, and +1.5%. The map makes clear that the county with the most people is not necessarily the county with the fastest percentage growth.
Decline covers a much broader portion of the map. Alexander County had the largest decrease at -36.4%. McDonough declined by -16.5%, Pope by -15.8%, Pulaski by -15.7%, and Hardin by -15.5%. Greene and Coles were also down by about -13.7% and -13.0%. The map’s legend separates declines below -10%, declines from -10% to -2%, near-stable counties, and several levels of growth. Those colors describe the size and direction of change only; the map does not by itself establish the reasons a county gained or lost population.
What the maps say when combined
Illinois has one exceptionally large and dense metropolitan core, several important but much smaller regional centers, and extensive low-density territory between them. Cook leads both total population and county density, while the suburban counties around it create a much broader zone of high tract density. Central and southern cities are visible as compact clusters, but the surrounding counties generally remain lighter on the density maps. The decade-change layer adds a separate story: Kendall led percentage growth, while many counties—especially in western and southern parts of the state—lost population between 2010 and 2020.
For practical use, choose the layer that matches the question. Use the tract map when neighborhood-scale density patterns matter, the city map when comparing large census places, the county-circle map for total population, the county choropleth for average density, and the change map for decade-to-decade direction. Reading all five together avoids a common mistake: assuming that “largest,” “densest,” and “fastest-growing” identify the same places.
Download the Illinois population map collection
The ZIP includes the detailed density, major cities, county population, 2010–2020 change, and county density maps in the supplied download format.
FAQ
Which Illinois county has the highest population density?
Cook County is the densest in the supplied 2024 ACS data at about 5,484 people per square mile. DuPage County is second at about 2,837 per square mile.
Is Cook County also the most populous county in Illinois?
Yes. Cook County has an estimated 5,182,090 residents in the 2024 ACS data, far more than any other Illinois county. Total population and density remain separate measures, even though Cook ranks first in both here.
Which Illinois county grew the fastest from 2010 to 2020?
Kendall County had the largest percentage increase in the supplied decennial census comparison at about +14.9%. Alexander County had the largest decline at about -36.4%.
Related Maps
Sources
- U.S. Census Bureau — American Community Survey (ACS): 2024 ACS 5-year population estimates.
- U.S. Census Bureau — TIGER/Line Shapefiles: 2024 county, tract, and place geography used in the maps.
- U.S. Census Bureau — Decennial Census: 2010 and 2020 population counts used for the county-change map.
Green Map creates custom-edited map images using open geographic data sources such as geoBoundaries, Natural Earth, OpenStreetMap, and government open data. These maps are edited visual materials, not raw data files, and are provided for education, documents, presentations, and graphic reference.