Idaho is sparsely populated at the statewide scale, but its population is concentrated in a small number of distinct urban clusters. The 2024 ACS five-year estimate places the state population at 1,934,262. Ada County alone has 518,935 residents and the state’s highest countywide density at about 493 people per square mile. The Boise area dominates the southwest, while other concentrations occur around Coeur d’Alene and Post Falls in the north, Idaho Falls in the east, Pocatello in the southeast, and Twin Falls in the south-central part of the state. The 2010–2020 Census comparison also shows why current size and growth rate are different measures: Madison County, not Ada, had the fastest percentage increase.
The analysis below relies on ACS and decennial Census values supplied with the article. The five site-owned graphics remain available as optional reference material; no factual claim in the text depends on interpreting image color, symbol size, or shape.
Table of Contents
Start with the measures that answer different questions
| Measure | Value in the supplied material | What it means |
|---|---|---|
| 2024 state population | 1,934,262 | ACS 2024 five-year estimate |
| Average state density | About 23 people per sq mi | Average across 82,645 sq mi of land |
| Largest county population | Ada — 518,935 | Total residents, not density |
| Highest county density | Ada — about 493 people per sq mi | Residents per unit of land |
| Fastest 2010–2020 growth | Madison — +41.0% | Decennial Census percentage change |
| Largest 2010–2020 decline | Clark — -19.6% | Change over the decade |
County population measures the number of residents, county density measures people per square mile, and the 2010–2020 series measures percentage change between two decennial censuses. The current population and density figures use 2024 ACS estimates, so they should not be treated as the same time series as the 2010–2020 change values. This distinction matters in Idaho because some geographically large counties contain relatively few residents, while smaller urban counties hold much larger populations.
Tract density is concentrated in southwest Idaho
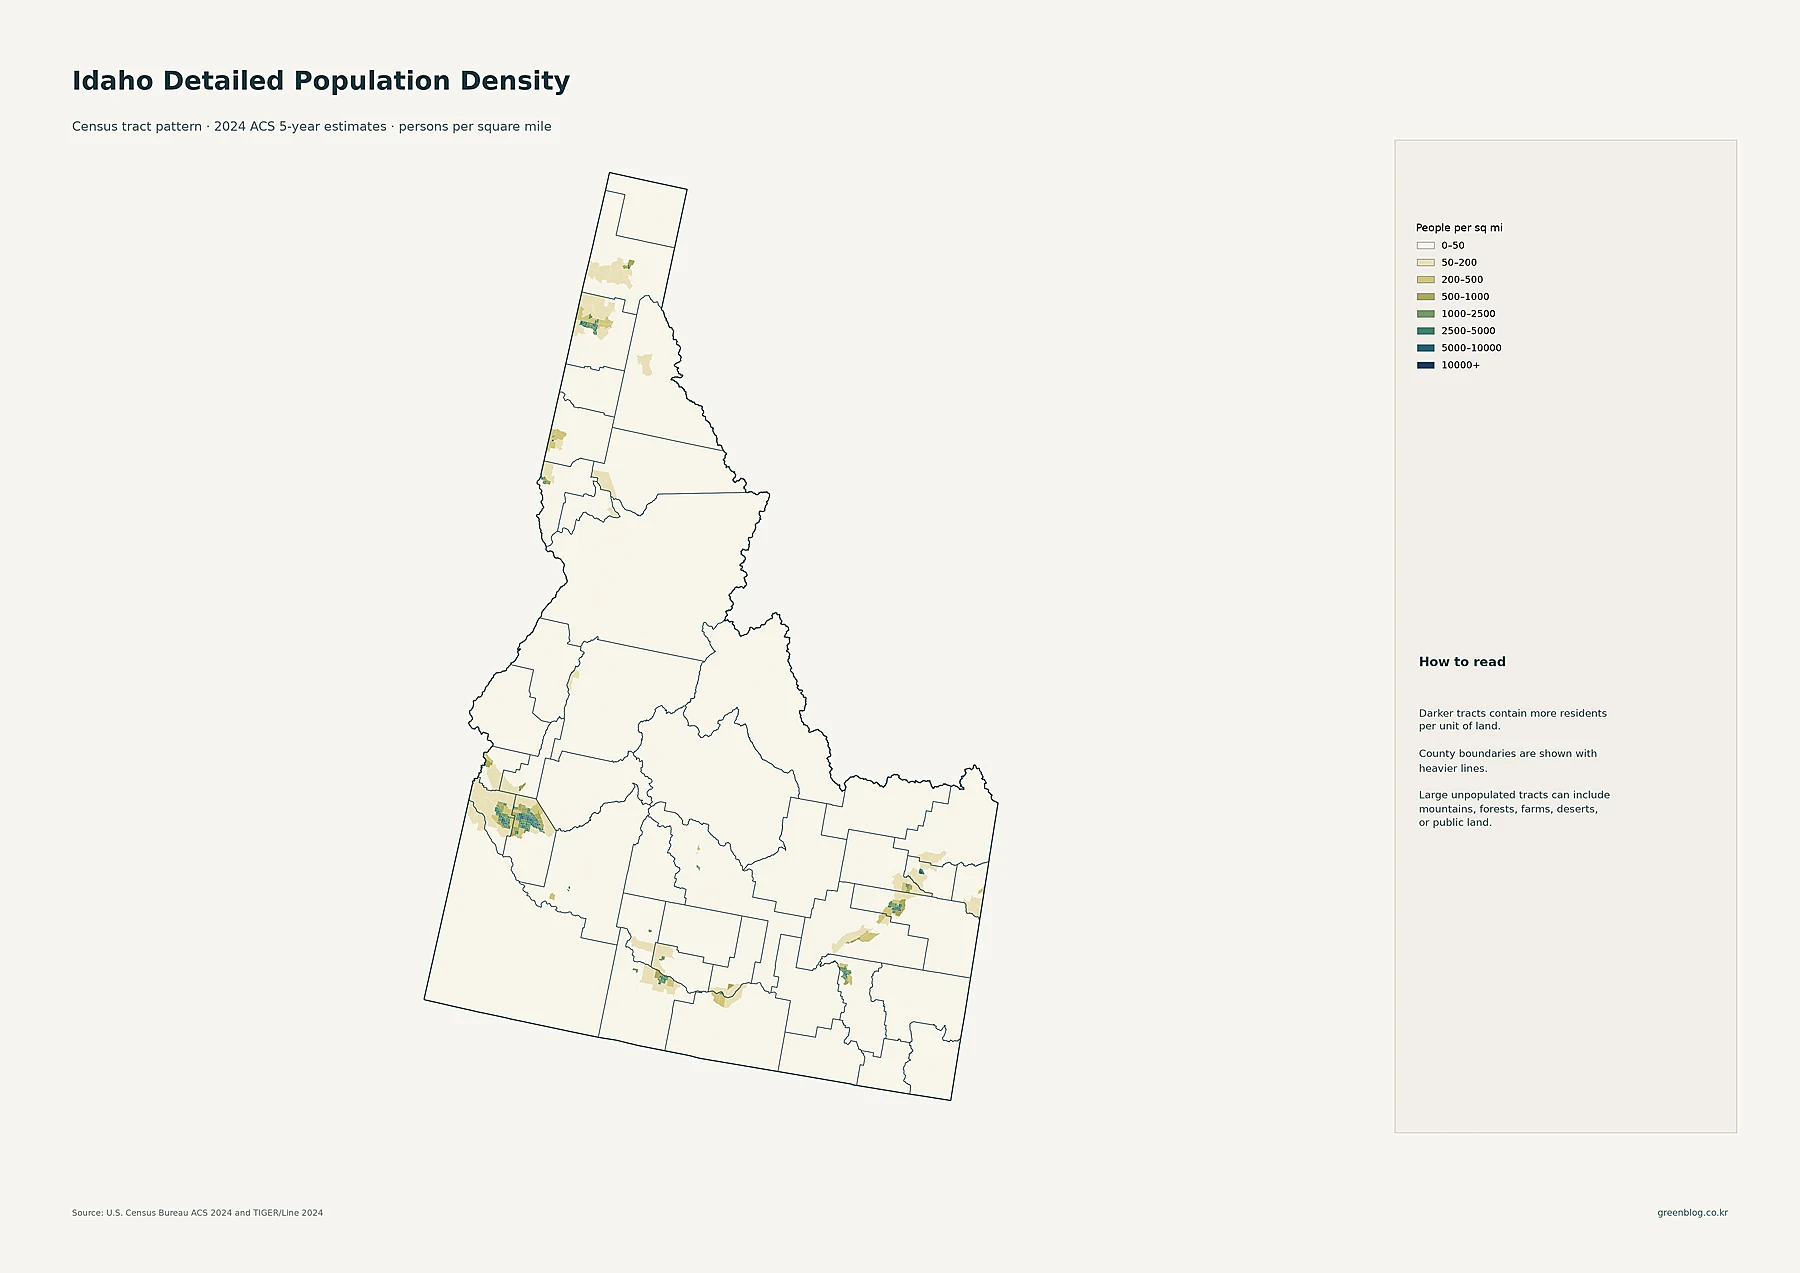
The tract-density data are grouped from 0–50 people per square mile through 50–200, 200–500, 500–1,000, 1,000–2,500, 2,500–5,000, 5,000–10,000, and 10,000 or more. The broadest high-density concentration is in southwest Idaho around the Boise-area counties, where several adjoining tracts have much higher density than most of the state’s interior.
Other dense clusters are smaller but still distinct. The northern panhandle has concentrations around Coeur d’Alene and Post Falls, with additional higher-density areas near Moscow and Lewiston farther south. Eastern Idaho has a concentration around Idaho Falls and Ammon, while Pocatello and Chubbuck stand out in the southeast and Twin Falls in the south-central region. Large parts of central Idaho remain sparsely populated. Low tract density can coincide with mountains, forests, deserts, or public land, but density alone does not establish why a place is sparsely settled.
Major census places show how several cities combine around Boise
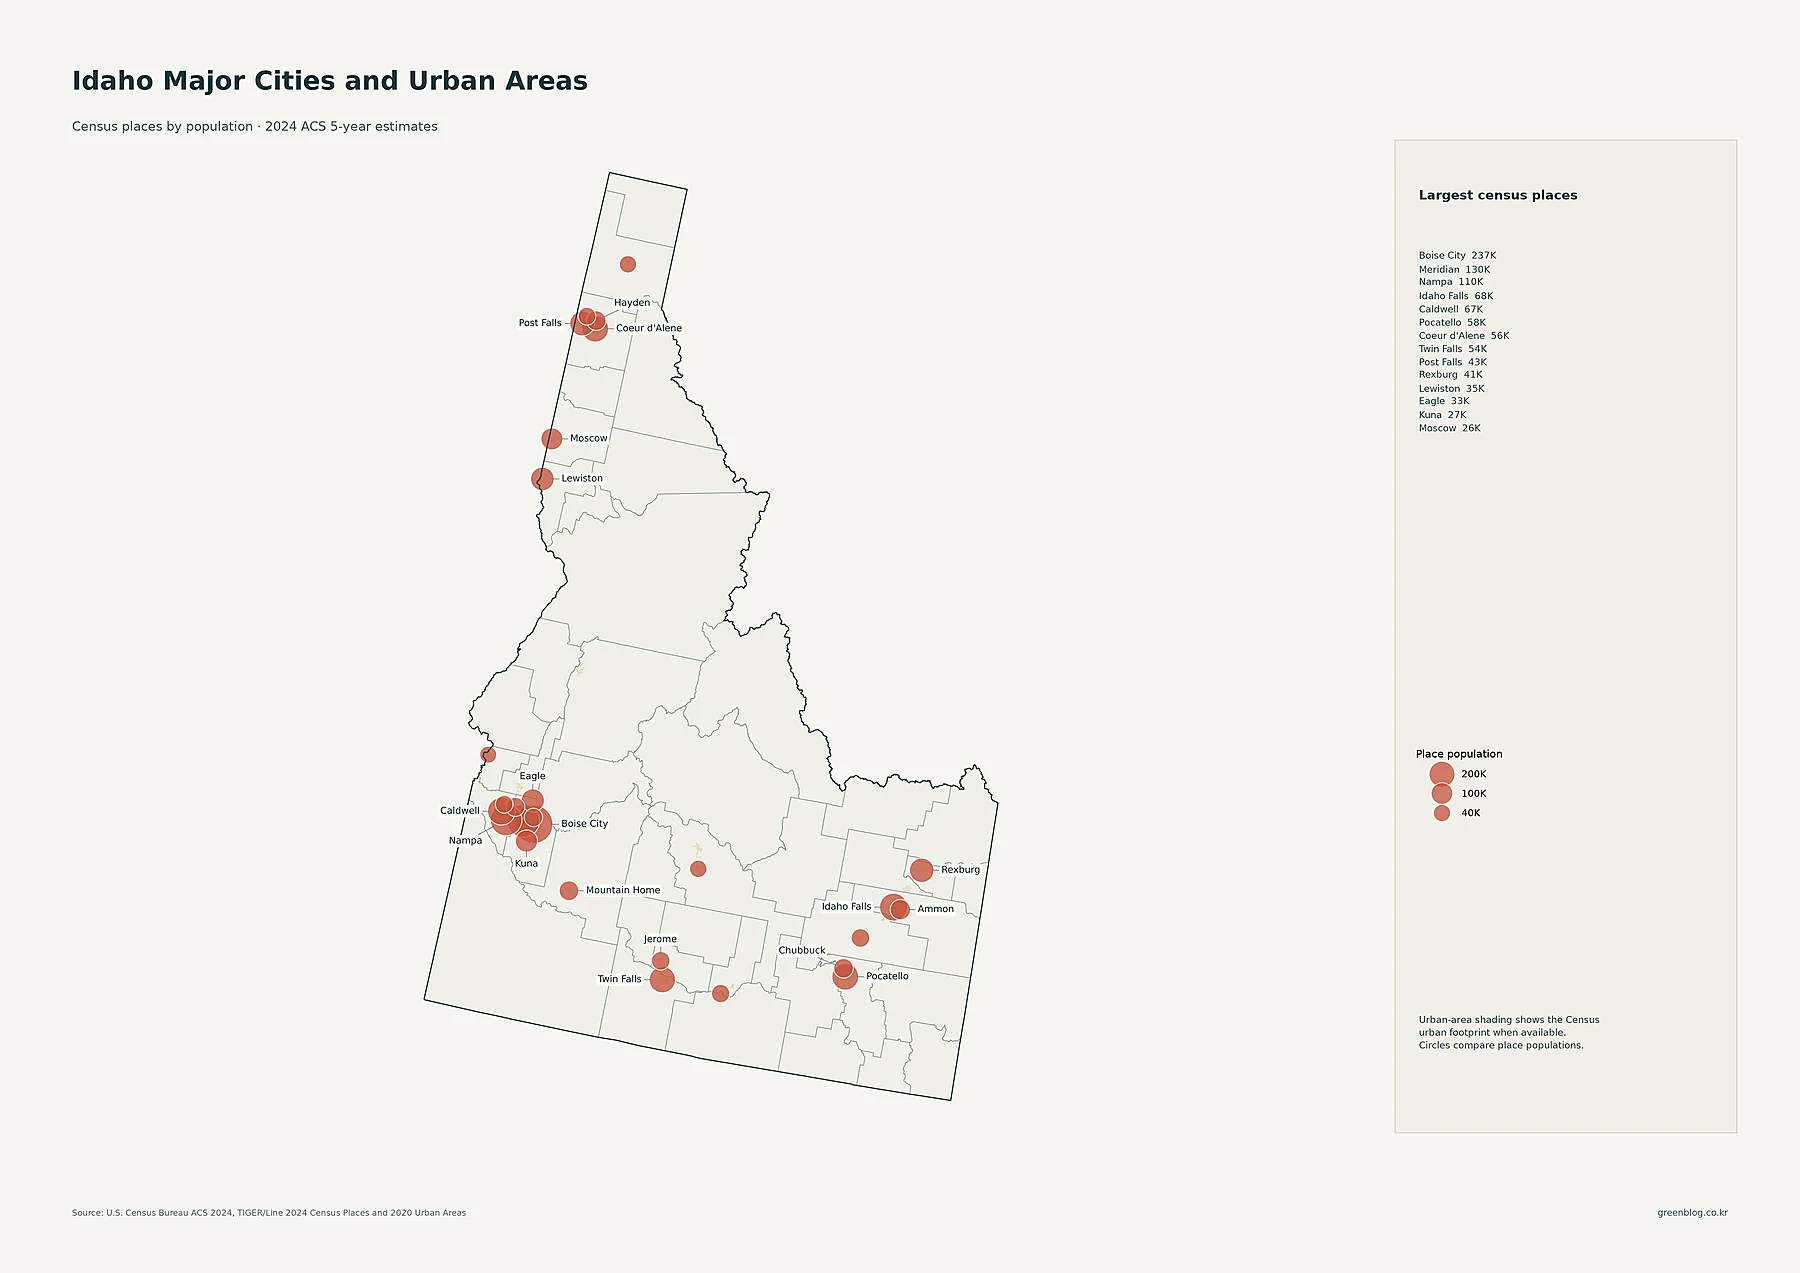
Boise City is the largest census place in the supplied data at 237,242 residents. Meridian follows at 130,138 and Nampa at 110,319. Idaho Falls has 67,725 residents, Caldwell 66,516, Pocatello 57,635, Coeur d’Alene 56,447, and Twin Falls 54,164. The next group includes Post Falls at 43,391, Rexburg at 40,543, Lewiston at 34,651, Eagle at 32,855, Kuna at 27,158, and Moscow at 26,286.
The spatial relationship among census places matters as much as their ranking. Boise is near several of the state’s other large places, including Meridian, Nampa, Caldwell, Eagle, and Kuna. Coeur d’Alene, Post Falls, and Hayden form another northern cluster. Idaho Falls and Ammon form an eastern pair, while Pocatello and Chubbuck form another pair in the southeast. These are census-place population comparisons, not density measurements.
Ada and Canyon dominate county population totals
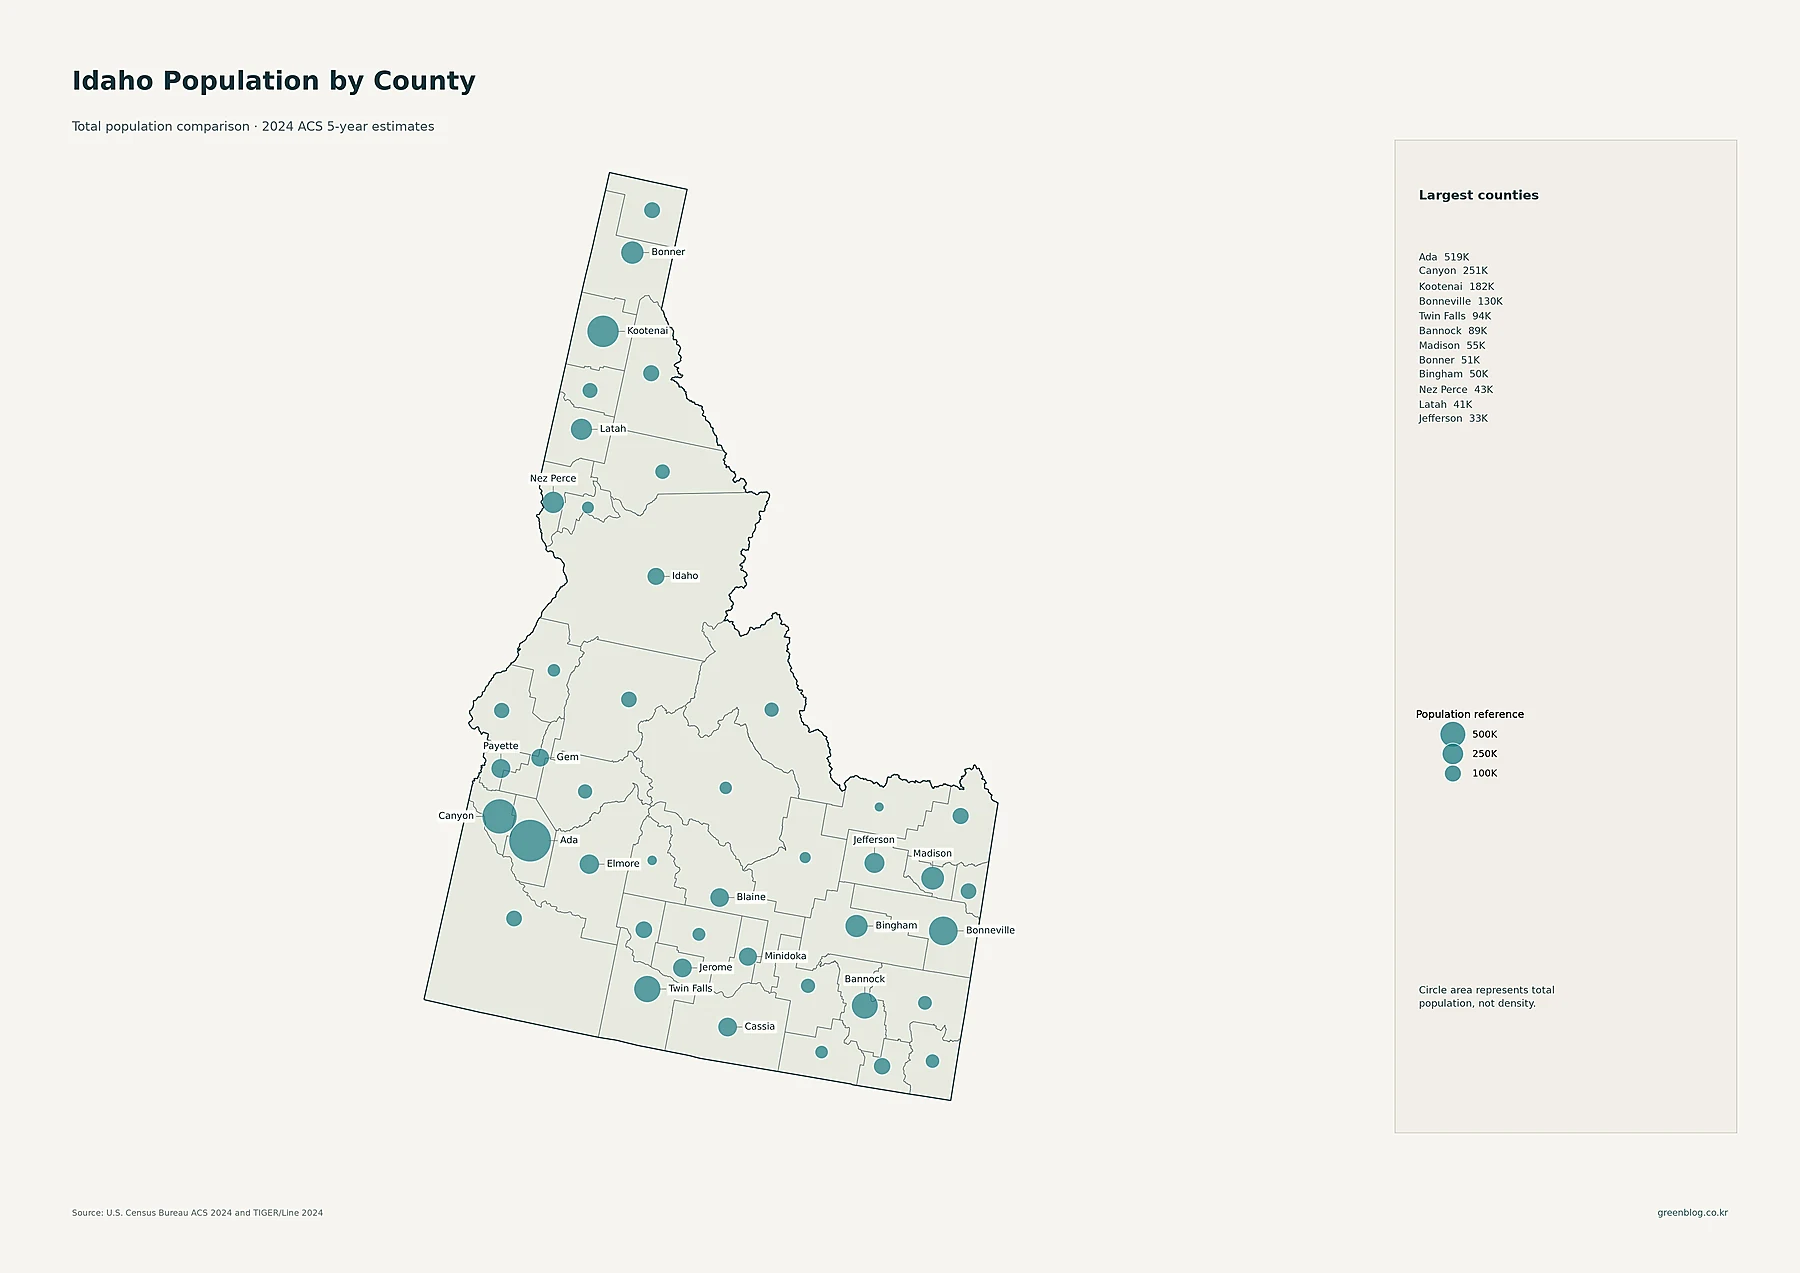
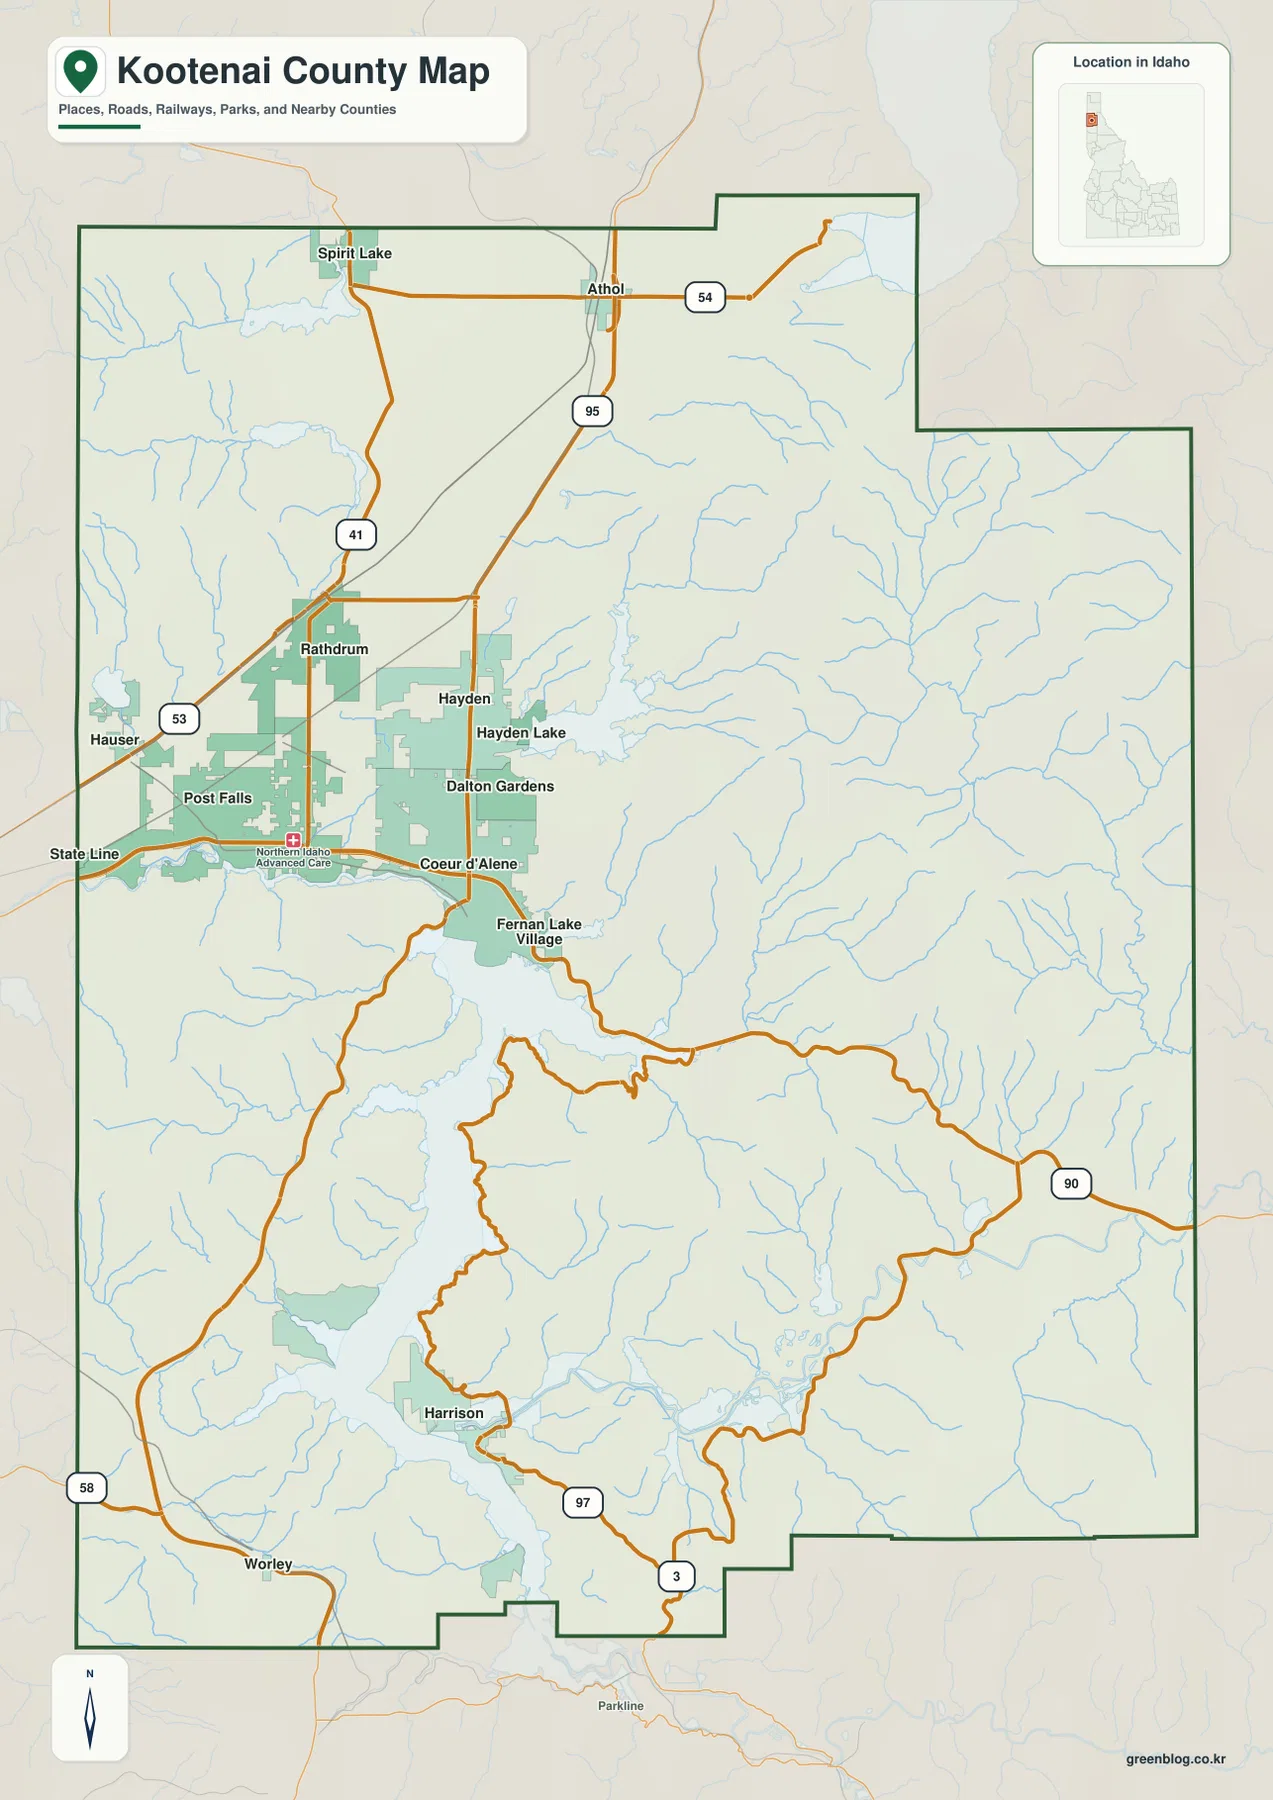
Ada County has 518,935 residents, making it the largest county population in the supplied 2024 estimate. Canyon County is second at 250,790, followed by Kootenai at 181,996 and Bonneville at 129,523. Twin Falls County has 93,734 residents, Bannock 89,454, Madison 54,618, Bonner 51,049, Bingham 49,664, Nez Perce 42,697, and Latah 41,049. The ranking reinforces the importance of southwest Idaho while also showing substantial county populations in the northern panhandle and eastern Idaho.
Physical county size should not be confused with population size. Idaho County covers a very large area but has only 17,432 residents in the supplied 2024 estimate. Custer County has 4,470 and Lemhi County 8,249. A county can therefore be geographically large while containing relatively few residents; population totals and density must be evaluated separately.
County density exposes an extreme gap between urban counties and the interior
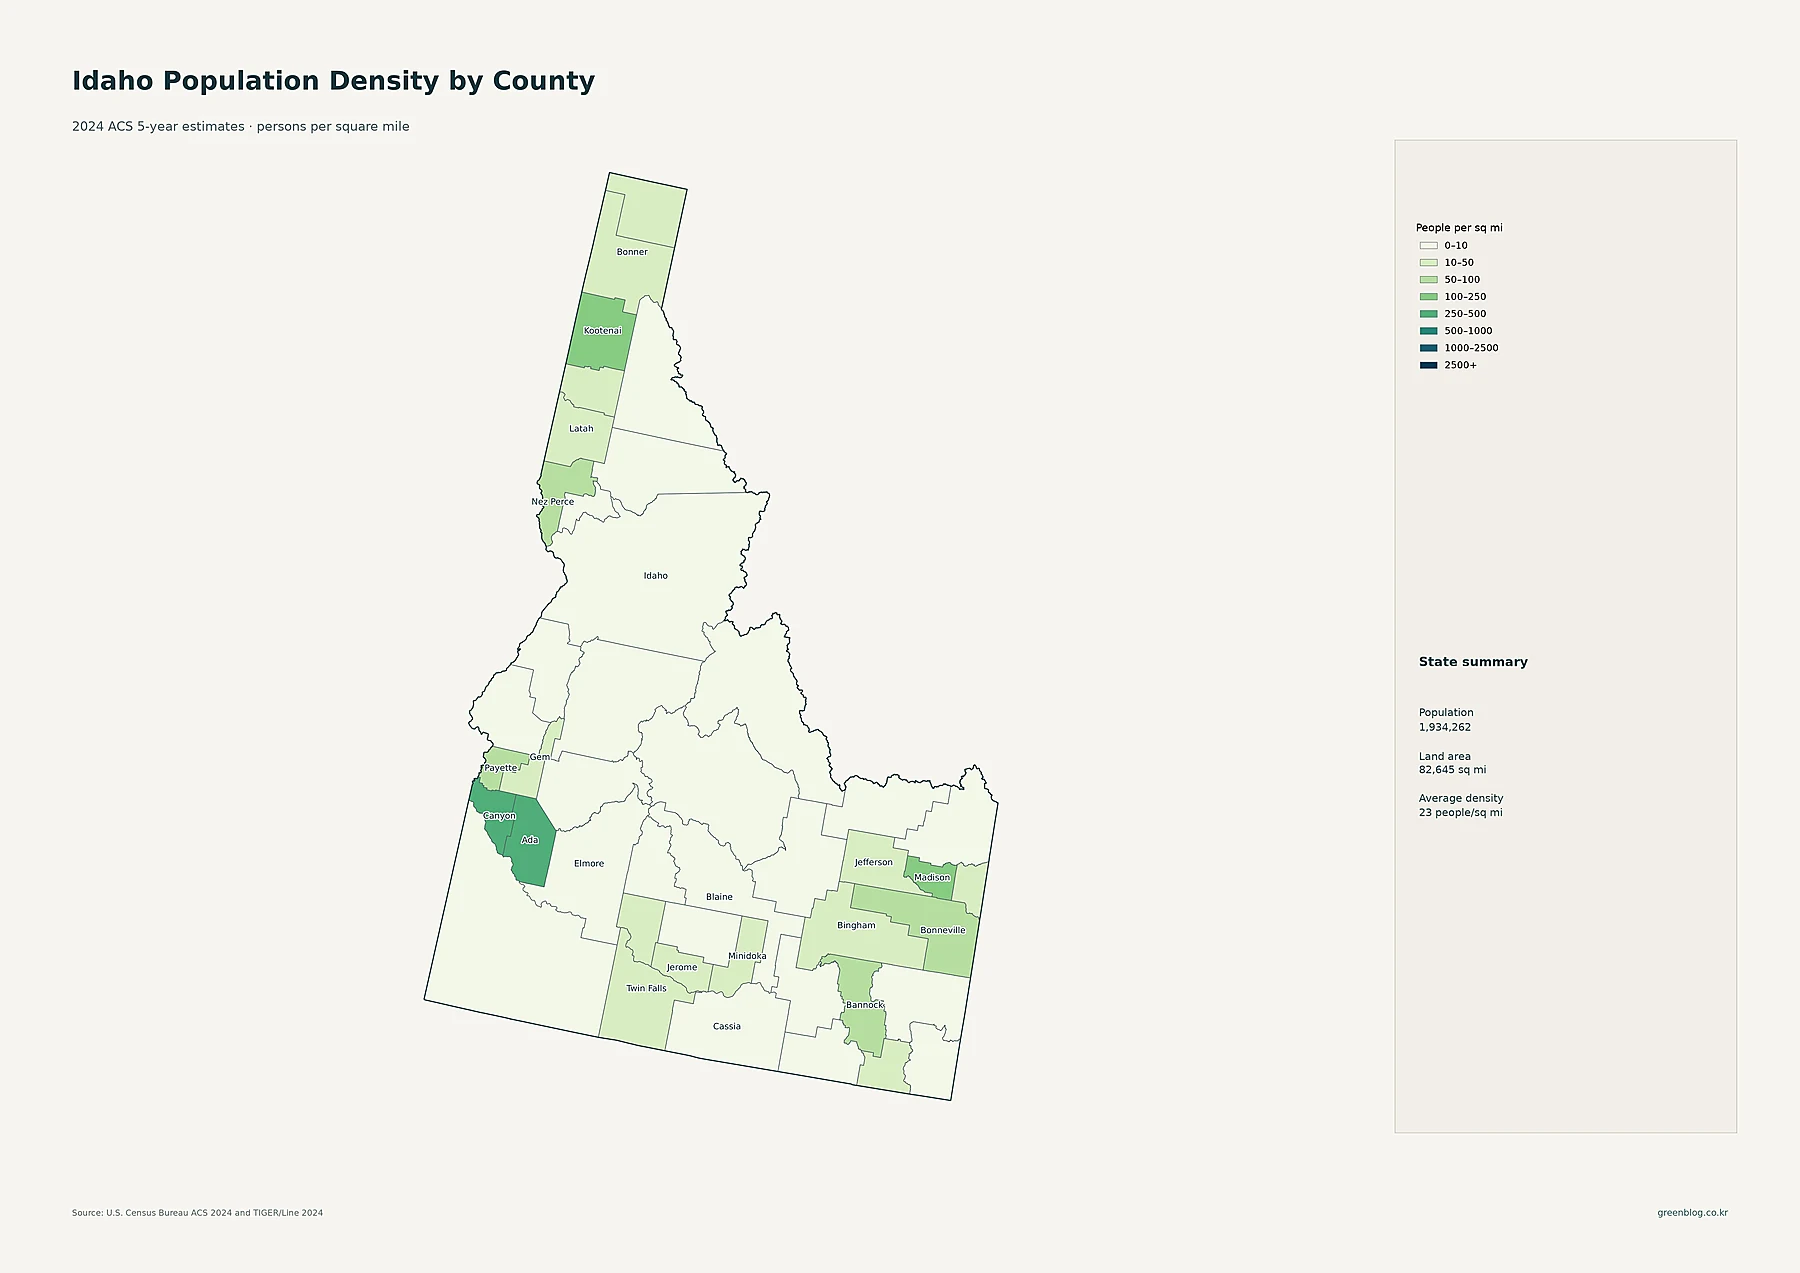
Ada County has the highest county-average density at about 493 people per square mile, and Canyon follows at about 427. Kootenai is roughly 147, Madison 116, Bannock 80, Bonneville 69, and Payette 66. Nez Perce is about 50 and Twin Falls about 49. These figures show that several of the largest urban counties are also much more densely settled than the statewide average.
The supplied state summary reports 1,934,262 residents, 82,645 square miles of land, and an average density of about 23 people per square mile. That single average hides very large county differences. Clark County is only about 0.48 person per square mile, Custer about 0.91, Camas about 1.05, and Idaho County about 2.06. Ada’s countywide density is therefore hundreds of times higher than the sparsest counties. Idaho is better described as a state with broad low-density areas and a handful of distinctly dense urban counties than by one statewide average.
Madison led 2010–2020 growth while Clark lost nearly one-fifth of its population
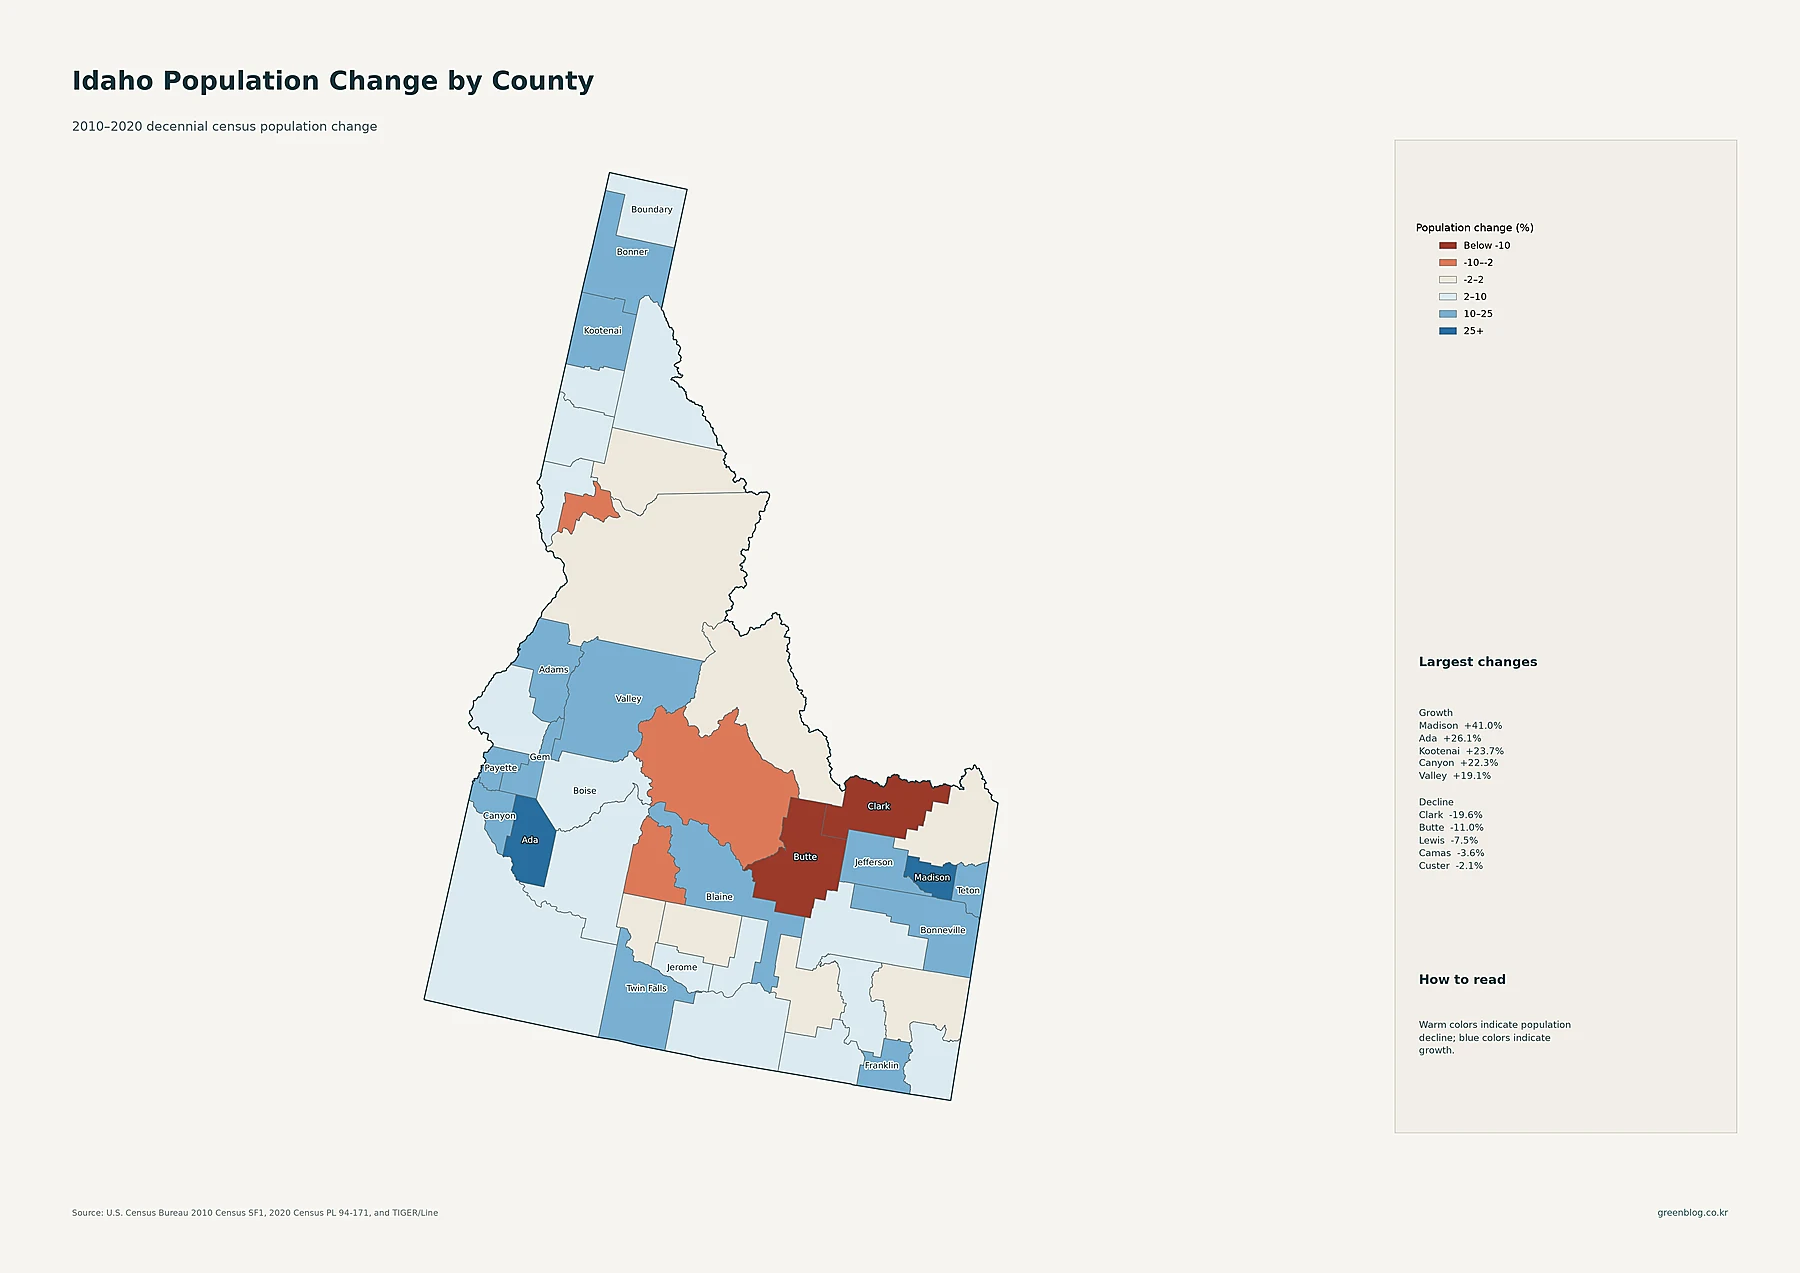
The 2010–2020 series uses decennial Census counts rather than the 2024 ACS estimates. Madison County increased from 37,536 residents in 2010 to 52,913 in 2020, a gain of about 41.0%, the largest percentage increase in the supplied county data. Ada grew from 392,365 to 494,967, or about 26.1%. Kootenai rose 23.7%, Canyon 22.3%, Valley 19.1%, Bonneville 18.9%, Jefferson 18.2%, and Twin Falls 16.6%.
Several counties moved in the opposite direction. Clark County fell from 982 residents to 790, a decline of about 19.6%. Butte declined 11.0%, Lewis 7.5%, Camas 3.6%, Custer 2.1%, Lincoln 1.6%, and Clearwater about 0.3%. The comparison is a reminder that percentage growth is not the same as current population rank. Ada is the largest county in the 2024 estimate, but Madison recorded the fastest 2010–2020 growth rate. A smaller county can change rapidly in percentage terms without becoming the state’s largest population center.
What becomes clear when the five views are read together
The strongest recurring signal is southwest Idaho. Boise is the state’s largest census place, several other large cities are nearby, and Ada County ranks first in both total population and county density. Canyon County ranks second in total population and second in density. Tract-level density values also identify southwest Idaho as the state’s broadest high-density concentration, so several independent measures point to the same part of the state.
The rest of Idaho is more varied than a simple Boise-versus-rural split. Kootenai County has 181,996 residents, density around 147 people per square mile, and 2010–2020 growth of 23.7%. Madison County has only 54,618 residents in the 2024 estimate but posted the state’s fastest decade growth at 41.0%. Bonneville County combines 129,523 residents with density around 69 and growth of 18.9%. Comparing totals, density, census-place populations, and historical change keeps those differences visible without collapsing them into one ranking.
Download and use the Idaho population map set
For analysis, use tract-density values for fine-grained settlement concentration, county totals for the number of residents, county density for people per square mile, and census-place totals for named population centers. Use the 2010–2020 Census series for historical change and keep it separate from the 2024 ACS estimates used for current population and density.
Idaho population map collection
The ZIP package contains high-resolution JPG versions of the population maps shown above.
FAQ
Which Idaho county has the highest population density?
Ada County is highest in the supplied 2024 ACS five-year data at about 493 people per square mile. Canyon County is next at about 427, followed by Kootenai at about 147.
Which Idaho county has the largest population?
Ada County is the largest at 518,935 residents in the supplied 2024 ACS estimate. Canyon County has 250,790 and Kootenai County 181,996. Total population and population density are separate measures even though Ada ranks first in both here.
Which Idaho county grew fastest from 2010 to 2020?
Madison County had the largest percentage increase at about +41.0%. Ada grew about +26.1%, Kootenai +23.7%, and Canyon +22.3%. Clark County had the largest decline at about -19.6%.
Related Maps
Official data sources
- U.S. Census Bureau — American Community Survey (ACS): source framework for the 2024 five-year population and density estimates.
- U.S. Census Bureau — TIGER/Line Shapefiles: geographic boundaries for counties, census tracts, census places, and related mapping.
- U.S. Census Bureau — Decennial Census: basis for the 2010 and 2020 county population-change comparison.
Green Map creates custom-edited map images using open geographic data sources such as geoBoundaries, Natural Earth, OpenStreetMap, and government open data. These maps are edited visual materials, not raw data files, and are provided for education, documents, presentations, and graphic reference.