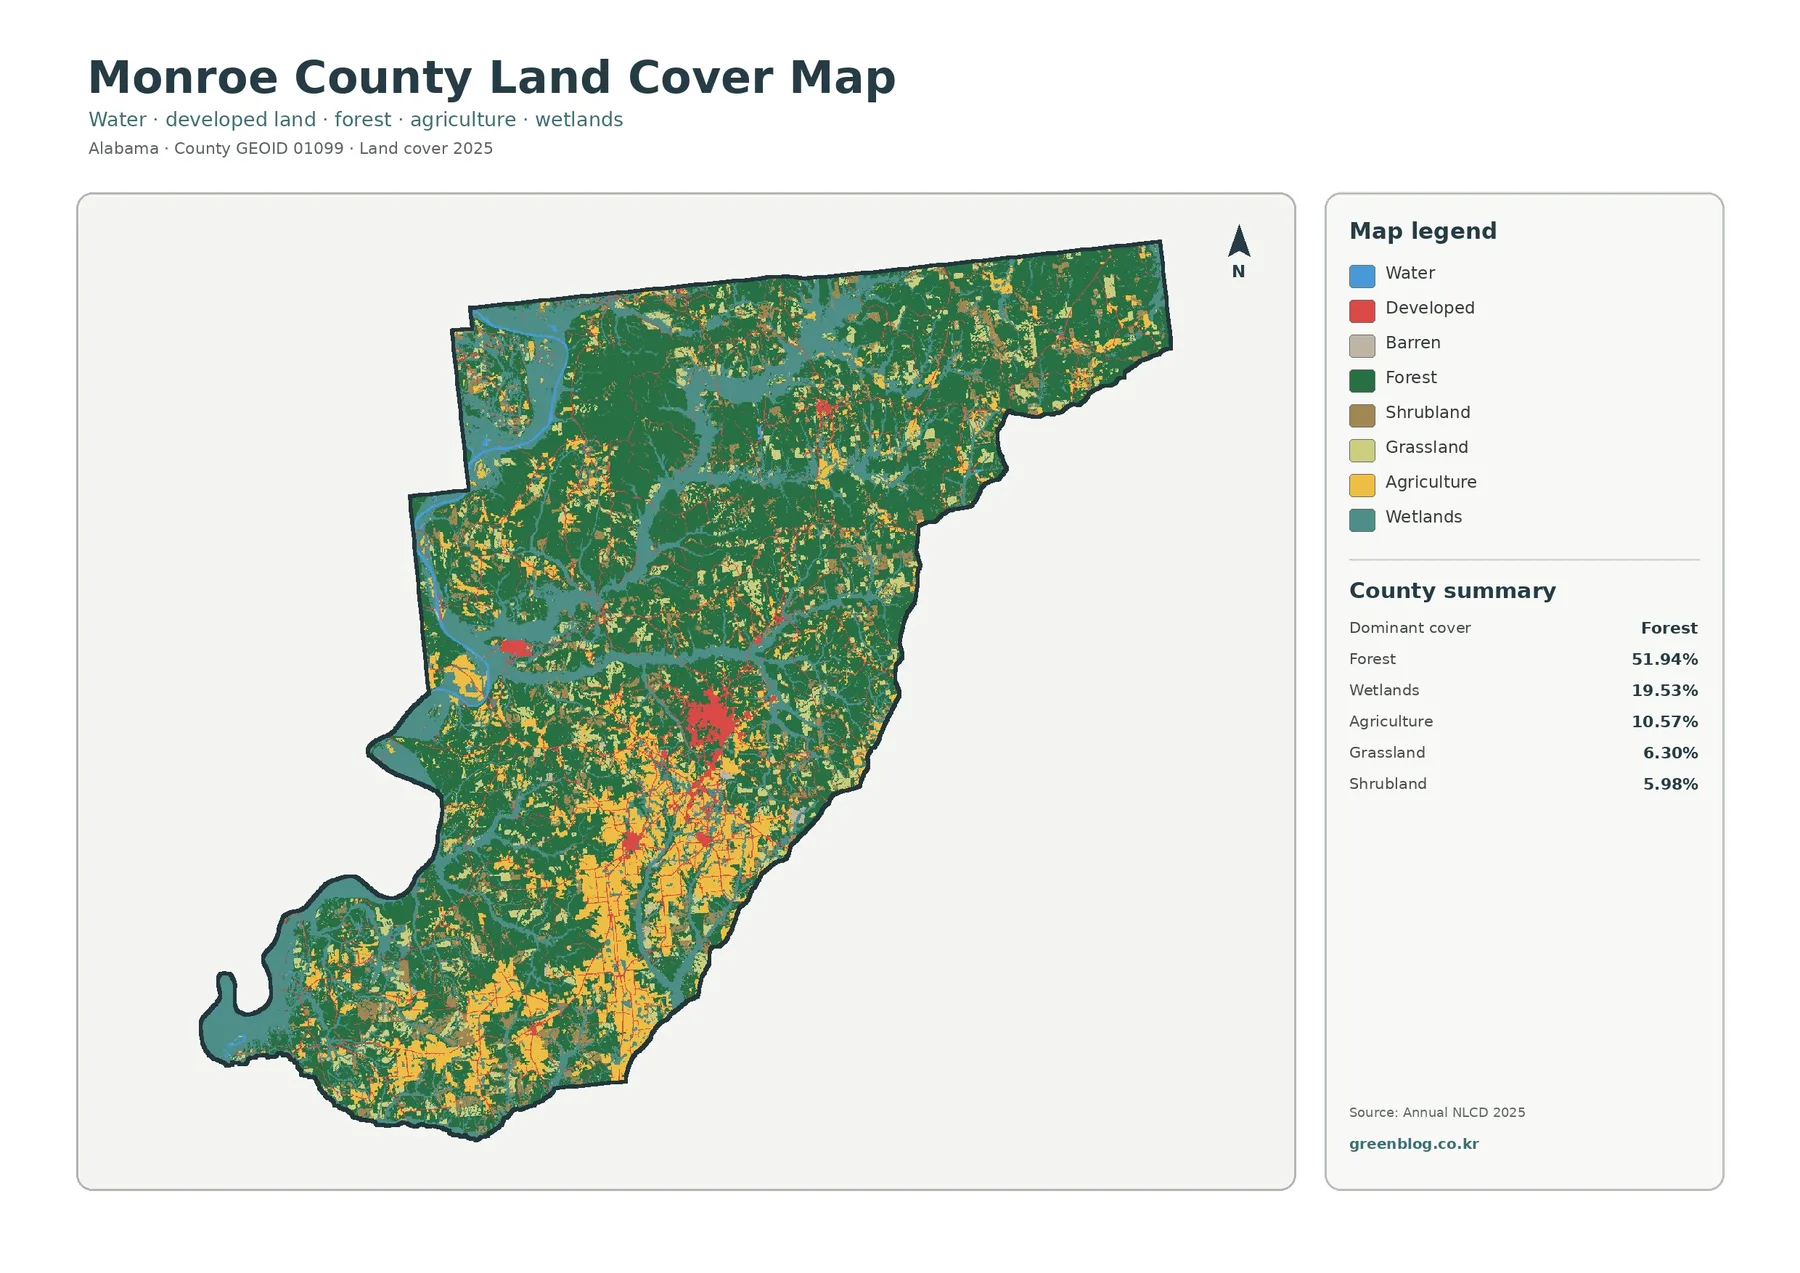
The Monroe County Alabama Land Cover Map presents a county where forest is the dominant surface but wetlands remain a major part of the landscape. In the 2025 summary, forest accounts for 51.94% of Monroe County and wetlands for 19.53%. Agriculture makes up 10.57%, while grassland and shrubland add smaller open areas between wooded tracts. The map also reveals a modest developed footprint centered most clearly around the county’s principal town rather than a broad urban blanket across the county.
Four related views are used on this page: general land cover, forest and farmland, impervious surface and developed land, and a 1985–2025 class-difference map. The original 2480 × 1754 JPG for each view is available together in one ZIP below. They are useful for county-scale reference, classroom work, environmental context, and presentation graphics, but they are not parcel maps, zoning maps, surveys, or real-time records of current ground conditions.
Table of Contents
Forest Comes First, but Open Land Changes the Southern Half
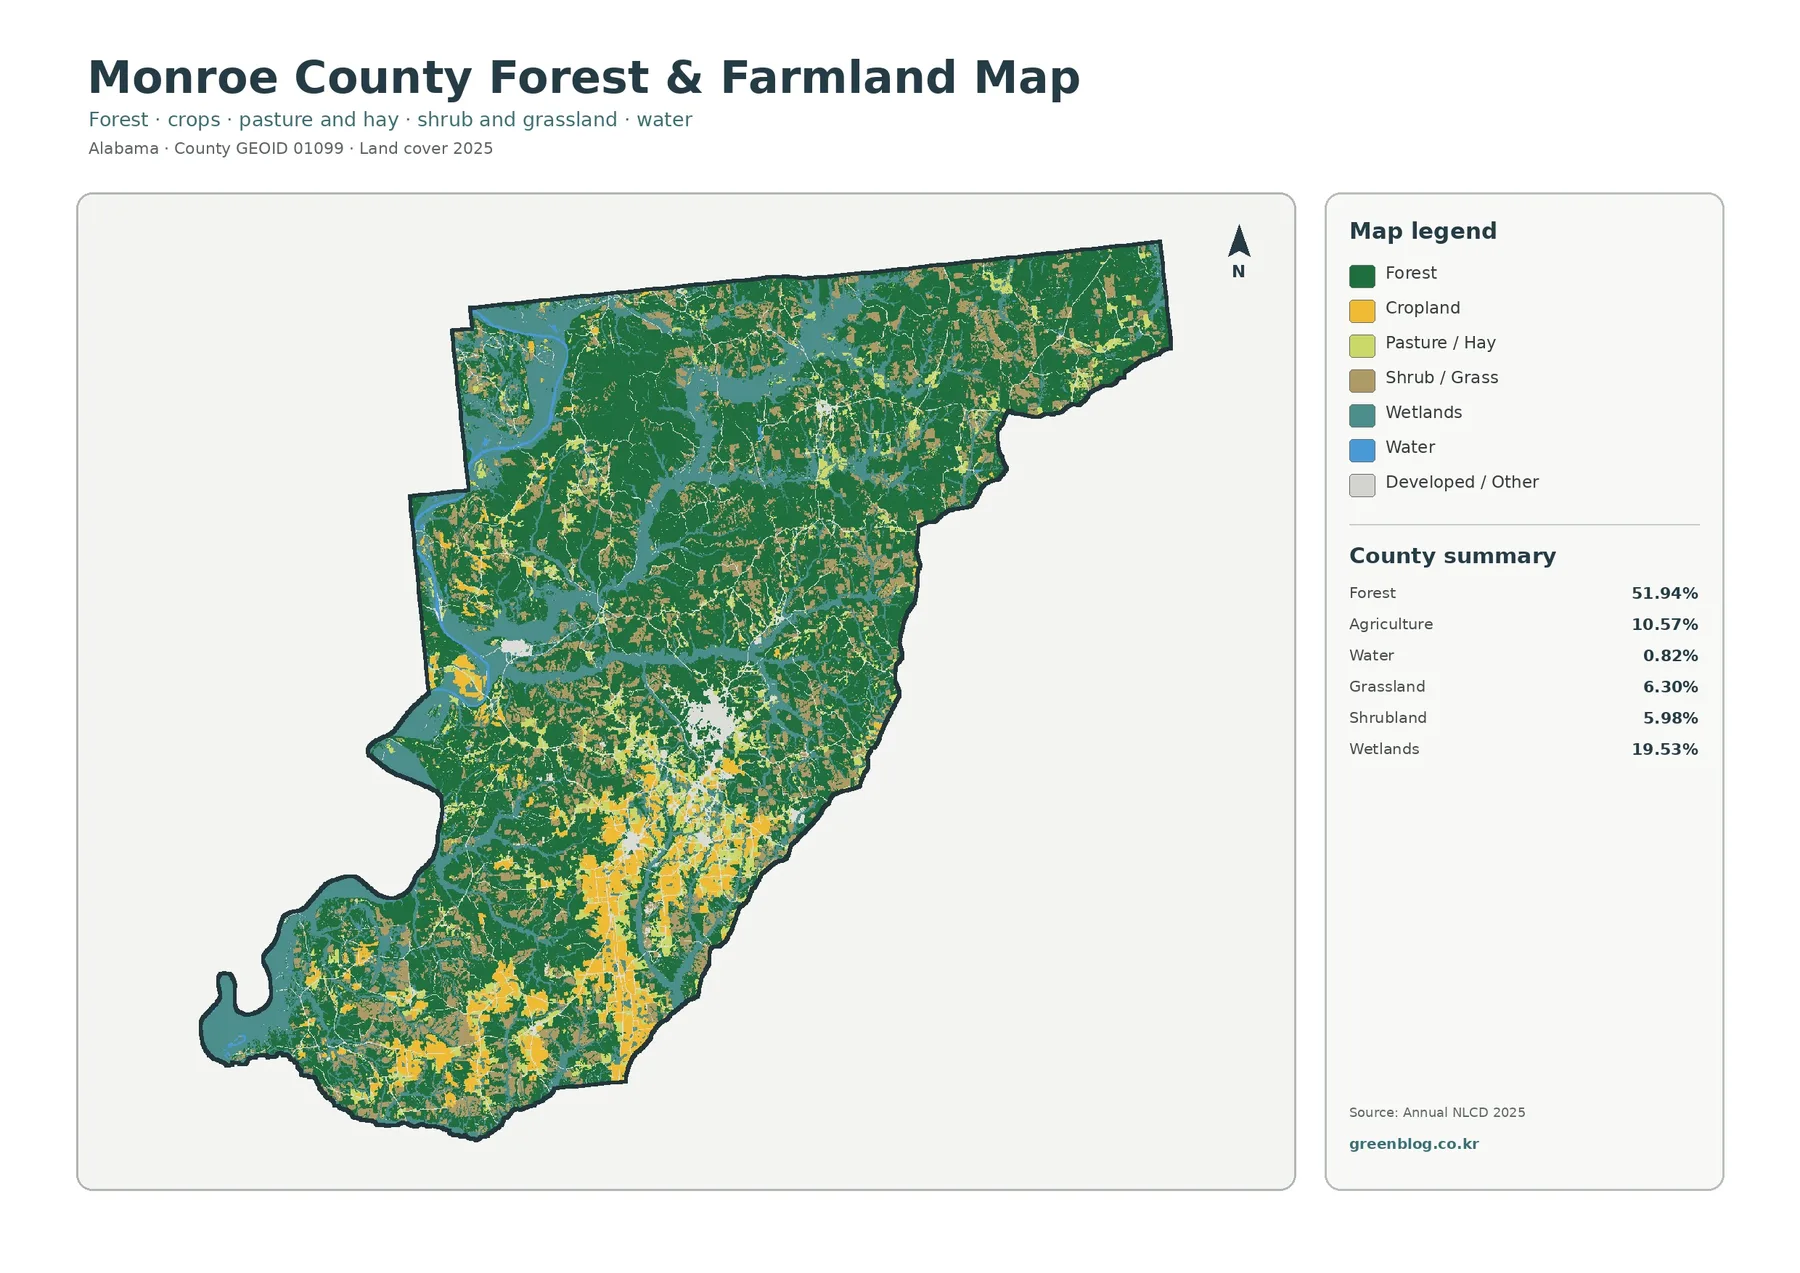
Dark green covers much of the northern and northeastern part of the county and continues through broad blocks in the interior. That 51.94% forest share gives Monroe County a strong wooded character at county scale. The value is useful as a starting point, but the spatial arrangement matters just as much: agricultural and open vegetation classes are more frequent in the southern half, while wetland colors weave through both forested and more open areas.
The 2025 summary lists agriculture at 10.57%, grassland at 6.30%, and shrubland at 5.98%. These classes should not be collapsed into a single “farm” category. Agriculture represents mapped agricultural cover, while grass and shrub classes can include other kinds of low or open vegetation. On the forest-and-farmland view, the yellow agricultural patches become easier to identify because the visual competition from developed land and minor classes is reduced.
A broad band of agricultural cover appears more frequently in the south and southeast, with additional patches extending into the central part of the county. This does not overturn the countywide dominance of forest. Instead, it illustrates why a single percentage can hide local differences: a county can be more than half forest overall while individual southern areas contain a much stronger agricultural presence than the county average suggests.
Alabama Cooperative Extension maintains a Monroe County office and lists agronomic crops, farm and agribusiness management, forestry, wildlife, and natural resources among the areas serving the county. That source helps establish local agricultural and forestry context without assigning a particular mapped pixel to a farm or forestry operation. The map classification remains a surface description, not a record of who owns a tract or how it is managed.
Wetlands Follow the Western River Setting and Interior Drainage
Wetlands account for 19.53% of the 2025 land-cover summary, making them the second-largest mapped class. Along the western side, wetland and water colors occupy a wider, more irregular corridor. Farther inland, the same wetland color narrows into branching paths and smaller pockets. That contrast makes it easier to distinguish a major river-edge environment from the thinner drainage features that extend through the county.
The Encyclopedia of Alabama identifies the Alabama River as a major waterway along Monroe County’s western border and notes that tributaries fan across the county. That geographic description matches the general arrangement visible in the supplied land-cover map, although the map itself does not label individual streams. A teal band should therefore be described as mapped wetland unless a separate reference confirms the name and boundary of a specific water feature.
Open water represents 0.82% of the summary, far less than the wetland share. Blue water cells and teal wetland cells often sit close together in the western part of the county, but they mean different things. Open water identifies water surfaces, whereas wetland classification can include vegetation and saturated ground. Treating every wetland cell as open water would substantially misstate what the land-cover product is showing.
This distinction is useful for watershed lessons and environmental presentations. A reader can compare where water surfaces are visible with where wet conditions and wetland vegetation occupy a broader area. It is not appropriate, however, to use the land-cover boundary as a regulatory wetland determination. Legal wetland boundaries, permitting questions, and field conditions require the relevant agency data and site-specific work.
The General Map Puts Forest, Wetlands, Farms, and Development in One Frame
The general land-cover view is the best place to understand the county before focusing on any one category. Forest is widespread, wetlands follow the western edge and interior drainage, agricultural patches become more common in the south, and developed land appears as a comparatively small set of red clusters. The same image also retains grassland, shrubland, water, and barren classes where they occur, so it works well as an orientation map rather than a specialized analysis of one surface type.
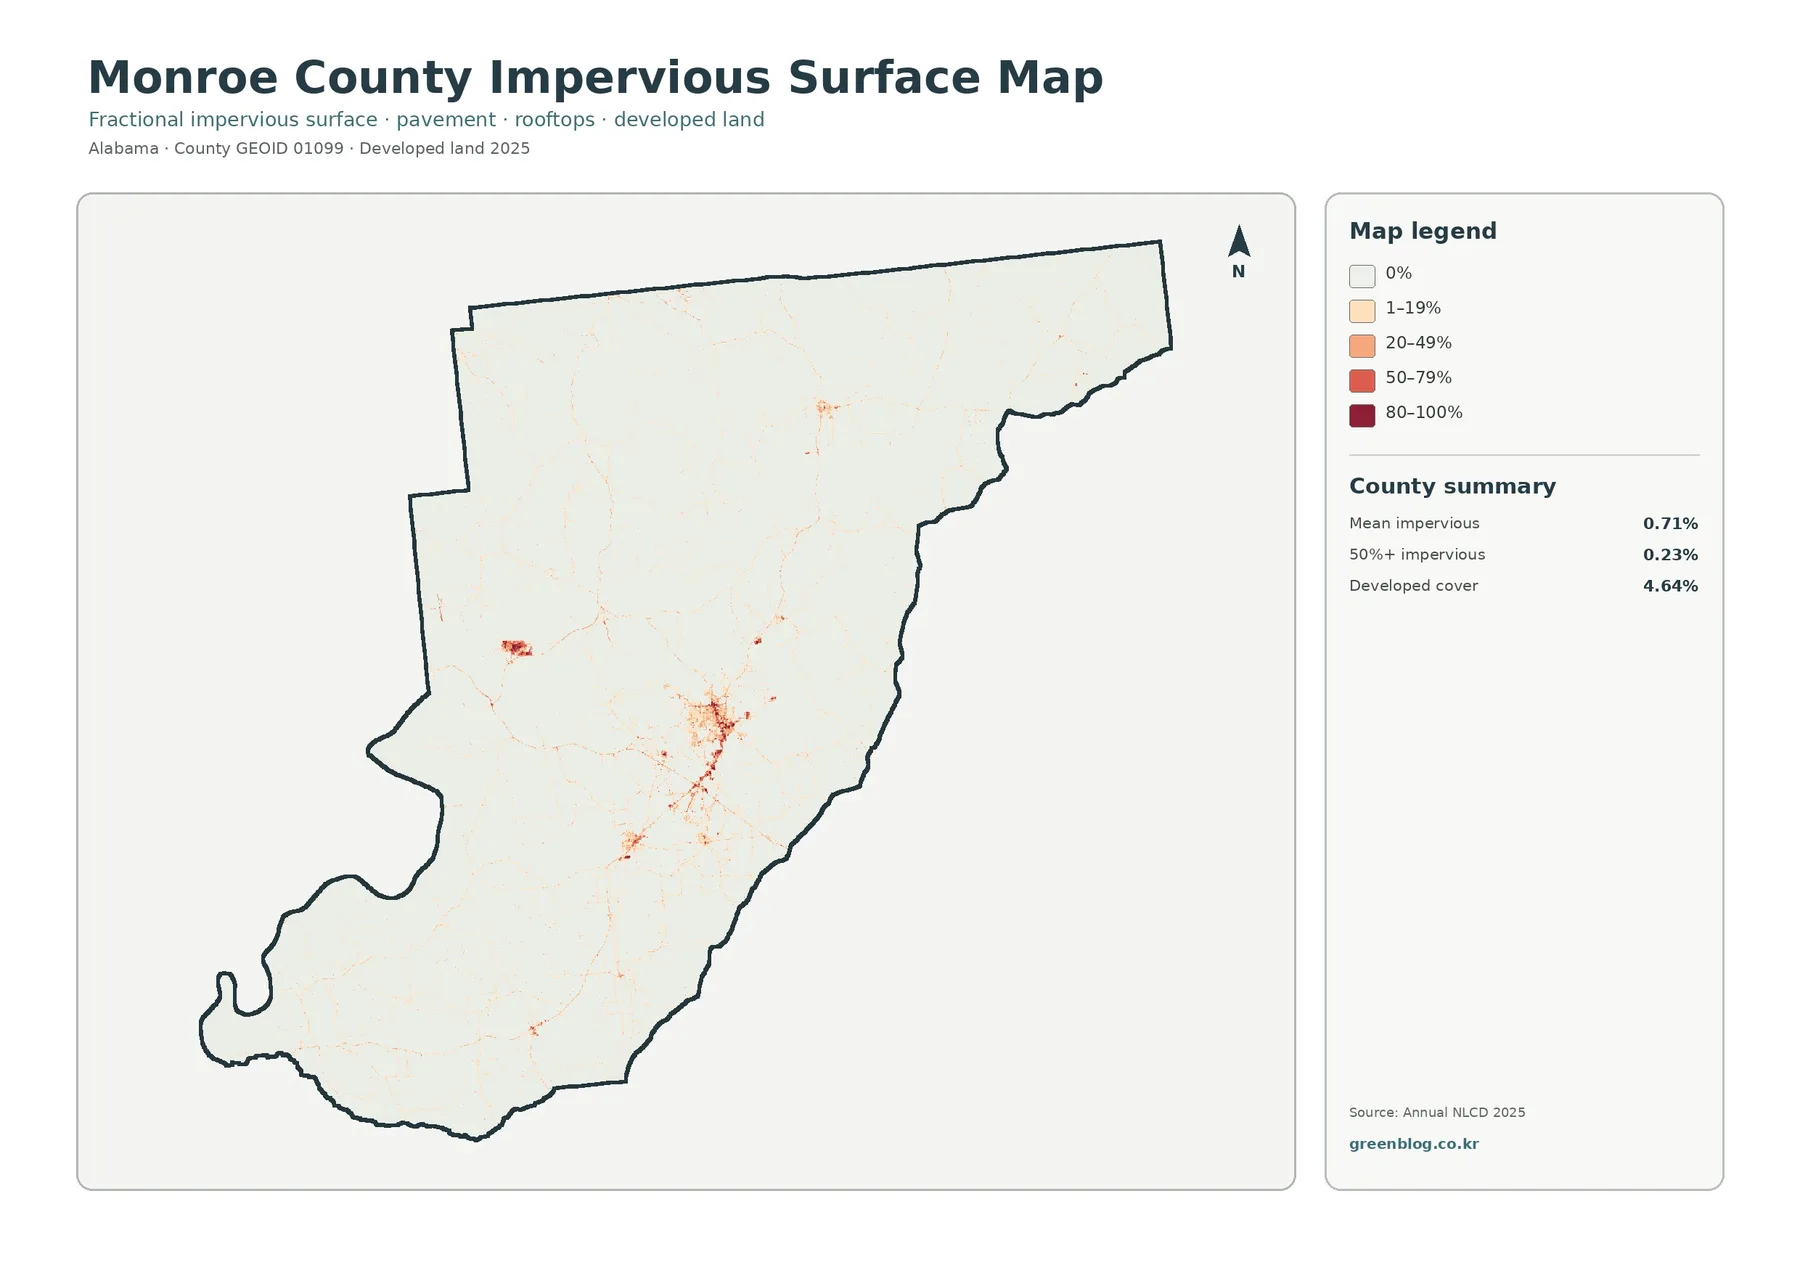
Developed cover is listed at 4.64% on the impervious/developed product. The largest developed cluster on the supplied map sits in the central-southern part of the county. County reference sources identify Monroeville as the county seat and largest city, and its mapped position aligns with that strongest cluster. Smaller developed patches are scattered elsewhere, including around other community areas, but the supplied image does not label them individually.
This is also a good point to separate land cover from land use. A developed class means the surface has characteristics associated with developed land in the Annual NLCD classification. It does not say whether the location is residential, commercial, industrial, public, or privately owned, and it does not provide a zoning designation. Likewise, a forest class does not identify a protected forest or timber tract, and an agricultural class does not identify a legal farm parcel.
A Small Developed Share Produces an Even Smaller Impervious Average
Impervious surface is a different measurement from developed land. It estimates surfaces such as rooftops, pavement, and parking areas that do not readily absorb water. Monroe County’s mean impervious value is 0.71%, and only 0.23% of the county is mapped at 50% or more impervious. Those values are much lower than the 4.64% developed-cover figure because developed areas can contain lawns, trees, soil, drainage space, and other permeable surfaces.
The impervious map is mostly pale, which reflects the county’s low average. The strongest colors form a compact cluster in the Monroeville area and a few much smaller points and thin traces elsewhere. Around the main cluster, lower impervious classes spread beyond the darkest center. That pattern is useful when explaining the difference between a built-up center and lower-density developed surroundings without pretending that every developed cell has the same amount of pavement.
Linear marks may resemble roads, but this product should not be treated as a transportation map. The colors represent fractional impervious surface within raster cells, not named road centerlines or exact pavement boundaries. A thin high-value feature can help a reader understand where hard surfaces are concentrated, yet route identification and engineering work still require a road dataset or local mapping source.
The same caution applies to runoff or flood interpretation. Impervious surface can be relevant to drainage, but the map does not include elevation, storm intensity, culverts, soil infiltration, flood zones, or river stage. A high impervious value is therefore not a flood-risk rating. The safest use is to compare the relative concentration of hard surfaces across the county and then bring in other datasets for any site-specific water or hazard question.
The 1985–2025 Difference Map Is Not a Simple Land-Use Change Rate
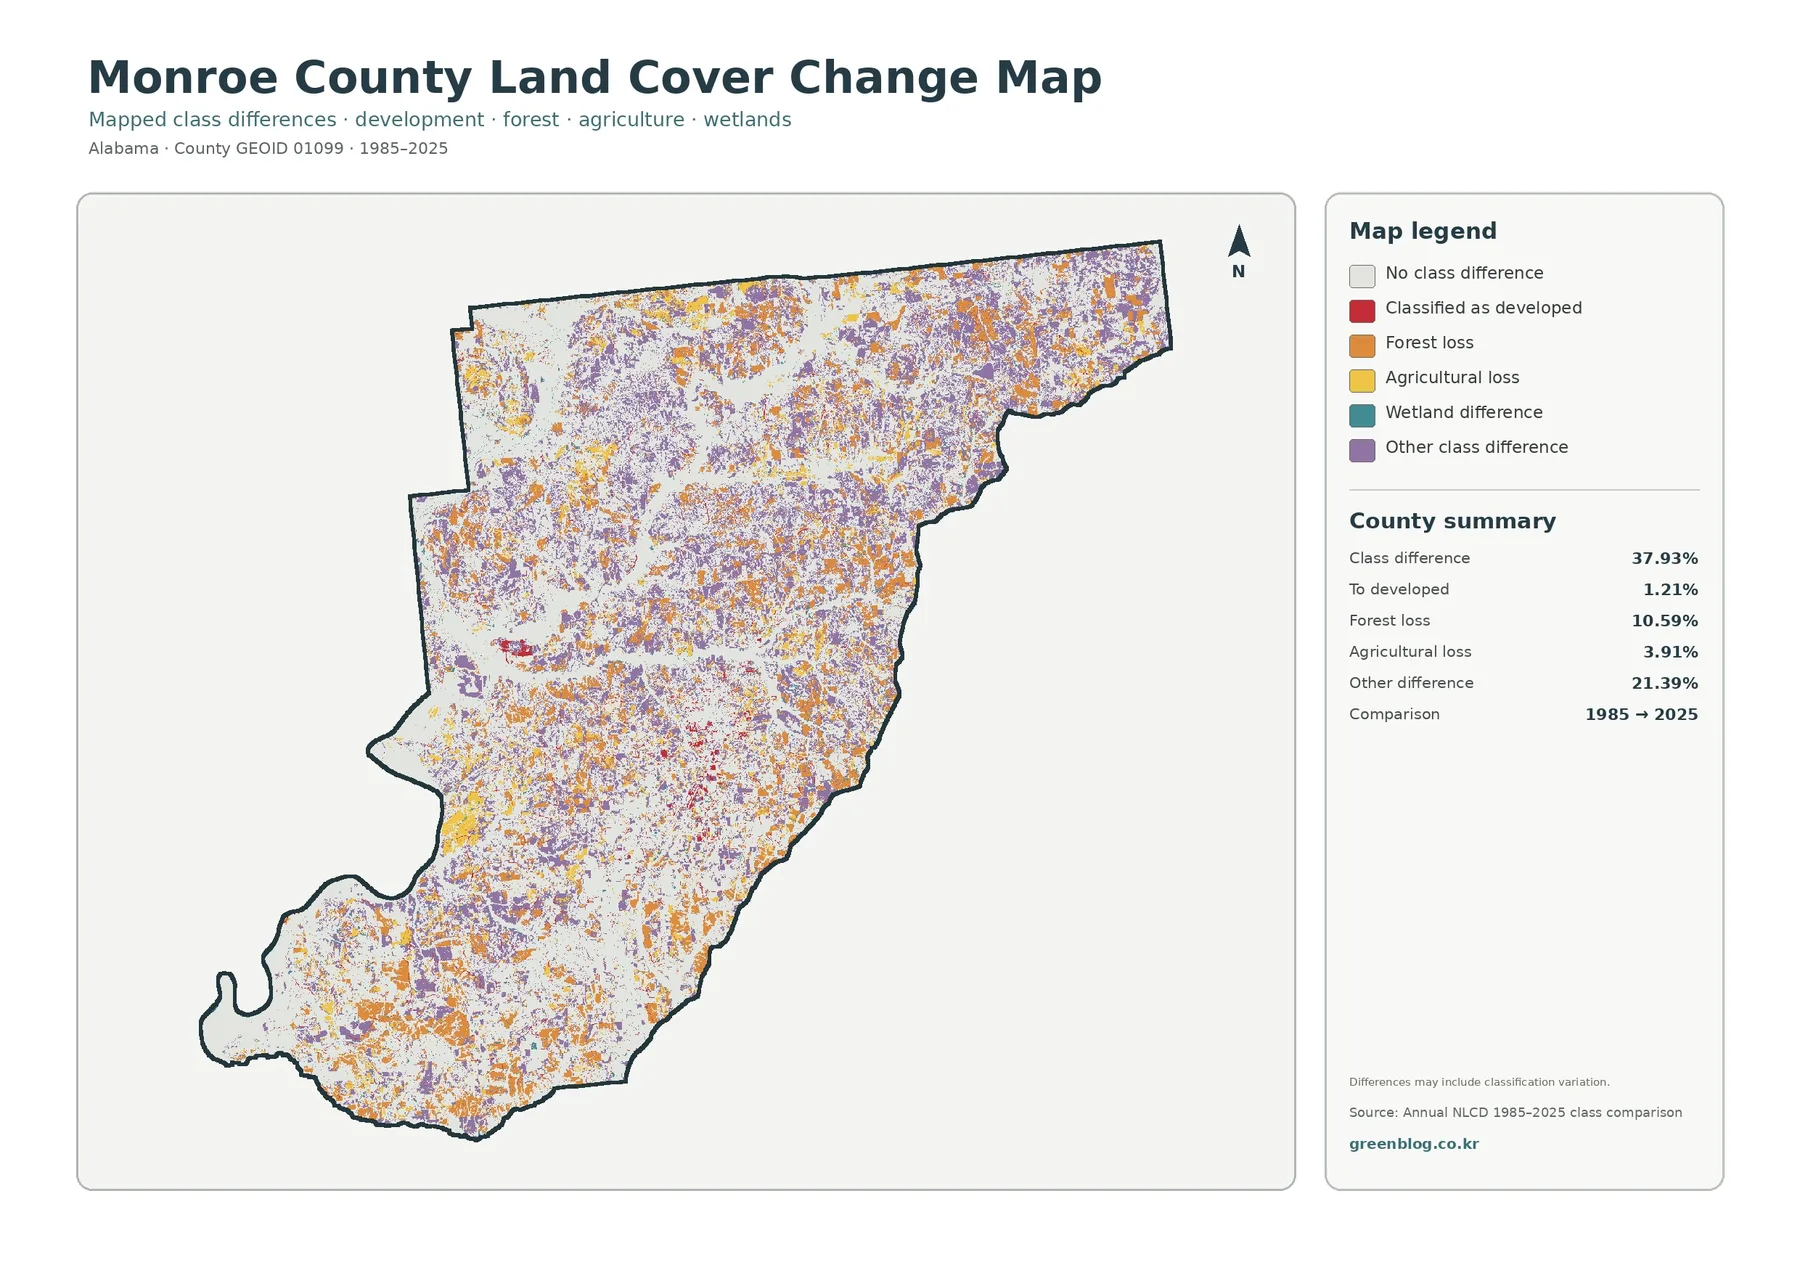
The long-term comparison marks 37.93% of the county as a class difference between 1985 and 2025. Its summary separates 1.21% classified toward developed land, 10.59% forest loss, 3.91% agricultural loss, and 21.39% other difference. White areas indicate no class difference in the comparison, while colored cells show one of the mapped difference categories. The large overall percentage makes the map visually busy, so the legend is essential.
Orange forest-loss cells are scattered through the north, center, and south rather than forming one single block. Yellow agricultural-loss cells also appear in multiple areas, while purple other-difference cells cover a wide mix of small patches. The result is not a one-direction story in which one class simply replaces another everywhere. It is a countywide mosaic of different classification outcomes between two endpoints.
The red “to developed” category represents 1.21% of the county in the summary. It is visible around the main developed cluster and in smaller locations, but that figure should not be restated as an exact 1.21% increase in urban area. The category tells us how cells compare at the two endpoints. It does not identify the exact year of development, the previous class for every cell, or the project that produced a change.
The map itself warns that differences may include classification variation. Mixed pixels, imagery conditions, small shifts along wetland or forest edges, and changes in the way a cell is assigned can all contribute to a different class between years. This is why the 37.93% figure is best treated as a screening measure for where the two classifications differ. Confirming real change at a specific location requires intermediate-year imagery, local records, or field evidence.
Choose the View That Matches the Question
For a quick county overview, start with the general land-cover map. It answers the broadest questions: which surface type dominates, where wetlands are extensive, where agriculture is more common, and where the principal developed cluster sits. Because all major classes appear together, it is the strongest single image for a report introduction or a classroom discussion of Monroe County’s overall landscape.
If the question is about rural land, habitat context, or the relationship between wooded and open areas, the forest-and-farmland map is more efficient. It keeps forest, agriculture, grass and shrub vegetation, wetlands, and water visually prominent. The view makes the southern agricultural concentration easier to compare with the more heavily forested north without asking the reader to sort through every developed subclass at the same time.
For settlement intensity, switch to the impervious product. A developed class on the general map can include a wide range of surface conditions, whereas the impervious map separates low and high proportions of hard surface. This is particularly useful around Monroeville, where the darkest values identify a compact core and lighter values extend into less heavily paved surroundings. It is a better answer to “how hard-surfaced is this area?” than the general developed class alone.
Use the change map only after establishing the current 2025 pattern. A forest-loss cell on the difference view does not tell you what occupies that cell today unless you compare it with the current map. The same applies to agricultural loss and other class differences. Placing the current and change views side by side keeps two separate questions clear: what is mapped here now, and was the 1985 classification different?
Thirty-Meter Raster Cells Are for County Patterns, Not Property Lines
Annual NLCD is a raster dataset, meaning the land surface is divided into regular cells and each cell receives a mapped value. The land-cover product is commonly based on 30-meter cells. A single cell can contain trees, grass, a roof, a road edge, or water at the same time, yet the land-cover map still has to assign a representative class. This generalization is why small features and narrow boundaries may look simplified.
The limitation matters in Monroe County because wet corridors branch through forest and open land, and many class edges are irregular. Zooming in can make the colored boundary appear very precise even when the underlying cell represents a mixed surface. The image should never replace a property survey, deed description, parcel database, zoning map, wetland delineation, or engineering plan. Those questions require records designed for legal or site-scale accuracy.
The 2025 label is also a date, not a guarantee of live conditions. Logging, regrowth, new construction, agricultural rotation, storm effects, or water-level changes after the observation period can make the ground look different today. When a current site condition matters, combine the map with newer imagery or field observation. When a trend matters, add more annual NLCD years rather than relying only on the two endpoints used in the supplied difference map.
Within those limits, the maps are effective for county comparisons and visual communication. They provide a consistent way to discuss why Monroe County reads primarily as a forested landscape, how wetland corridors remain extensive, where agriculture becomes more visible, and how little of the county has high impervious cover. The value comes from matching the scale of the question to the scale of the product.
Download the Four Original Monroe County JPG Maps
The ZIP below contains the original JPG for each map used on this page: general land cover, forest and farmland, impervious/developed land, and the 1985–2025 land-cover difference map. Each image is 2480 × 1754 pixels and is kept at its source resolution. The package manifest does not mark these files as meeting the A3 high-resolution reference, so test readability at the intended print size before using them for a large-format display. Use the original JPGs when you need the supplied source images rather than the smaller WebP previews embedded in the article.
Frequently Asked Questions
What is the dominant land-cover class in Monroe County in 2025?
Forest is the dominant class at 51.94%. Wetlands account for 19.53%, agriculture 10.57%, grassland 6.30%, and shrubland 5.98%. These are mapped surface-cover classes, not ownership or legal land-use percentages.
Why are wetlands 19.53% while open water is only 0.82%?
Open water and wetlands are separate classes. Water represents open water surfaces, while wetlands can include saturated ground and wetland vegetation. They often occur next to each other along the Alabama River setting, but they should not be combined as if they were the same surface.
Why is developed cover 4.64% while mean impervious surface is 0.71%?
Developed land can include permeable surfaces such as lawns, trees, bare soil, and drainage areas. The impervious map focuses on hard surfaces such as roofs and pavement, so its countywide mean is expected to be lower than the developed-cover share.
Does 37.93% class difference mean 37.93% of Monroe County changed land use?
No. The comparison can reflect real cover change as well as classification variation and mixed-pixel effects. The map is useful for locating areas that differ between 1985 and 2025, but site-specific change needs intermediate imagery, local records, or field evidence.
What files are included in the download?
The ZIP contains four original 2480 × 1754 JPGs: general land cover, forest/farmland, impervious/developed land, and the 1985–2025 difference map. GIS layers, parcel boundaries, and editable vector files are not included.
Map File Information
The ZIP contains four original Monroe County JPG maps covering general land cover, forest/farmland, impervious/developed land, and 1985–2025 class differences.
- Included Files: Land cover, forest/farmland, impervious/developed land, and 1985–2025 change maps
- Printable Size: 2480 × 1754 pixels each
Related Maps
- Autauga County Alabama Land Cover Map
- Baldwin County Alabama Land Cover Map
- Barbour County Alabama Land Cover Map
Sources and Reference Material
The percentages for 2025 land cover, impervious surface, and the 1985–2025 class comparison come from the four supplied Monroe County map images built from Annual NLCD data. Geographic context for the Alabama River, Monroeville, local agriculture and forestry services, and county boundaries comes from the sources below. The sources serve different purposes and are not treated as interchangeable parcel, zoning, or survey records.
- MRLC Annual NLCD Data — access to Annual NLCD land-cover and related datasets
- USGS Annual NLCD Land Cover Classification — definitions for forest, developed, agriculture, wetlands, and other classes
- Encyclopedia of Alabama – Monroe County — county geography, the Alabama River, Monroeville, and regional context
- Alabama Cooperative Extension System – Monroe County — county agriculture, farm management, forestry, wildlife, and natural-resource program context
- U.S. Census Bureau TIGER/Line Shapefiles — county boundary data documentation
Green Map creates custom-edited map images using open geographic data sources such as geoBoundaries, Natural Earth, OpenStreetMap, and government open data.
These maps are edited visual materials, not raw data files, and are provided for education, documents, presentations, and graphic reference.