Clinton County is defined by a sharp east-west land-cover contrast. Lake Champlain borders the east, Plattsburgh forms the clearest developed center, and farmland spreads across much of the eastern lowland. Farther west, forest becomes dominant and wetlands appear more frequently, creating a very different landscape within the same county.
This page compares four Clinton County themes: general land cover, forest and farmland, impervious surface and developed land, and mapped change from 1985 to 2025. WebP previews are available in the article, while the four original JPG maps can be downloaded together in one ZIP file. The set is useful for comparing the Lake Champlain lowland, Plattsburgh, western forest, wetlands, and long-term classification differences.
Table of Contents
A county split between forested interior and eastern lowland
The 2025 county summary identifies forest as the dominant cover at 56.13 percent. Agriculture accounts for 15.33 percent, wetlands for 12.34 percent, developed cover for 7.26 percent, and water for 6.87 percent. Those figures become more meaningful when paired with the spatial pattern: the western and southwestern parts of Clinton County form a broad green mass, while the eastern side contains far more agricultural and developed patches.
Lake Champlain is the largest water feature on the eastern boundary and provides an immediate orientation point. Around that side of the county, agricultural colors become extensive and the developed classes are more noticeable. Plattsburgh stands out as the strongest urban concentration. Between the eastern lowland and the western forest, the map becomes more mixed, with agriculture, forest, wetlands, and small settlements interlaced rather than separated by a single sharp line.
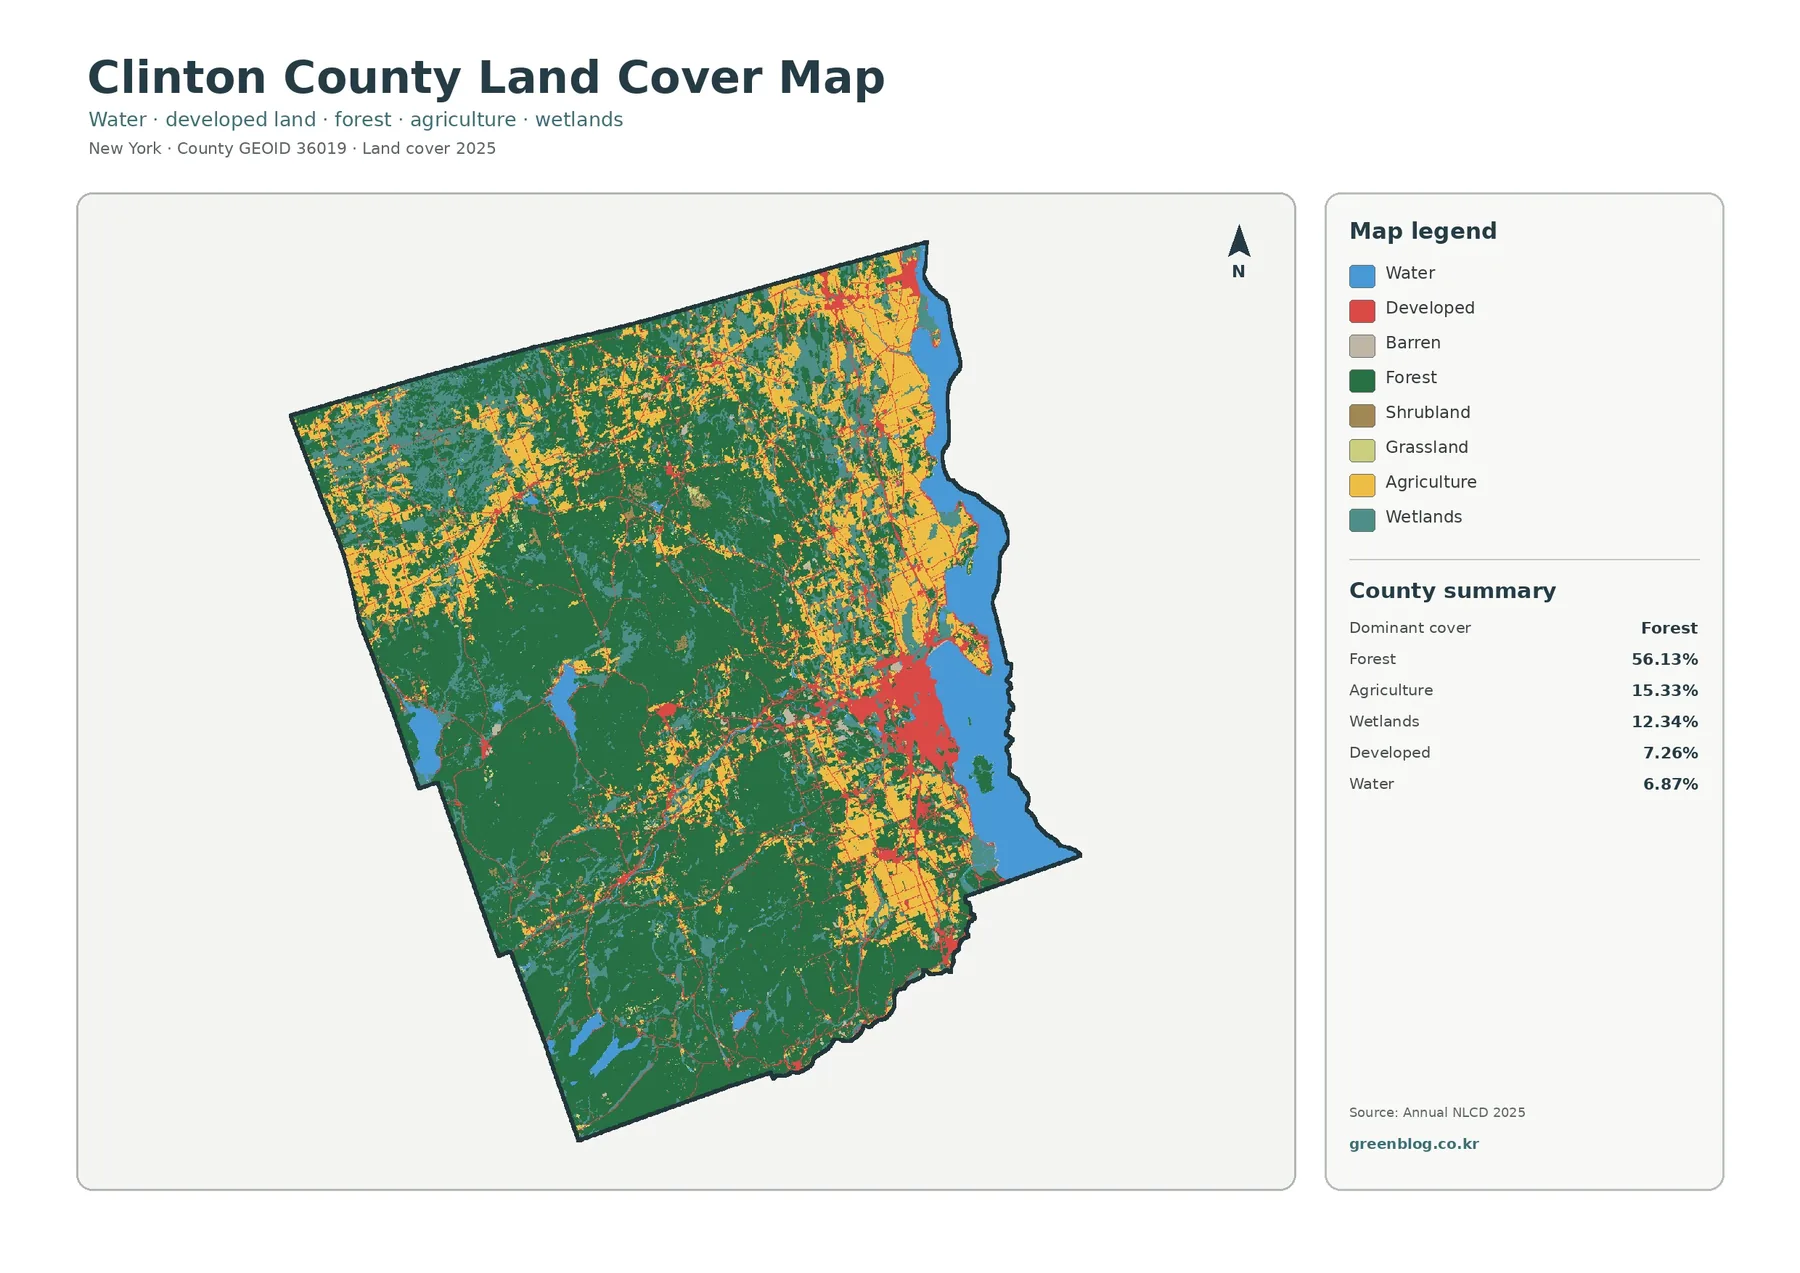
A good way to read the map is to move from large areas to smaller details. First identify the western forest and Lake Champlain. Then look for the agricultural belt in the east and the developed cluster around Plattsburgh. Finally, inspect the scattered wetlands and inland water bodies. This sequence keeps small colored patches from obscuring the county’s main geographic contrast.
Forest and farmland occupy different parts of the county
The forest-and-farmland map removes some of the visual competition of the full legend. Forest remains the dominant western cover, while cropland and pasture/hay become easier to follow through the north-central and eastern portions of the county. The agricultural pattern is not a single uninterrupted block. It is broken by wetlands, water, settlement, and narrow strips of other cover, especially toward the transition into the forested interior.
The map summary reports 56.13 percent forest and 15.33 percent agriculture, along with 12.34 percent wetlands, 6.87 percent water, 1.09 percent shrubland, and 0.59 percent grassland. These are countywide classifications rather than parcel measurements. A farm field, wooded edge, ditch, road, and building can all lie close together on the ground, while a raster classification simplifies that mixture into generalized cells.
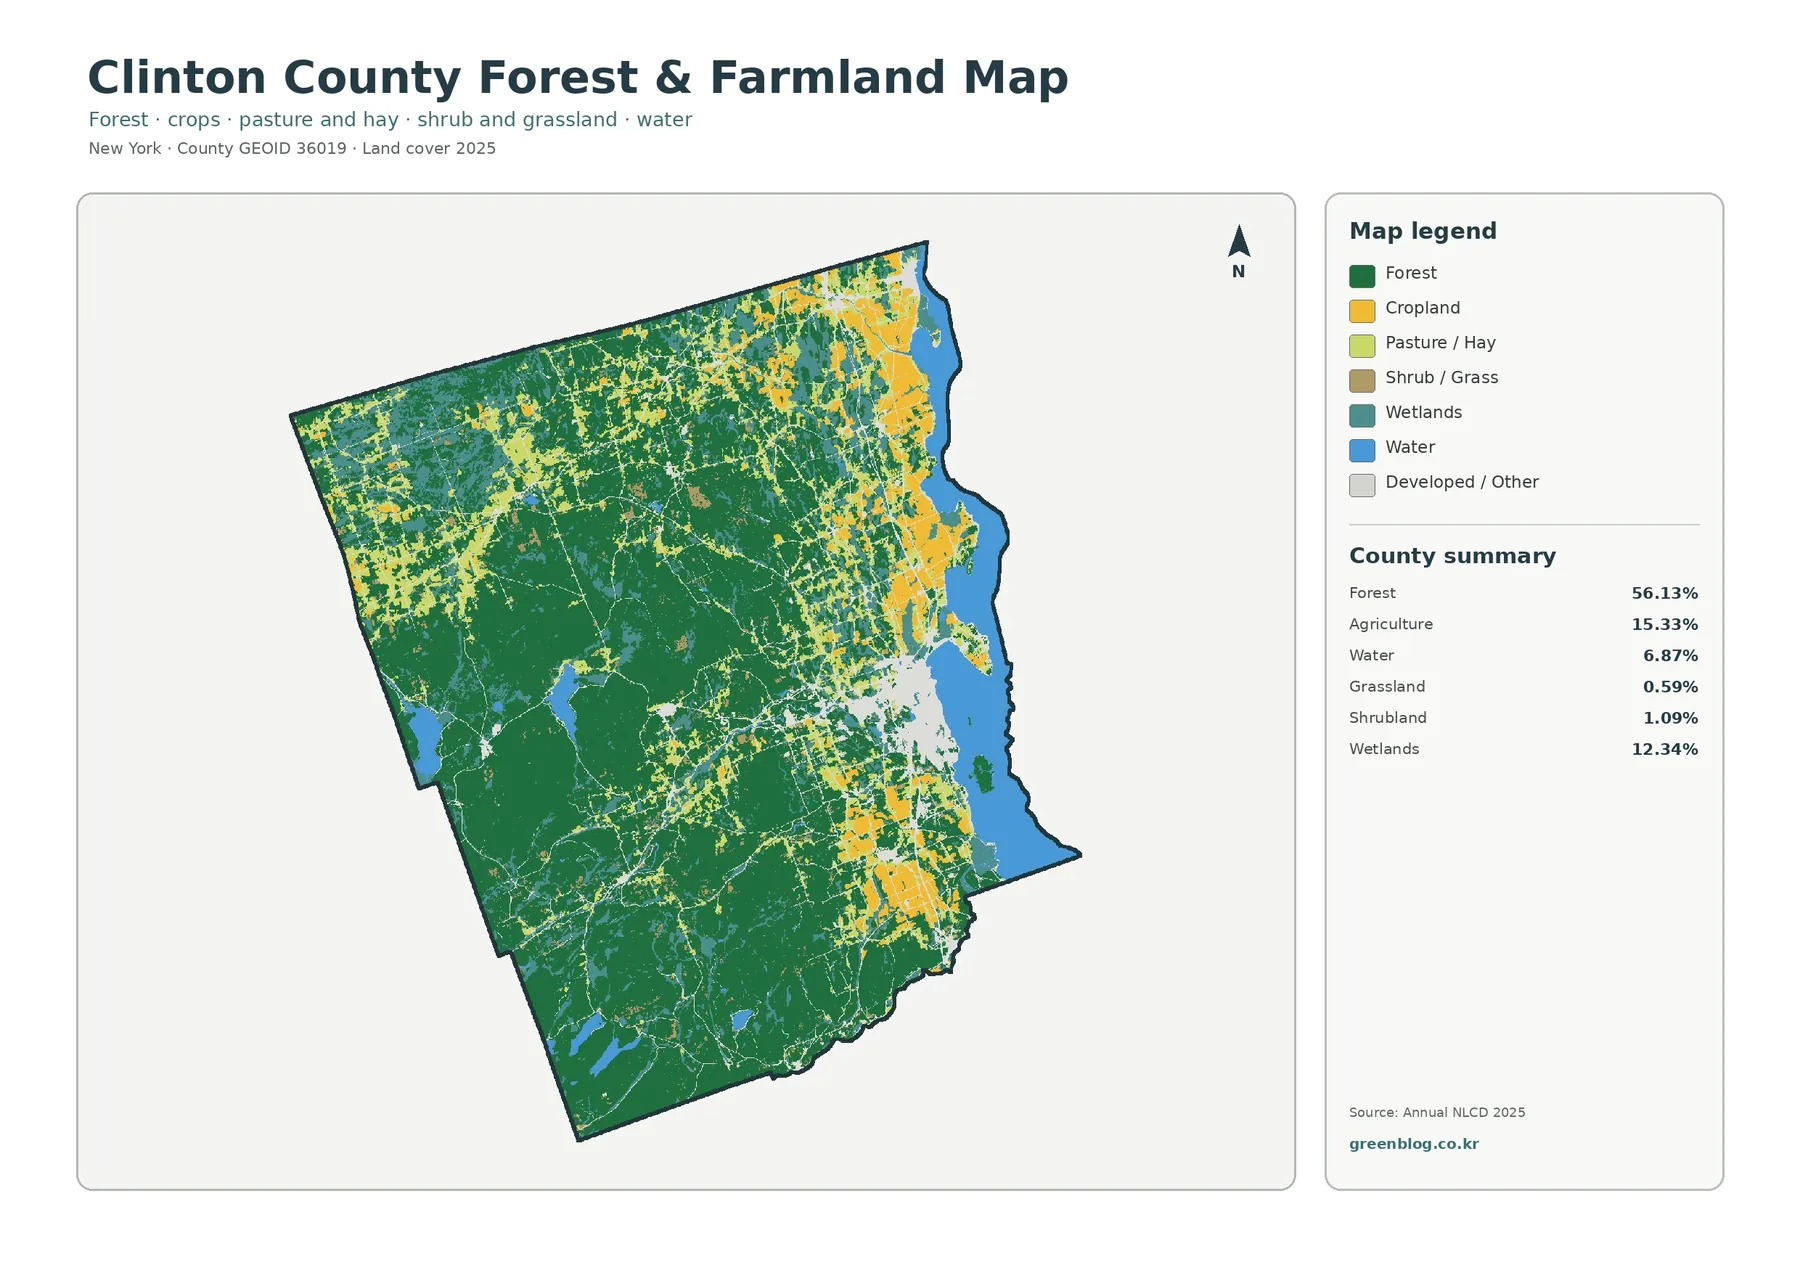
This version works well for environmental education and landscape comparison. It makes it easier to discuss where agriculture meets forest, where wetlands interrupt otherwise continuous cover, and how water features fit into the rural pattern. It is also useful as a starting point for watershed or habitat questions because it quickly identifies places where natural cover and intensively managed land occur near one another.
The county’s official hazard-mitigation planning material provides additional context for the importance of forest, agriculture, wetlands, open space, and development across Clinton County. That planning context should not be confused with the map classes themselves. The map does not show regulatory districts, Adirondack Park land-use classifications, conservation easements, or local zoning boundaries.
Impervious surface reveals the Plattsburgh concentration
Impervious surface means roofs, pavement, parking areas, and other surfaces that allow little water to soak into the ground. On the impervious map, most of Clinton County is pale because extensive forest and rural land keep the countywide average low. Plattsburgh is the clearest exception, with a dense red cluster occupying the central-eastern portion of the map, with thinner lines and smaller nodes extending along roads and through other settlements.
The county summary lists mean imperviousness at 1.98 percent, land with at least 50 percent impervious surface at 1.08 percent, and developed cover at 7.26 percent. These values measure related but different things. Developed land is a land-cover category, while imperviousness measures the share of a surface that is sealed. A developed area can therefore include lawns, trees, or other permeable ground as well as pavement and buildings.
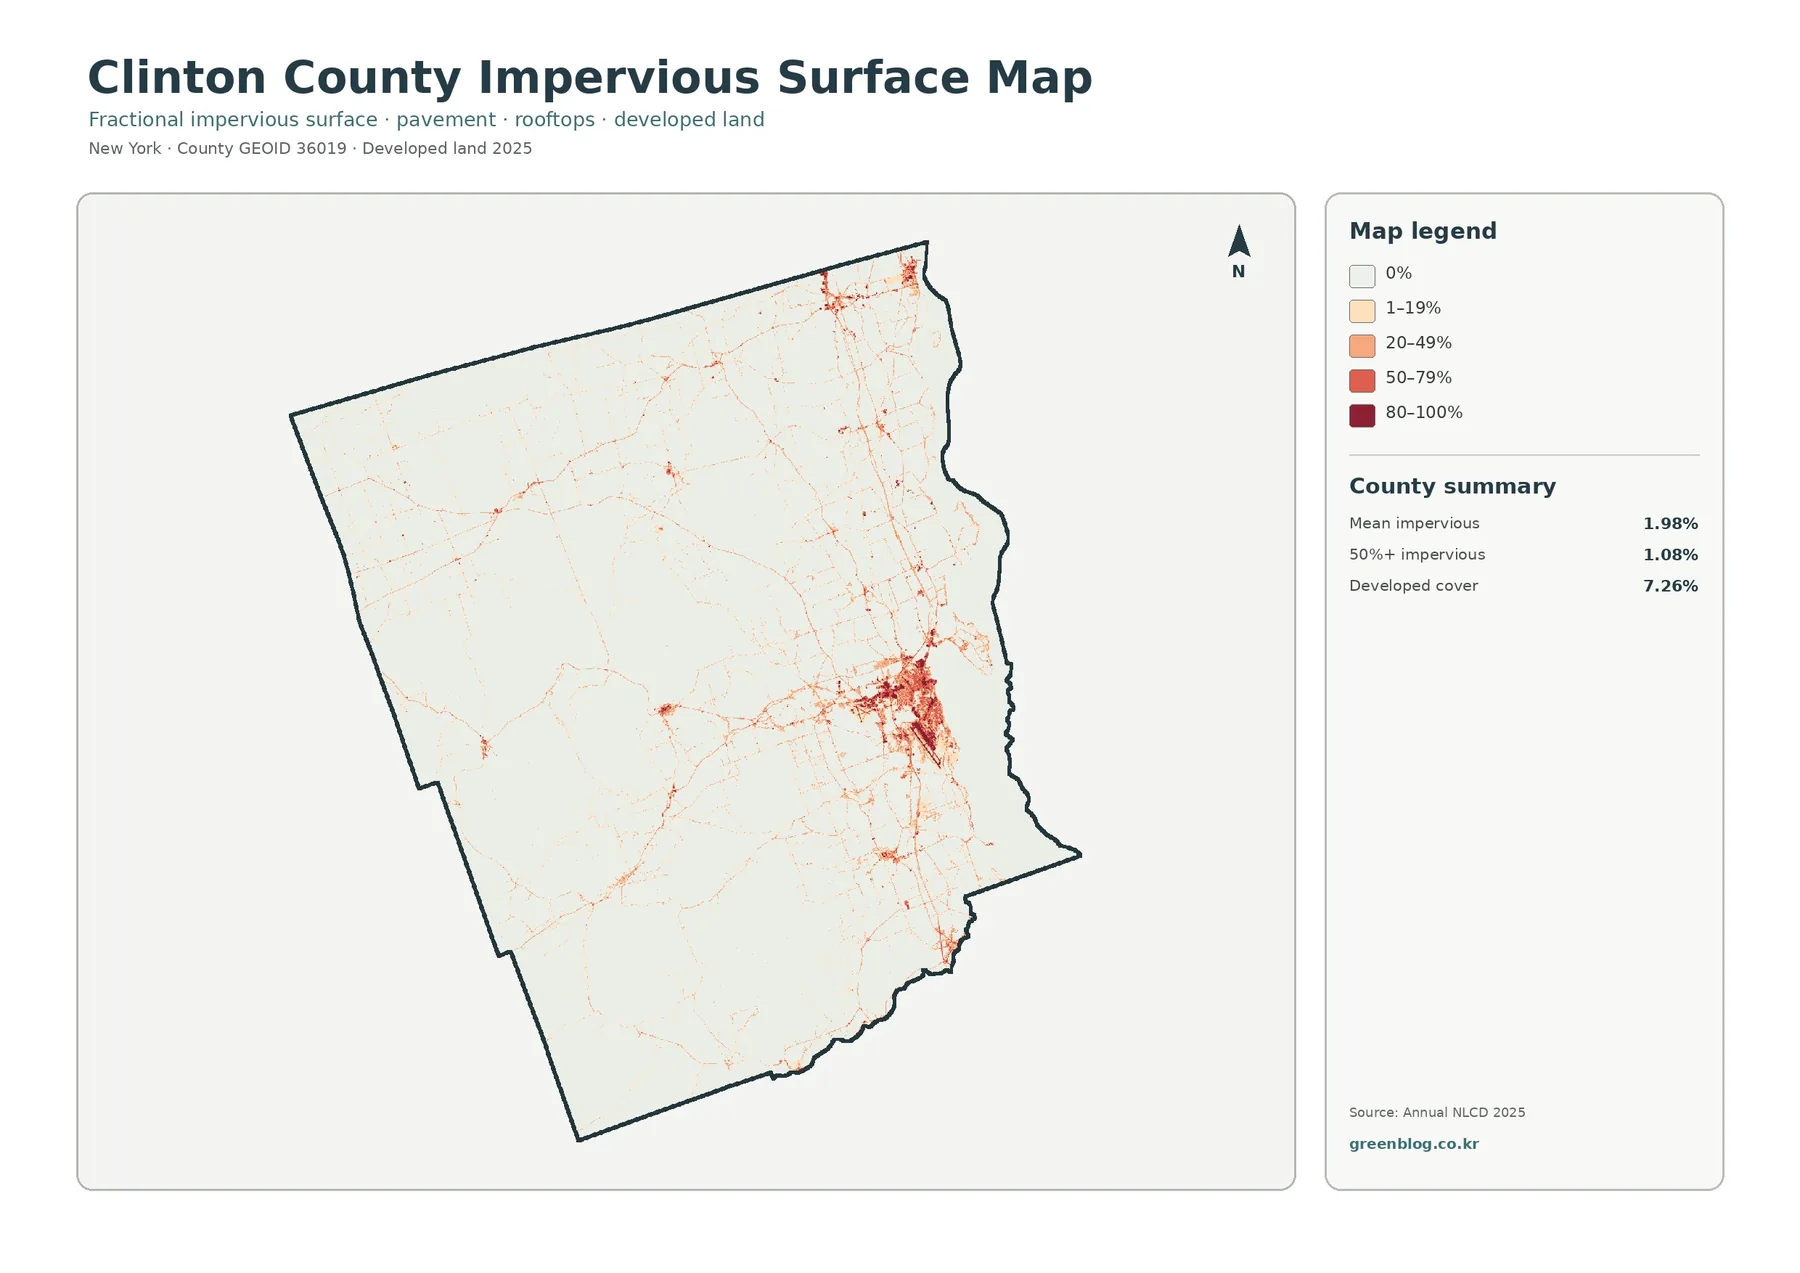
For urban form, the impervious layer is especially effective because it isolates patterns that are harder to see on the full land-cover map. Major road alignments appear as narrow traces, and settlement centers become compact areas of stronger color. For stormwater education, those patterns can be compared with nearby water bodies and wetlands. The image alone, however, cannot determine drainage performance, flood risk, or the condition of an individual property.
What the 1985–2025 change map actually measures
The change map compares mapped land-cover classes in 1985 and 2025. It reports a class difference across 12.92 percent of the county. Within that total, 1.15 percent is mapped as a change to developed land, 2.08 percent as forest loss, and 0.88 percent as agricultural loss; 8.45 percent falls into the broader “other class difference” category. The colored areas are scattered rather than forming one continuous front of change.
More differences are visible in parts of the eastern half and around the Plattsburgh area, while smaller patches also appear throughout the forested interior. That distribution is useful for locating places worth examining more closely. It should not be treated as a direct record of construction, logging, farm abandonment, or wetland alteration. Classification methods, sensor differences, and mixed pixels can all contribute to a mapped difference between two years.
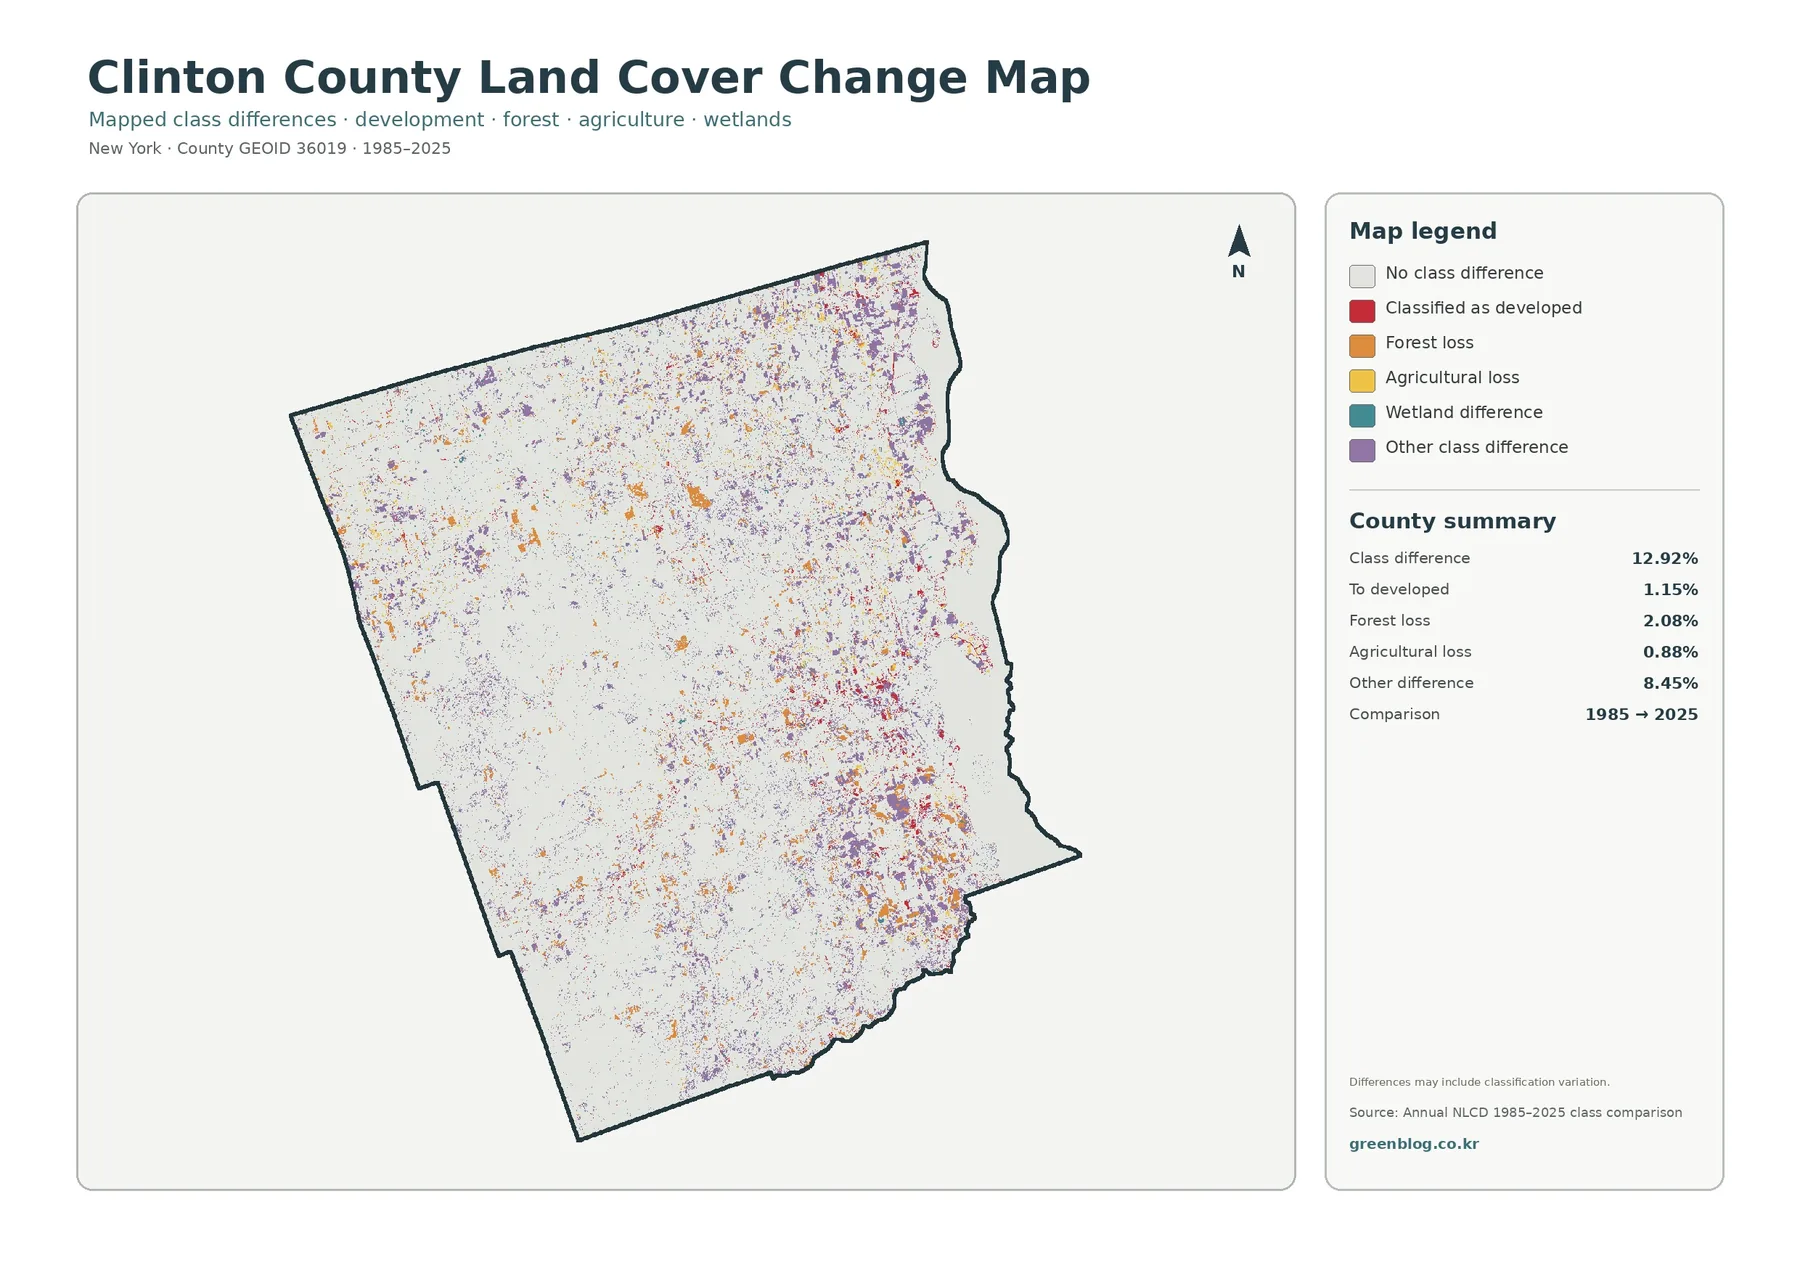
The safest workflow is to use this map as an index of possible change. Locate a colored area, check the 2025 land-cover map to see its current class, and then consult aerial imagery or local records if the history of that specific site matters. A two-date comparison can miss intermediate changes, and it can also show classification variation that does not correspond to a major on-the-ground event.
Reading all four maps as one set
Each map answers a different question. The general land-cover map asks what kinds of surface cover dominate and where they occur. The forest-and-farmland version clarifies the relationship between the county’s large wooded interior and its agricultural areas. The impervious map isolates the built footprint. The change map shifts attention from present-day distribution to differences between two mapped years.
Using the maps together also reduces the chance of overinterpreting a single color. A red developed patch on the general map can be checked against impervious intensity to see whether it contains a strongly sealed core or a more mixed developed surface. A forest-edge change patch can be compared with the current forest-and-farmland map before drawing any conclusion about what happened there.
For classroom work, the set supports a simple progression from observation to comparison. Students can identify Lake Champlain, Plattsburgh, the western forest, and the eastern agricultural belt, then ask how those patterns change when the legend changes. For presentations, the four-map sequence gives readers a clearer story than a single crowded graphic: current cover first, rural landscape second, built surfaces third, and long-term class differences last.
Useful applications without overstating precision
County-scale land-cover maps can support preliminary planning discussions, environmental education, watershed study, habitat comparison, and general-purpose graphics. They are also useful when comparing Clinton County with neighboring counties because the same classification framework can be applied across a much larger region. The consistency of the dataset is one of its main advantages.
At the same time, users should keep the scale in mind. Annual NLCD products are raster datasets, commonly interpreted at about 30-meter cell scale for land cover. One cell may contain more than one real-world surface, producing what GIS users call a mixed pixel. Boundaries between forest, field, wetland, and development are therefore generalized, especially where the landscape changes over short distances.
The 2025 map is also a snapshot tied to its observation and classification period. Clearing, construction, crop rotation, wetland change, or vegetation recovery after that period will not automatically appear in the image. When a decision depends on current conditions, the map should be paired with recent imagery, field information, and the appropriate local or state records.
Download the four Clinton County maps
The download package contains four original JPG maps: the general land-cover map, forest-and-farmland map, impervious-surface/developed-land map, and land-cover-change map. The article uses WebP previews for efficient viewing, while the JPG files are intended for offline reference, presentations, and print-oriented layouts.
Frequently Asked Questions
What is the dominant land cover in Clinton County?
Forest is the largest 2025 class in the supplied map summary at 56.13 percent. It is especially extensive in the western and southwestern parts of the county, while agriculture and development become more prominent toward the Lake Champlain side.
Why does the impervious map look much lighter than the general land-cover map?
Imperviousness measures sealed surfaces such as pavement and roofs rather than the full developed-land category. Clinton County includes large forested and rural areas, so the countywide impervious average is low even though Plattsburgh and several road corridors show clear local concentrations.
Does every colored pixel on the change map represent a confirmed land-use conversion?
No. It represents a difference between mapped classes in 1985 and 2025. Some differences may correspond to real change, while others can reflect classification variation, sensor differences, or mixed pixels. Site-specific conclusions need additional evidence. Map File Information Download the map files associated with this page for reference, printing, and compatible visual projects.
Map File Information
Download the map files associated with this page for reference, printing, and compatible visual projects.
- Included Files: Use only the versions confirmed in the article and supplied images
- File Type: Use the confirmed download contents
- Intended Use: Printing, education, presentations, and map-based projects
Related Maps
- Albany County Land Cover Map
- Bronx County New York Land Cover Map
- Cattaraugus County New York Land Cover Map
Sources and references
- MRLC Annual NLCD Data — national land-cover datasets and access information.
- USGS Annual NLCD Land Cover Classification — definitions and interpretation of land-cover classes.
- U.S. Census Bureau TIGER/Line Shapefiles — geographic boundary data used for county-scale mapping.
- Clinton County Hazard Mitigation Plan — official county context for natural resources, development, and land-use considerations.
Green Map creates custom-edited map images using open geographic data sources such as geoBoundaries, Natural Earth, OpenStreetMap, and government open data.
These maps are edited visual materials, not raw data files, and are provided for education, documents, presentations, and graphic reference.