Highlands County has a land-cover pattern that is easy to recognize once its large lakes and farmed areas are placed side by side. In the 2025 summary, agriculture accounts for 47.09% of the county and wetlands for 27.13%, while developed cover is 11.24%. Water adds another 6.28%. The most built-up areas appear mainly on the western side, whereas broad agricultural and wetland areas extend across much of the center, east, and south.
This page brings together four views of the same county: current land cover, forest and farmland, impervious surface, and mapped class differences from 1985 to 2025. The web images are intended for quick reading, while the four original JPG maps are available together in one ZIP download below. They are useful for county-scale comparison, education, presentations, and preliminary environmental context, but they are not parcel, zoning, ownership, or survey maps.
Table of Contents
Agriculture leads the 2025 land-cover summary, but water and wetlands strongly shape the county
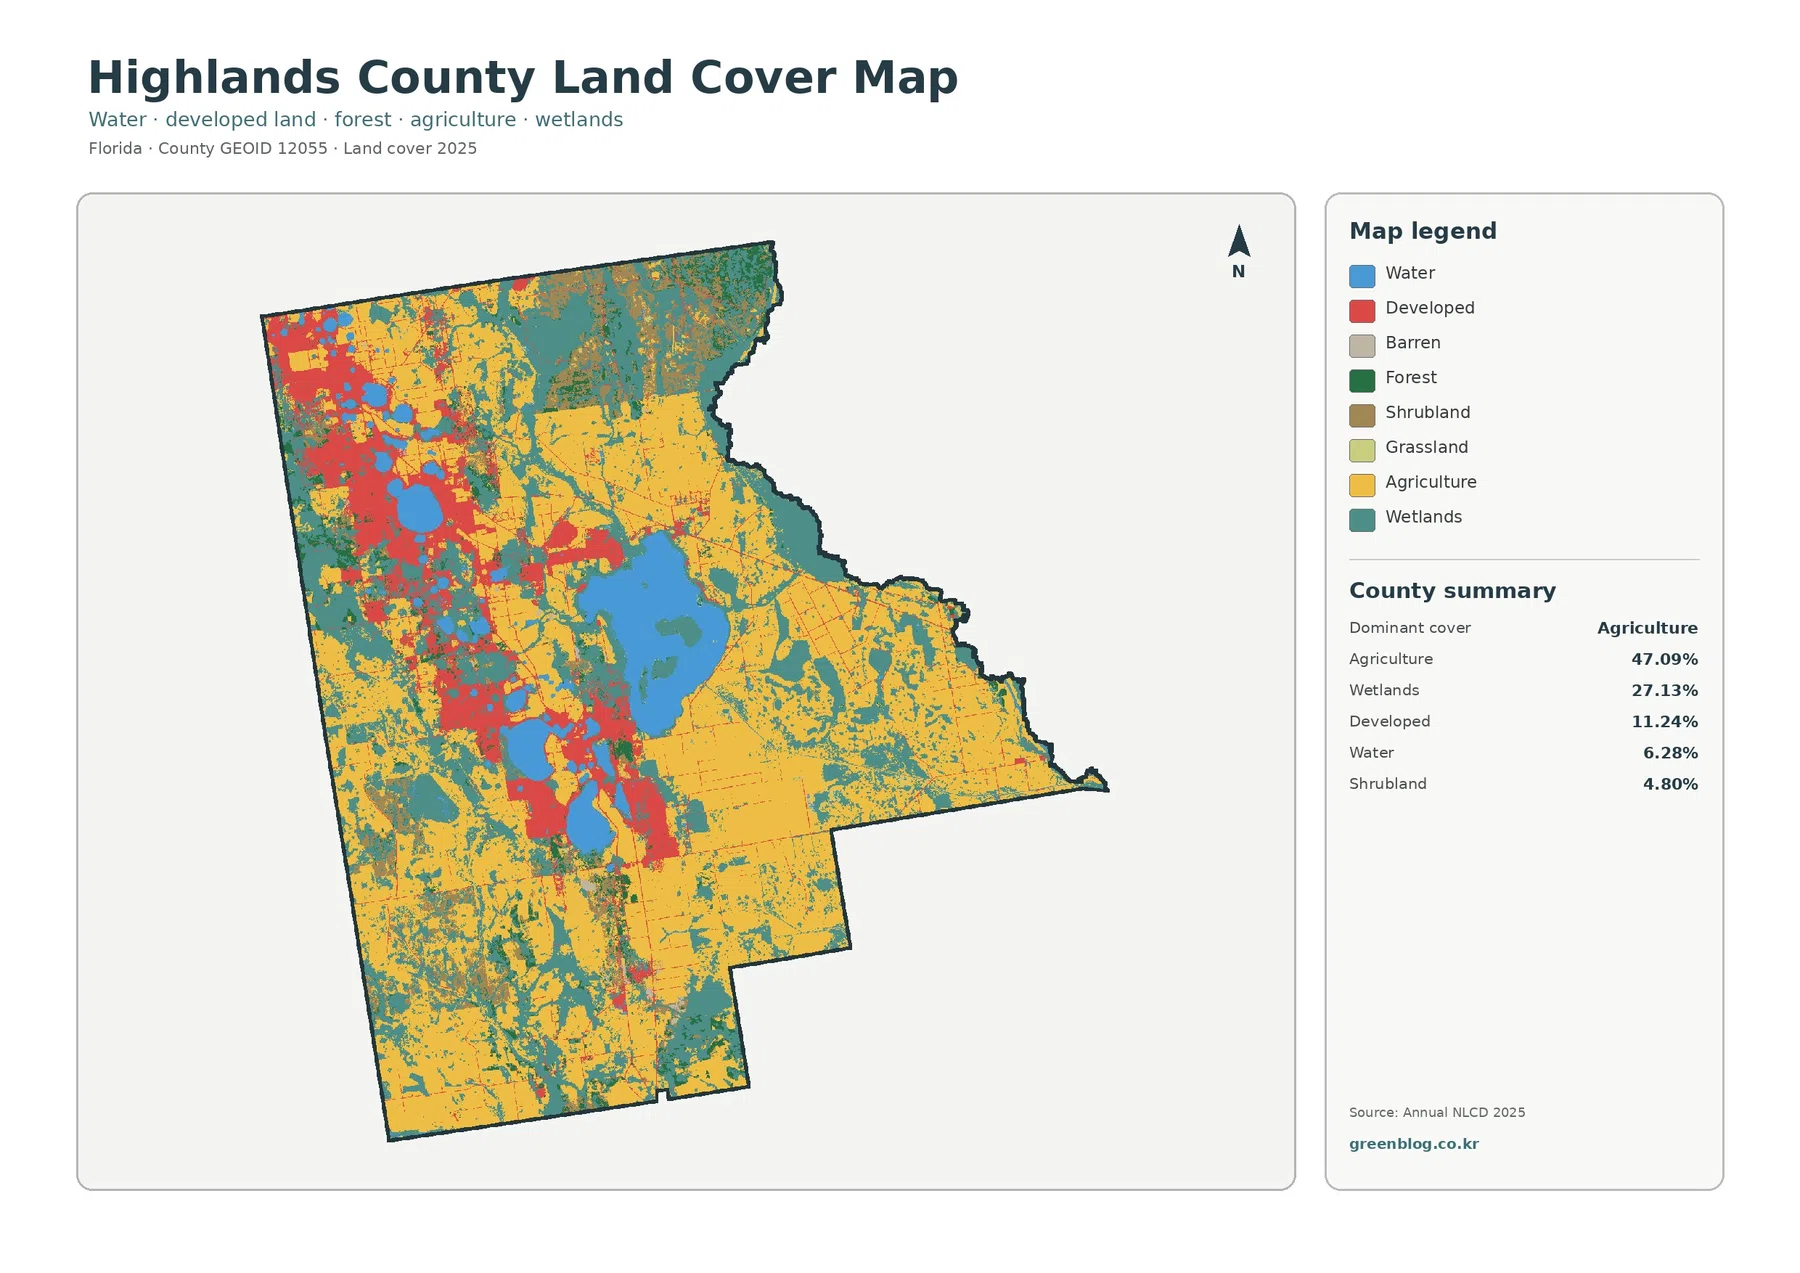
The broadest color on the general map is agriculture. At 47.09%, it covers nearly half of the county and forms large continuous areas across the eastern and southern portions of the map. Agricultural cover is also present in the northwest, although it is broken up there by water, developed areas, and wetlands. Looking only at the countywide percentage would miss this contrast between large farmed tracts and the more fragmented western side.
Wetlands make up 27.13%, the second-largest category in the summary. They are especially prominent around the large central lake, along the northeastern and eastern sides, and in several southern areas. The Florida Fish and Wildlife Conservation Commission identifies Lake Istokpoga as a large lake in Highlands County, northeast of Lake Placid. That geographic context helps explain why the center of the county contains such a conspicuous combination of open water and wetland cover.
Developed land represents 11.24%. Rather than forming one solid block, it is concentrated in several western and west-central areas. Highlands County’s official GIS services list Avon Park, Sebring, and Lake Placid as separate municipal boundaries, which provides useful context for the clusters seen on the map. The land-cover image itself does not provide enough detail to assign every red patch to a particular city boundary, so the pattern should be treated as a county-scale association rather than a precise municipal map.
Water accounts for 6.28%, and shrubland for 4.80%. Large lakes are obvious, but smaller blue areas are also scattered across the western half of the county. Shrubland occurs in smaller patches among agriculture and wetlands, especially toward the east and south. Forest is part of the legend but is not listed among the leading values in this map’s summary panel; the dedicated forest-and-farmland map provides the clearer percentage for that class.
Lake Istokpoga provides a useful reference point for reading wetlands, farms, and settlements
The large blue area near the middle of the county is the strongest visual landmark in the map set. FWC describes Lake Istokpoga as a 27,692-acre lake in Highlands County, about five miles northeast of Lake Placid. On the land-cover map, its shoreline is surrounded by a mix of wetlands, agriculture, and smaller developed areas. This makes the lake a practical reference point when comparing the more intensively developed west with the broad agricultural areas to the east and south.
Water should not be treated as an isolated category here. The map places many wetland cells next to lakes and other low-lying areas, especially around the central water body and toward the northeastern side. At the same time, extensive agricultural cover reaches close to wetland boundaries in several parts of the county. The map is therefore useful for seeing adjacency, but it does not establish hydrologic connections, wetland jurisdiction, or the cause of any particular land-cover pattern.
Highlands County also contains natural areas that help place the mapped classes in a real regional setting. Florida State Parks describes Highlands Hammock State Park near Sebring as a landscape with old-growth hammock, cypress swamp, pine flatwoods, and other habitats. FWC materials for the Lake Wales Ridge Wildlife and Environmental Area describe tracts in and around Highlands County as well. These sources support the presence of varied natural communities, but the colored cells on this county map should not be assumed to match protected-area boundaries.
The forest-and-farmland view separates working land from smaller forest patches
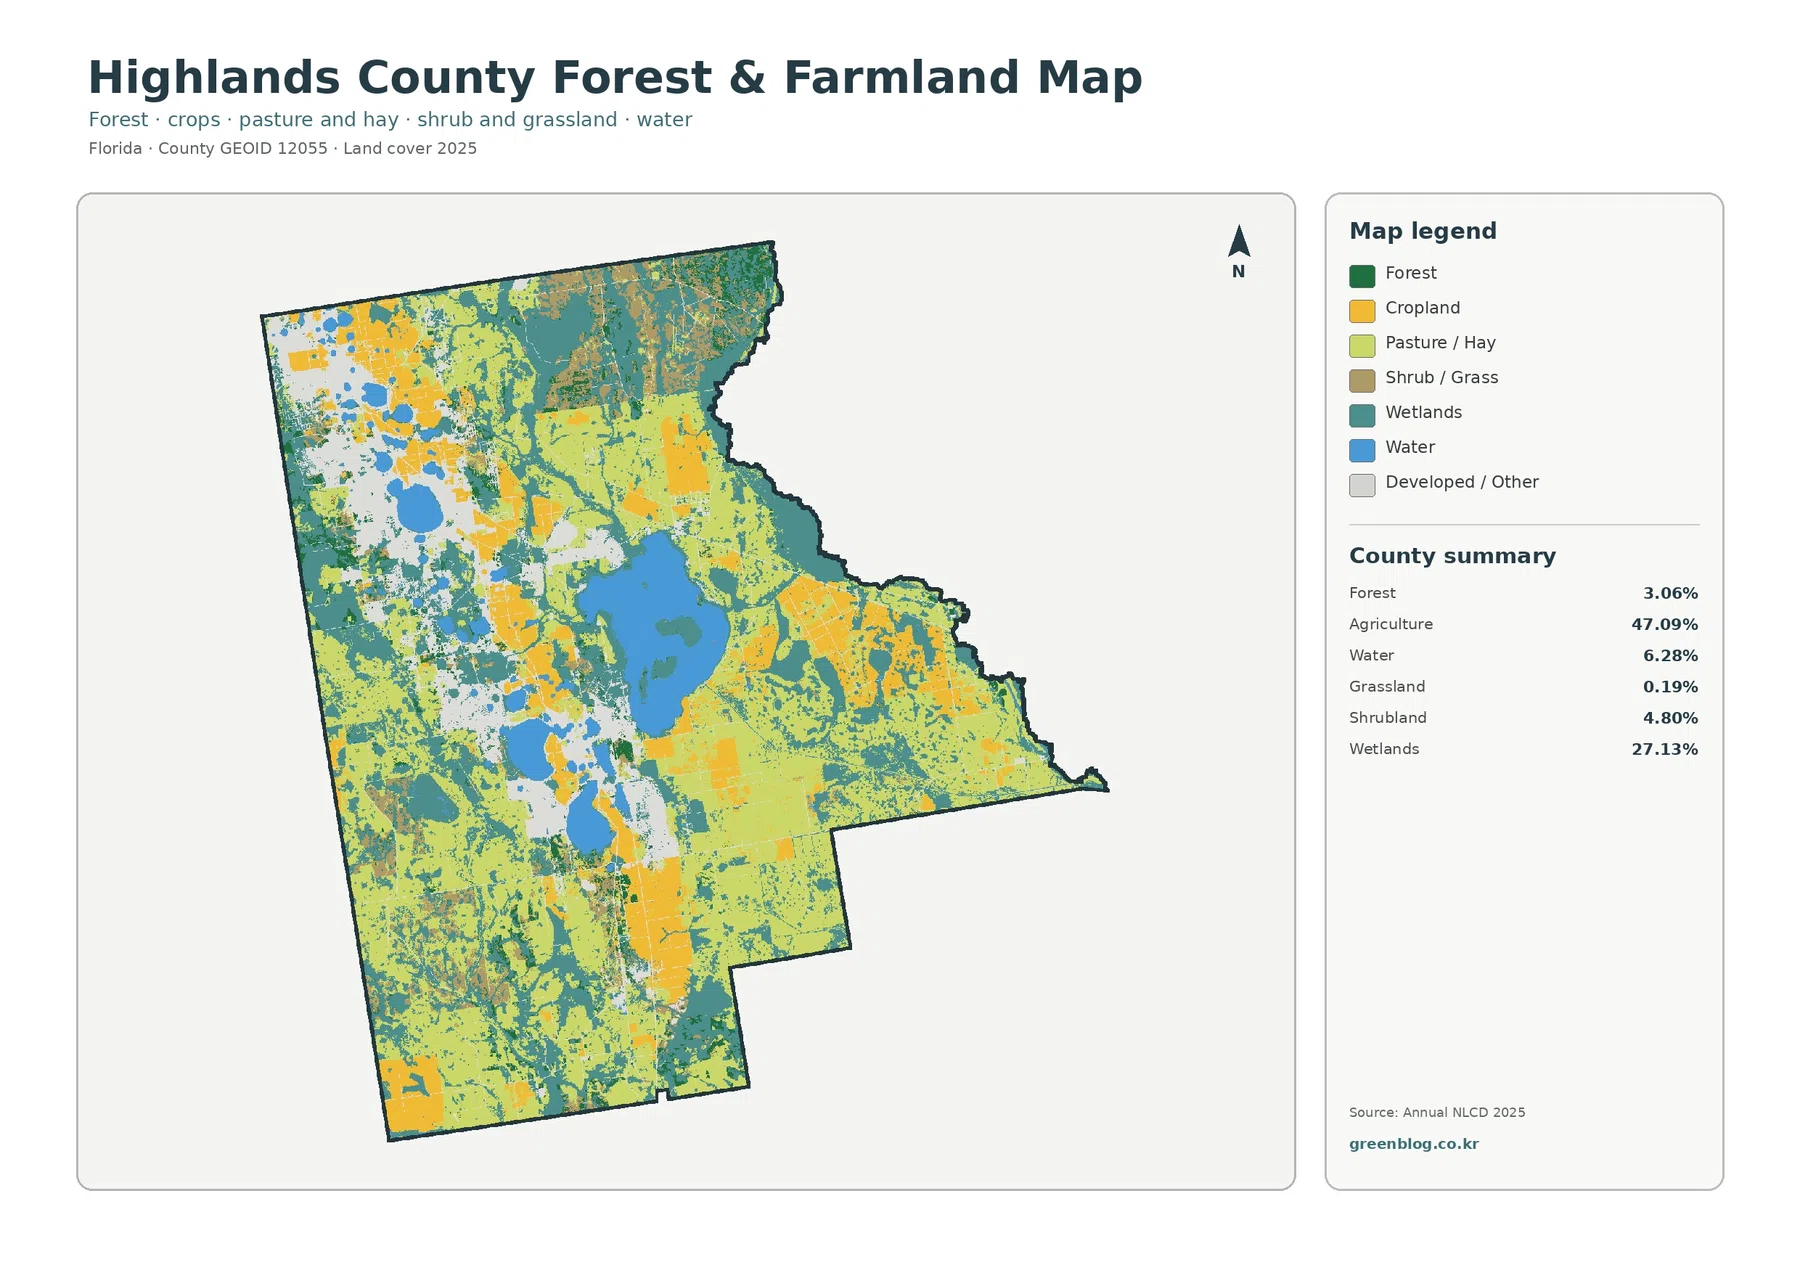
The simplified forest-and-farmland map makes the dominance of agriculture even easier to see. Agriculture remains 47.09%, while wetlands remain 27.13% and water 6.28%. Forest is listed at 3.06%, far below the two leading land-cover groups. Dark green areas occur in the north, east, around parts of the lake system, and in scattered southern tracts, but they do not cover a large share of the county as a whole.
Cropland is shown separately from pasture and hay in the legend, while the summary presents the broader agriculture figure. Grassland is only 0.19%, and shrubland is 4.80%. Those small percentages matter when interpreting the colors because a pale green or tan patch should not automatically be counted as cropland. The map is most useful when the legend is kept visible and the categories are read as mapped surface cover rather than as farm ownership or a record of specific crops.
UF/IFAS Extension in Highlands County provides agriculture and natural-resource education for local producers and residents, including topics such as livestock, pastures, commercial agriculture, and wildlife management. That official program provides useful context for why working lands are an important part of the county. It does not, however, turn the land-cover percentages into production statistics. The map does not report crop type, yield, farm income, or parcel-level agricultural use.
For environmental education or watershed discussion, this view can be more readable than the general map because many urban classes are grouped into developed or other land. A reader can follow the broad relationship among farms, wetlands, forest patches, and lakes without having to interpret every detailed class. The tradeoff is that it provides less detail about built surfaces, which is why the impervious map should be used when the question concerns pavement and rooftops.
Mean imperviousness is 3.05%, much lower than the developed-cover share
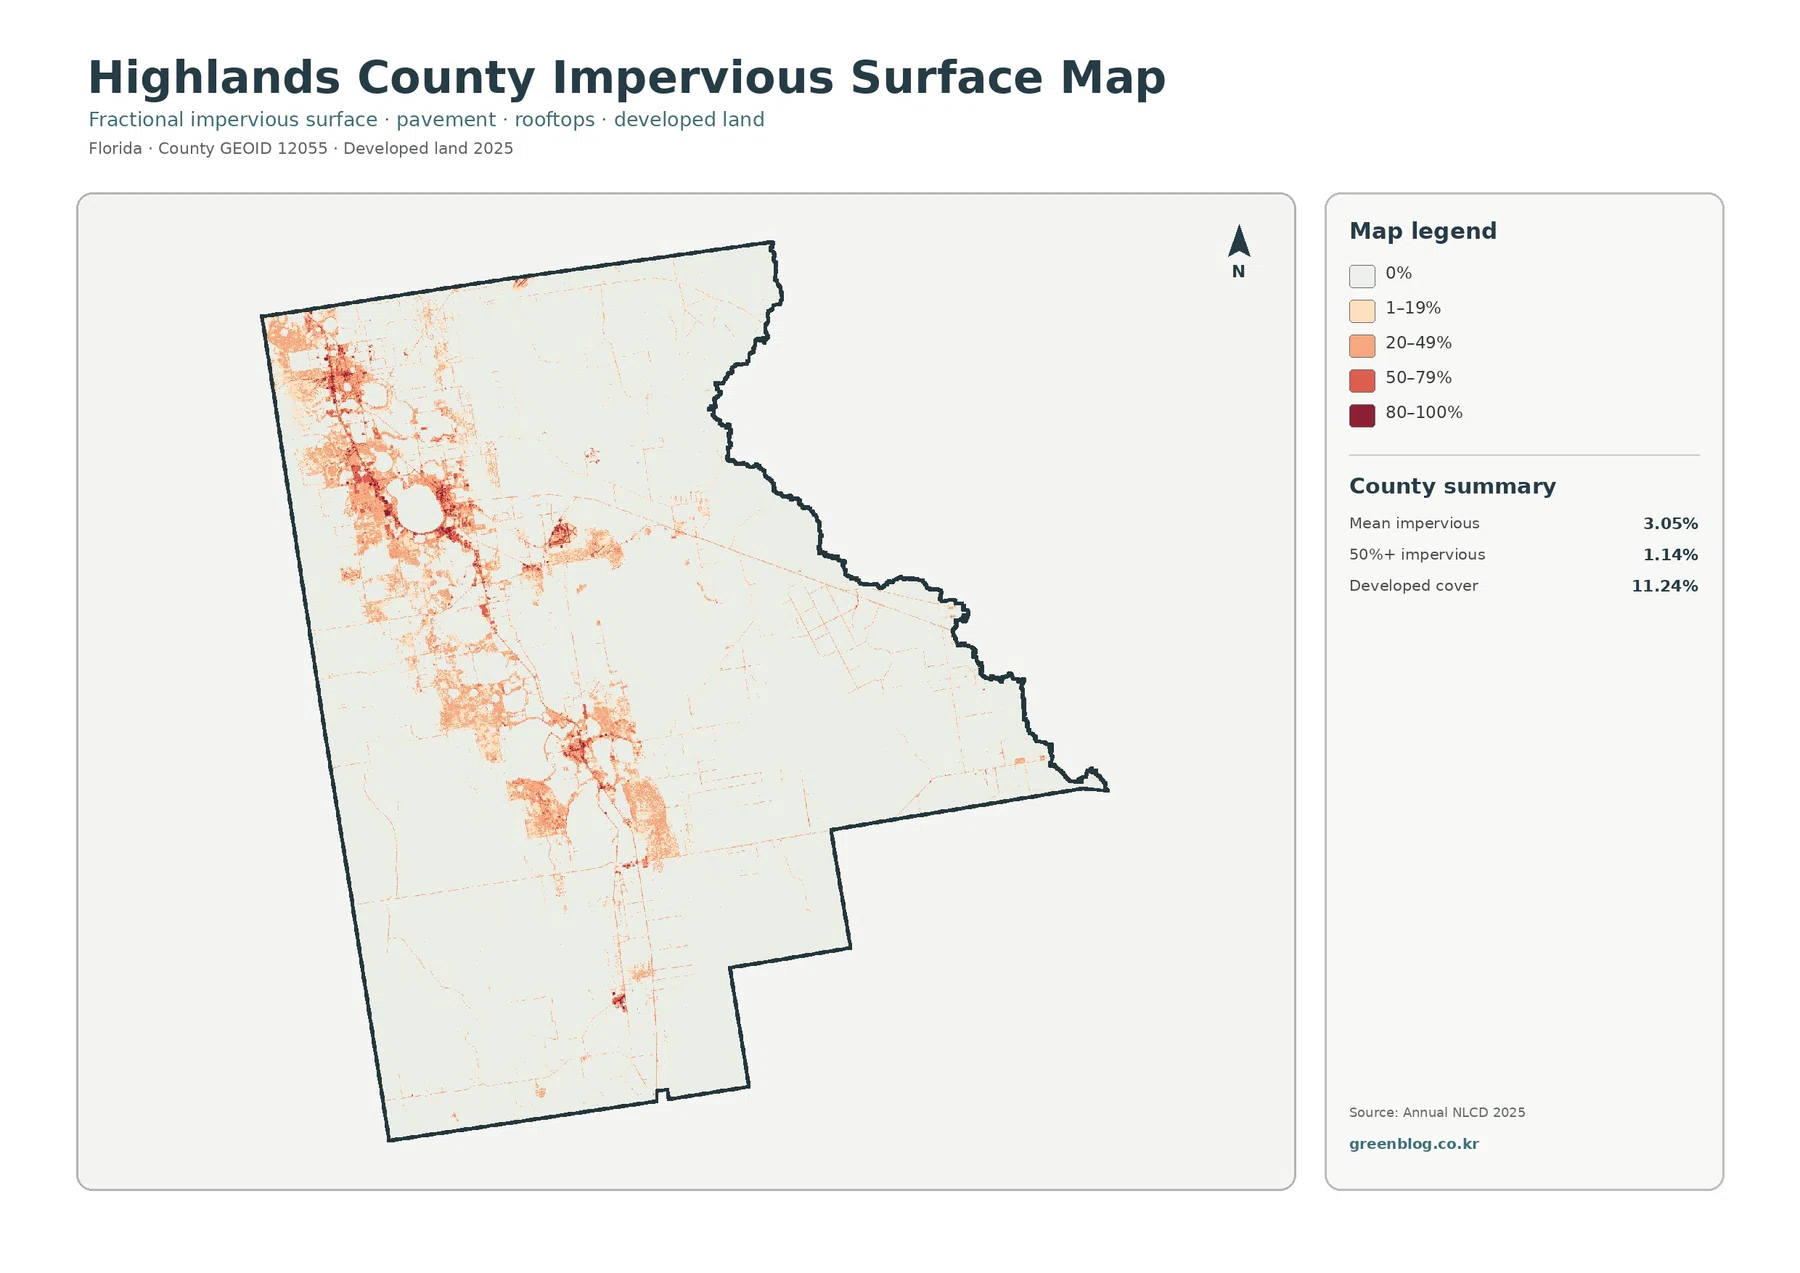
Impervious surface means pavement, rooftops, parking areas, and similar surfaces that do not readily absorb rainfall. The countywide mean is 3.05%, and 1.14% of the mapped area is at least 50% impervious. Those values are well below the 11.24% developed-cover figure because a developed land-cover class can still contain lawns, trees, bare soil, drainage areas, and other surfaces that allow water to infiltrate.
The highest impervious values are concentrated in the western and west-central portion of Highlands County. Darker orange and red areas occur in several clusters rather than across the entire county, with smaller concentrations extending southward. Most of the eastern half remains very light. This distribution shows why a countywide average should be interpreted with the map itself: the 3.05% mean blends together compact built areas and large rural or wetland landscapes.
For a basic stormwater or urbanization discussion, the impervious map can help identify where hard surfaces are more concentrated. It cannot by itself estimate flood depth, drainage capacity, or runoff at a particular property. Those questions require rainfall information, elevation, drainage networks, soils, and official flood or engineering data. The value of this map is comparative: it separates the location of hard surfaces from the broader developed land-cover classification.
Highlands County Planning & Zoning maintains official land-use, zoning, development-regulation, and comprehensive-plan resources. Those materials answer different questions from this map set. Land cover describes what appears to be on the ground, while zoning and future land use describe legal or policy categories. A high impervious value does not establish a property’s zoning, and a low value does not imply that development is prohibited.
The 1985–2025 comparison identifies class differences, not a simple physical-change rate
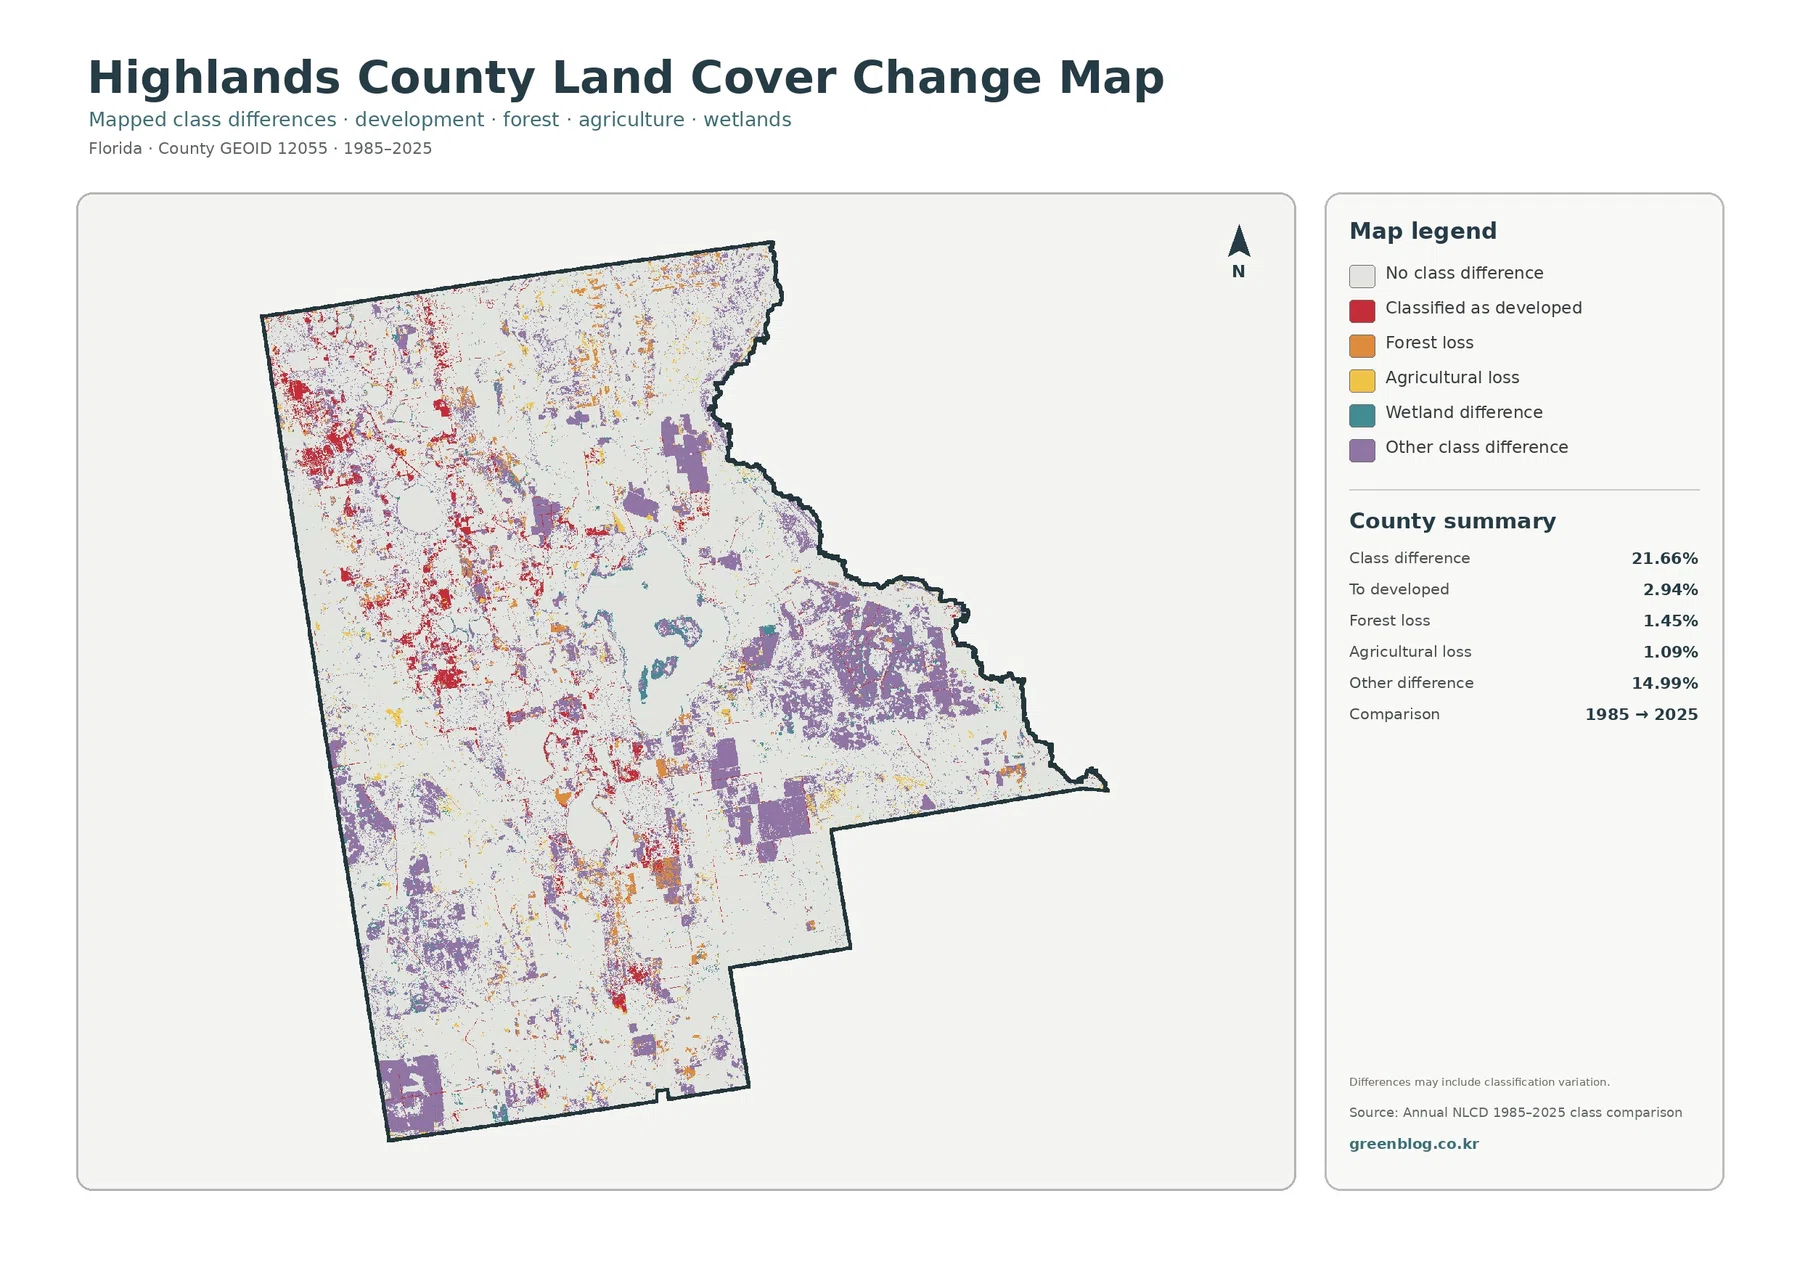
The change map reports a total class difference of 21.66% between 1985 and 2025. Its summary identifies 2.94% as classified to developed, 1.45% as forest loss, 1.09% as agricultural loss, and 14.99% as other difference. Wetland difference is included in the legend, but the summary panel does not provide a separate percentage for it. Rather than inventing the missing number, the map should be used visually for that category.
Red areas indicating classification to developed are most common in the western half, where current developed cover is also concentrated. Purple other-difference areas are widespread in parts of the east and south, while smaller orange and yellow patches identify mapped forest and agricultural losses. Large pale areas remain unchanged in classification. Reading both changed and unchanged areas prevents the colored portions from making the county appear more transformed than the summary actually indicates.
A note on the map states that differences may include classification variation. That warning is important. The 21.66% figure should not be described as proof that exactly 21.66% of the ground was physically converted. Satellite imagery, classification methods, mixed pixels, and differences in observation conditions can all contribute to mapped class differences. The map is best used to find locations that deserve a closer time-series review.
A stronger change analysis would compare this map with intermediate-year land cover, historical aerial photography, and local land-use records. For example, a red patch can be checked against the 2025 developed map to see its current context, then reviewed in older imagery to understand the sequence of change. The county-scale comparison is a useful screening layer, but it is not a substitute for a documented site history.
Choose the map according to the question rather than treating all four as interchangeable
For a quick county overview, start with the 2025 general land-cover map. It provides the clearest summary of agriculture, wetlands, developed land, water, shrubland, and the other mapped classes in one frame. When the goal is to explain why Highlands County looks predominantly rural despite several visible developed centers, this single image provides the broadest context.
Use the forest-and-farmland map when the relationship among agriculture, wetlands, water, and smaller forest areas matters more than urban detail. The impervious-surface map is the better choice for comparing hard-surface concentrations around the western population centers. For historical comparison, use the 1985–2025 map together with the current map so that present cover and changed classification are not confused.
The four maps can also support classroom exercises, presentation graphics, preliminary watershed study, and county-level habitat discussion. They work well for questions such as where farms and wetlands are adjacent, where hard surfaces are concentrated, or where classifications differ between two dates. They are much less suitable for determining a parcel boundary, legal wetland status, zoning entitlement, a road right-of-way, or construction feasibility.
The JPG download is useful for closer inspection, but resolution and classification limits still matter
The download ZIP contains four JPG files: 2025 land cover, forest and farmland, impervious and developed land, and the 1985–2025 land-cover comparison. Each source JPG is 2480×1754 pixels. That is useful for documents, slides, and moderate enlargement, but it is smaller than the pixel dimensions normally associated with an A3 print at 300 dpi. Check legend text and small change patches before committing to a large print.
Annual NLCD is raster data, meaning the landscape is represented by a grid of cells. A single cell can contain more than one real surface, such as road, grass, tree cover, water, and a building. The classification reduces that complexity to a mapped class or percentage. As a result, boundaries on these images may not match fences, shorelines, parcel lines, or regulated wetland boundaries exactly.
Keep each map’s legend with the image. Red means current developed cover on the general land-cover map, but on the change map it represents an area classified to developed between the two comparison dates. On the impervious map, increasingly dark colors represent larger fractions of hard surface. Similar-looking colors across different maps do not necessarily carry the same meaning.
Frequently Asked Questions
What is the largest 2025 land-cover category in Highlands County?
Agriculture is the largest at 47.09%. Wetlands follow at 27.13%, developed land at 11.24%, water at 6.28%, and shrubland at 4.80%. The distribution is not uniform: broad agricultural areas dominate much of the east and south, while developed cover is more concentrated in the western part of the county.
Why is developed cover 11.24% when mean imperviousness is only 3.05%?
The two measures describe different things. A developed land-cover class can include vegetation, yards, open soil, and drainage areas as well as buildings and pavement. Imperviousness measures the fraction of hard surfaces such as rooftops and paved areas, so its countywide mean can be much lower than the developed-cover share.
Does the 21.66% class difference mean that 21.66% of the county physically changed?
No. The change map notes that classification variation can be part of the difference between 1985 and 2025. The figure is useful for locating cells with different classifications at the two dates, but confirming physical change requires additional imagery, intermediate years, and other records.
Map File Information
Download the four original Highlands County land-cover JPG maps together in one ZIP file.
- Included Files: Four original JPG land-cover maps used in this article
- File Type: JPG images packaged in a ZIP archive
- Intended Use: Printing, education, presentations, and map-based projects
Related Maps
- Alachua County Florida Land Cover Map
- Baker County Florida Land Cover Map
- Bay County Florida Land Cover Map
Sources and References
- MRLC Annual NLCD Data – official access to Annual NLCD land-cover data.
- USGS Annual NLCD Land Cover Classification – official descriptions of the mapped land-cover classes.
- U.S. Census Bureau TIGER/Line Shapefiles – official geographic boundary data used for county reference.
- UF/IFAS Highlands County Agriculture and Natural Resources – local Extension information on agriculture and natural-resource programs.
- Florida FWC Lake Istokpoga – official information about the large Highlands County lake and its aquatic setting.
- Highlands County Planning & Zoning – official county land-use, zoning, and comprehensive-planning resources.
Green Map creates custom-edited map images using open geographic data sources such as geoBoundaries, Natural Earth, OpenStreetMap, and government open data.
These maps are edited visual materials, not raw data files, and are provided for education, documents, presentations, and graphic reference.