Columbia County sits between two very different landscape settings in eastern New York. The Hudson River marks the western side, where farmland and developed areas are more common, while forest becomes increasingly continuous toward the Taconic side of the county. Hudson is the clearest developed center, and the contrast between valley farms and eastern woodland is visible across all four map themes.
This page compares four Columbia County themes: general land cover, forest and farmland, impervious surface and developed land, and mapped change from 1985 to 2025. The page uses WebP images for quick on-screen viewing, and the four source JPG maps are bundled as a single ZIP download. The set helps compare Hudson, the agricultural west and center, eastern forest, wetlands, hard surfaces, and long-term classification differences.
Table of Contents
A county divided by broad forest and working landscapes
Forest is the dominant 2025 class in the supplied county summary at 54.09 percent. Beyond the 54.09 percent forest share, agriculture makes up 25.86 percent and developed cover 10.30 percent, while wetlands and water account for 7.27 and 1.94 percent respectively. The percentages help describe the balance of the county, but the spatial arrangement is more informative than the totals alone. Green forest cover becomes especially continuous across the eastern and southeastern portions, while agricultural colors are more frequent through the west and center.
Along the western boundary, the Hudson River provides the most obvious water feature. Near the city of Hudson, developed classes form the largest concentrated red area on the general map. Smaller settlements and road corridors produce additional patches and lines elsewhere, but the county remains visually dominated by forest and agricultural cover rather than by a continuous urban footprint.
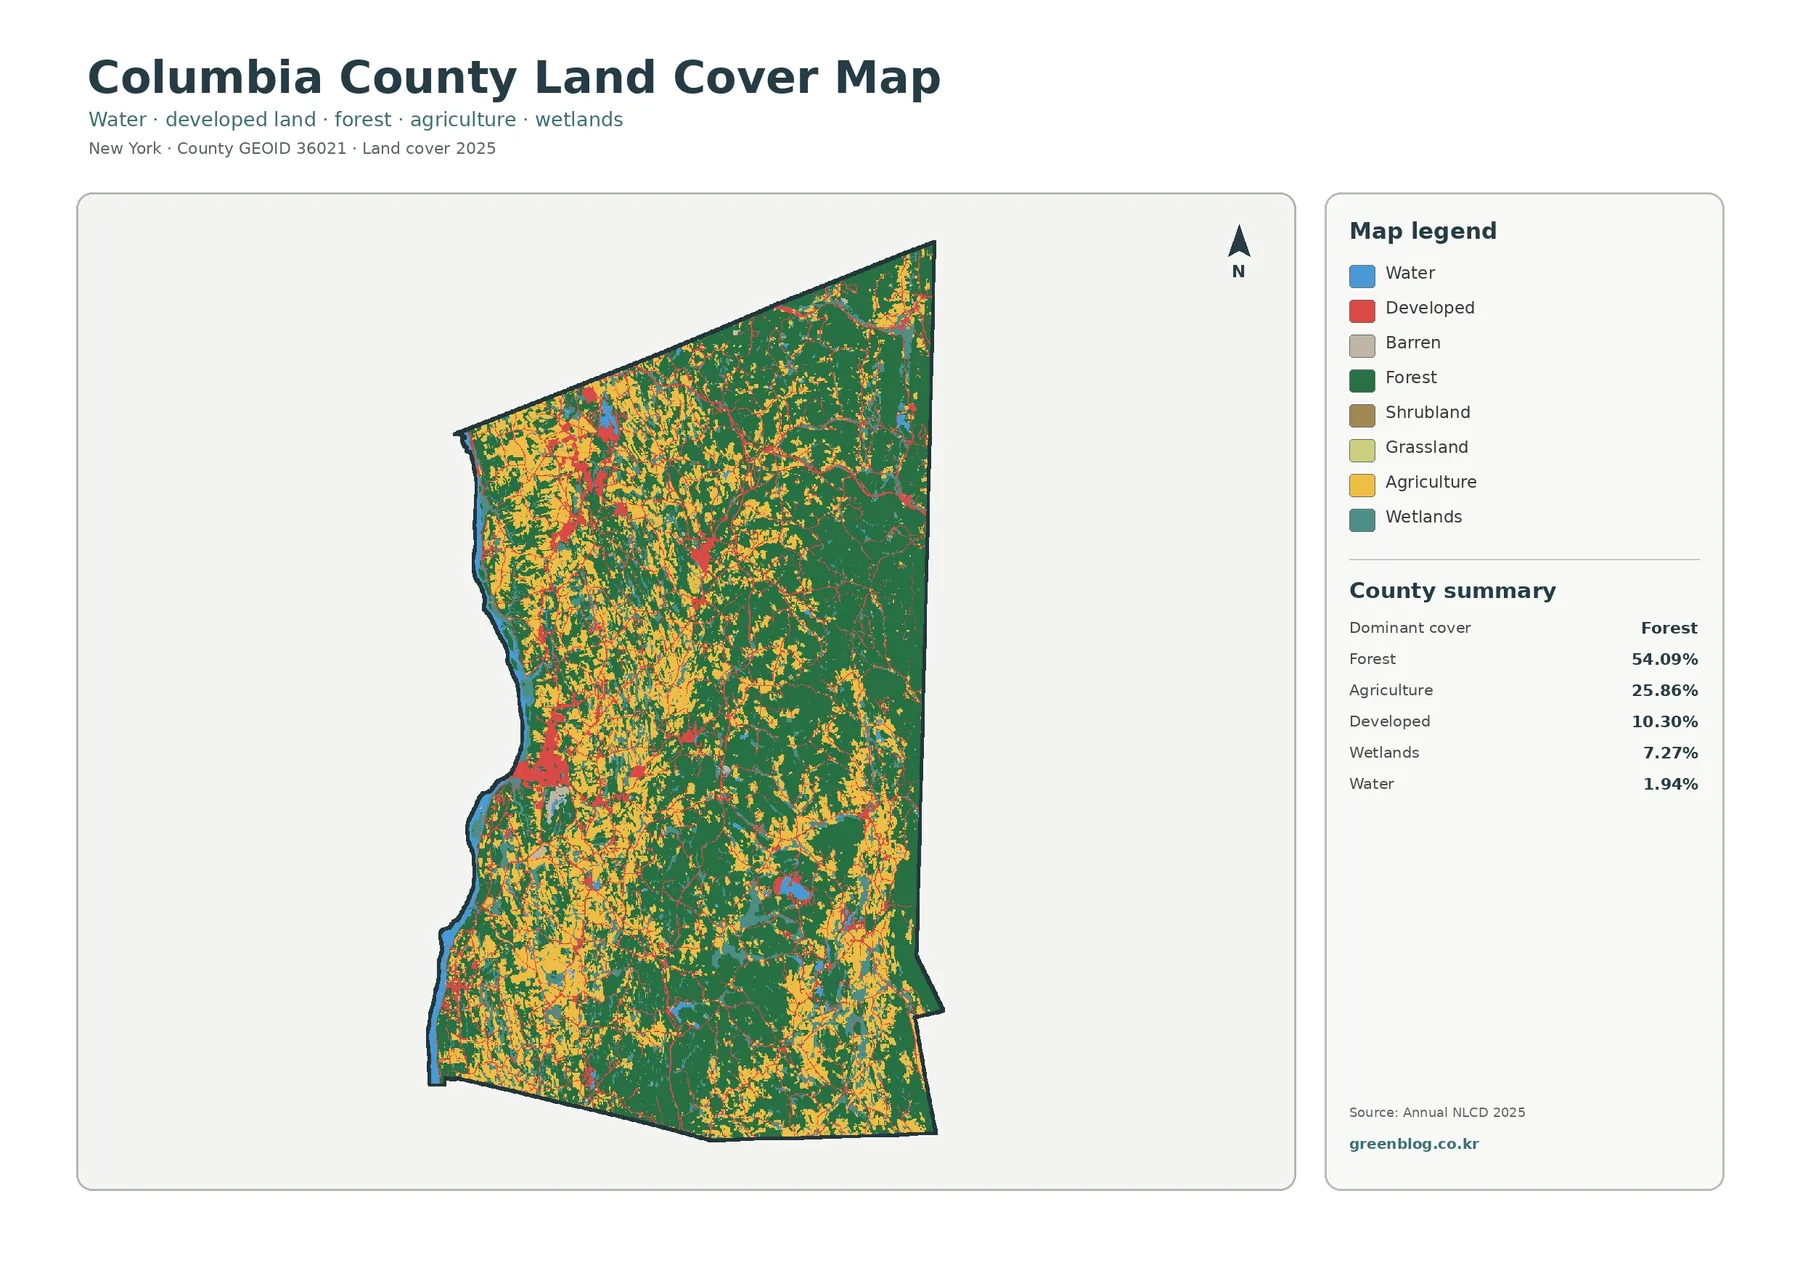
The boundary between cover types is rarely a simple straight line. Farm fields, wooded patches, wetlands, and developed areas interlock through much of the county, particularly in the central and western sections. Reading those transitions is useful because two towns with similar overall percentages can still have very different arrangements of field, forest, and settlement. The map is strongest when used to ask where classes occur and how they meet, rather than merely which class has the largest number.
Forest and farmland tell a clearer rural story
The forest-and-farmland version removes much of the visual competition from the full legend. Forest remains the largest class at 54.09 percent and agriculture represents 25.86 percent. Smaller parts of the county are mapped as wetlands at 7.27 percent, water at 1.94 percent, grassland at 0.43 percent, and shrubland at 0.11 percent. With those categories emphasized, the county reads less like a patchwork of many colors and more like an interaction between wooded uplands, farmed ground, and wet areas.
Agricultural colors appear widely across the western half and continue into the center, often as fields or irregular blocks broken by woodland. The eastern side contains larger and more connected forest areas. This pattern fits the broader physical contrast between the Hudson Valley side of Columbia County and the more wooded terrain approaching the Taconic region, but the map does not attempt to draw a precise physiographic boundary.
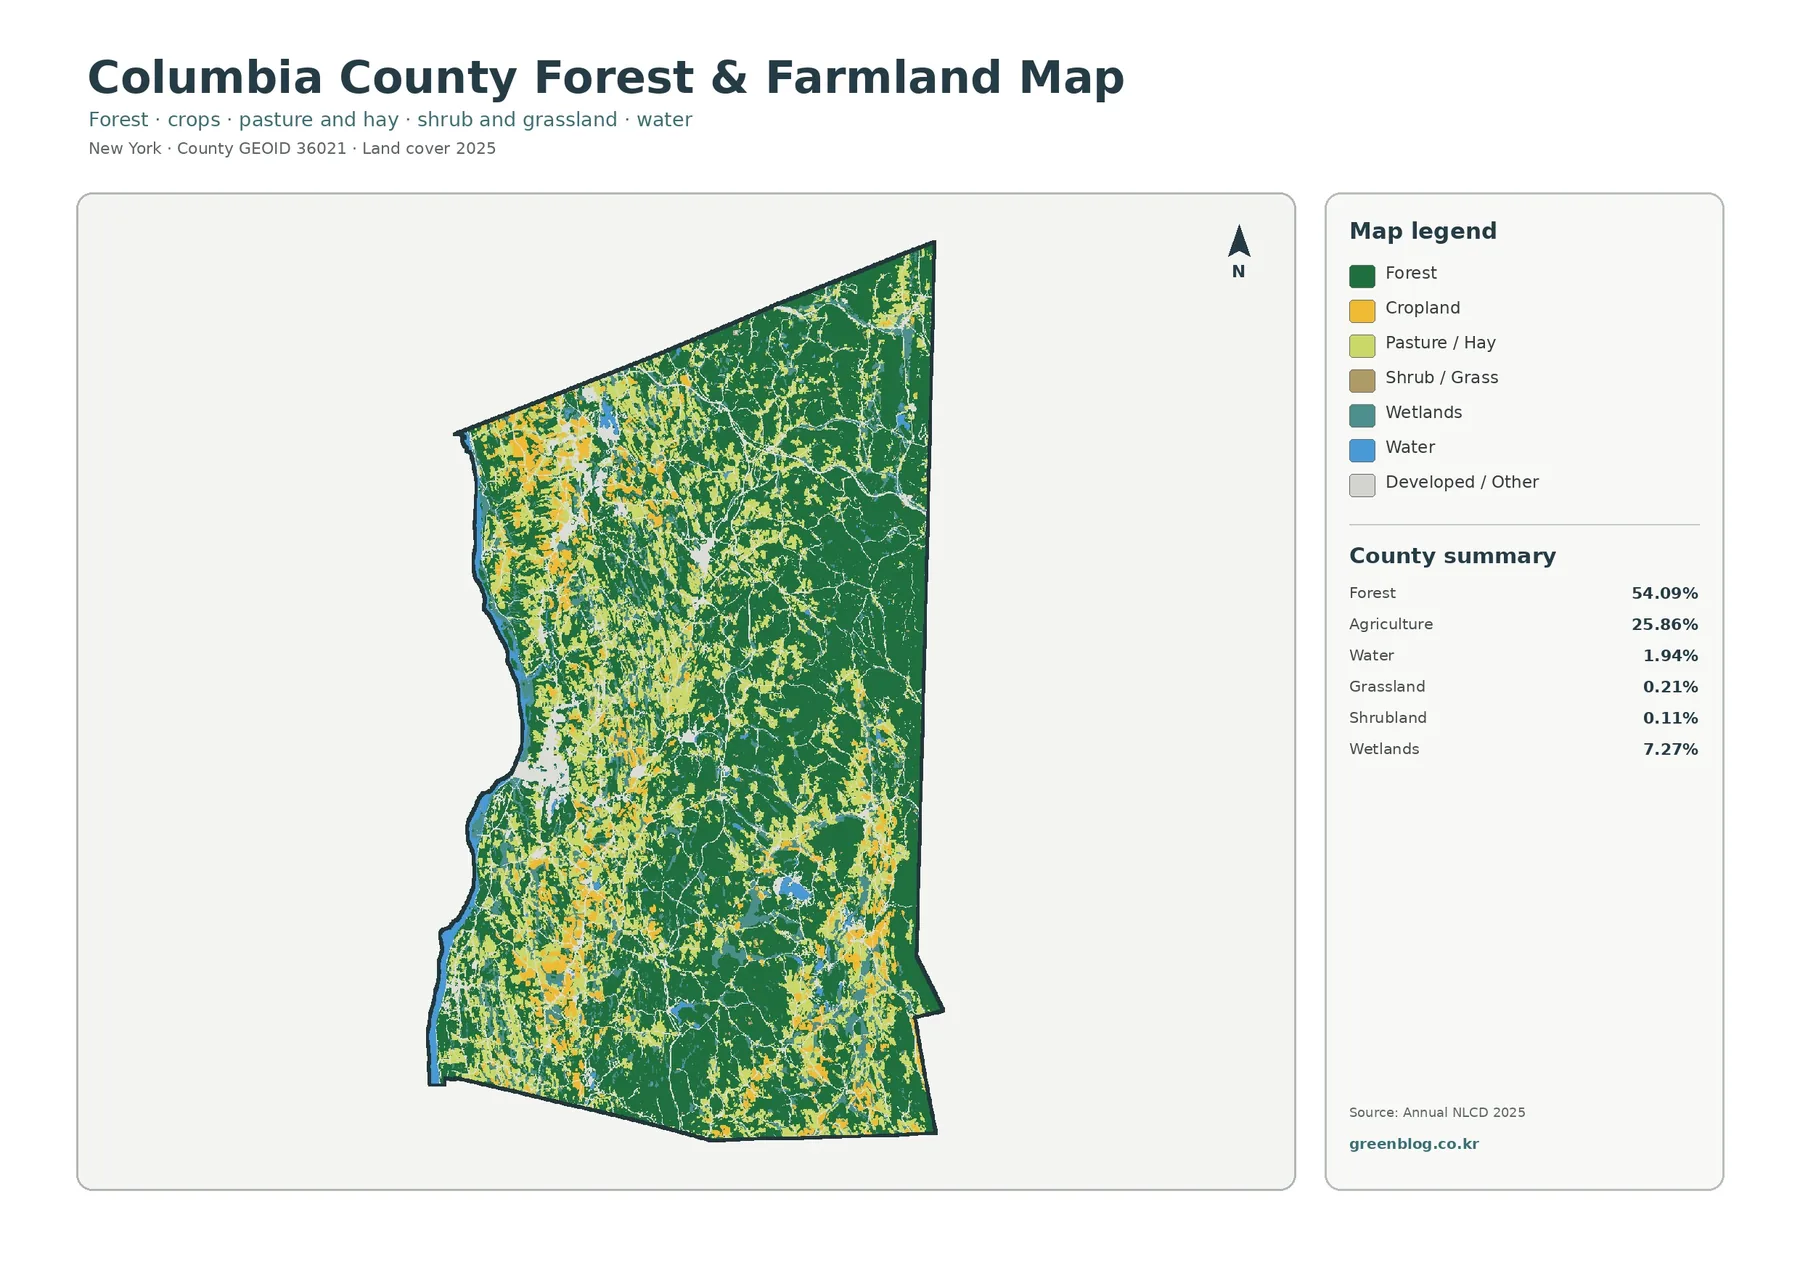
It is important not to confuse the agricultural classification with farm ownership or an agricultural district boundary. Satellite-based land cover may identify crop or pasture surfaces inside a working farm, while wooded corners, ponds, structures, and driveways on the same property fall into other classes. Likewise, a forest pixel says nothing by itself about public access, conservation status, timber management, or ownership.
For teaching and environmental comparison, this simplified map is particularly useful. A student can trace where farmland gives way to larger forest blocks, then compare wetlands and water that interrupt both. A watershed or habitat study can use those locations as a first screening layer before moving to soils, elevation, stream networks, protected lands, or field observations.
The impervious map isolates Hudson and transportation corridors
Impervious surface is a different measurement from developed land cover. It estimates surfaces such as rooftops, pavement, parking areas, and roads that allow little rainfall to soak into the ground. Most of Columbia County appears pale on this map, but the city of Hudson forms a compact area of much stronger color. Thin lines extend outward along roads, and smaller clusters mark other settlements and developed sites.
The supplied summary reports mean imperviousness of 1.96 percent, with 0.85 percent of the county mapped at 50 percent impervious or greater. Developed cover, by comparison, is 10.30 percent. Those figures should not be expected to match. A developed land-cover class can include lawns, trees, and other permeable surfaces, while the impervious layer focuses on the sealed portion of the landscape.
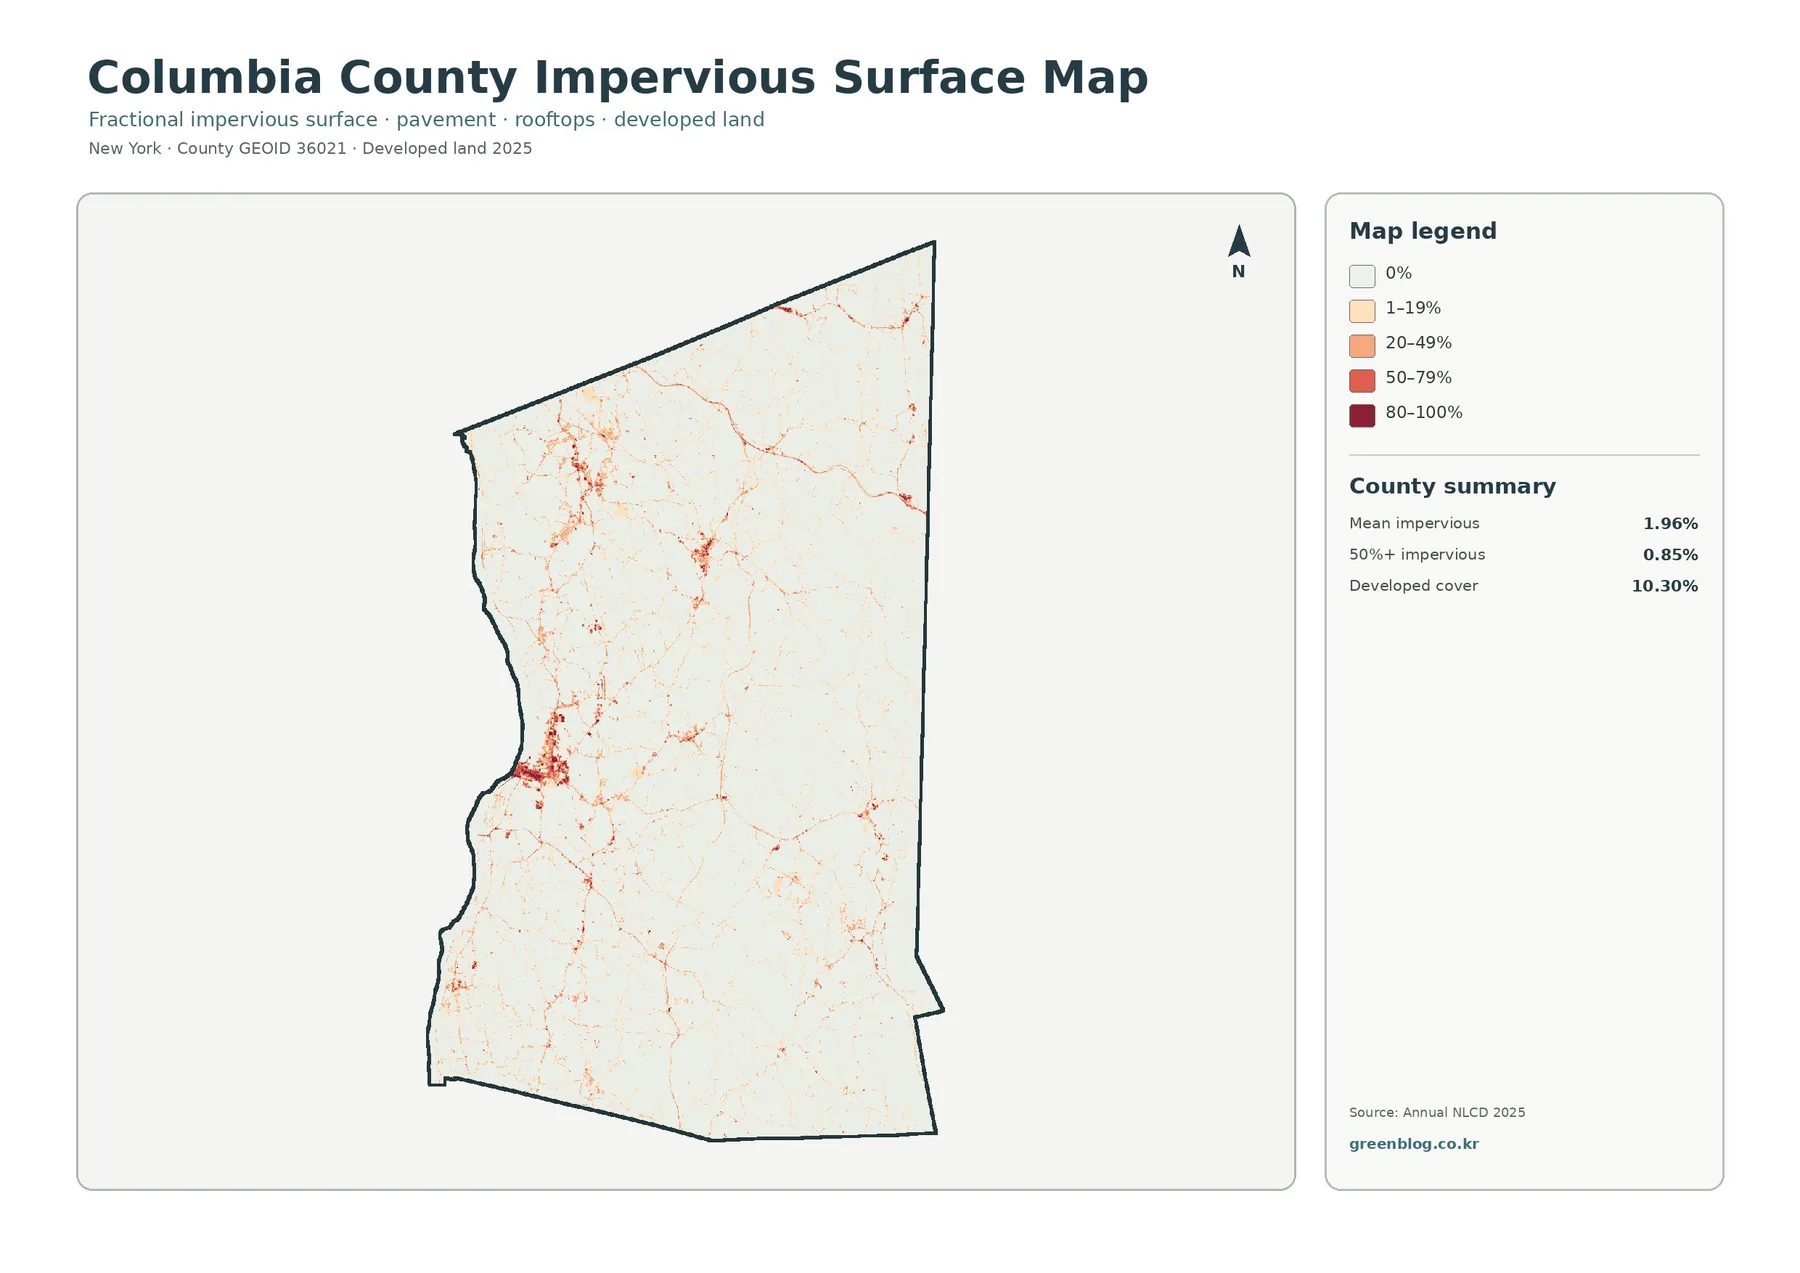
This view is useful because it reveals development form that can be difficult to separate on the general land-cover map. Roads emerge as narrow linear features, while denser built areas stand out as compact clusters. In a stormwater lesson, those patterns can be compared with nearby streams and wetlands. In a planning presentation, the same map can illustrate where built surfaces are concentrated without implying that every developed pixel has the same intensity.
The layer cannot determine drainage performance, flood risk, or site-level runoff on its own. Those questions depend on additional factors such as slope, soil, storm drains, channel capacity, rainfall, and local topography. It is best treated as a countywide screening map rather than an engineering analysis.
What changed between the 1985 and 2025 classifications
The fourth map compares mapped classes from 1985 with those from 2025. A class difference is shown across 10.51 percent of Columbia County. The summary identifies 1.58 percent as change to developed cover, 0.95 percent as forest loss, and 0.61 percent as agricultural loss. Another 7.18 percent falls into the broader category of other class difference, which is the largest component of the mapped change total.
Change colors are scattered through the county instead of forming a single continuous front. Western and central areas contain many small differences among the agricultural and mixed-cover landscape. Patches classified as change to developed land also appear near Hudson and along selected settlement and transportation corridors. The eastern forested portion has fewer large concentrations, although small differences are still visible.
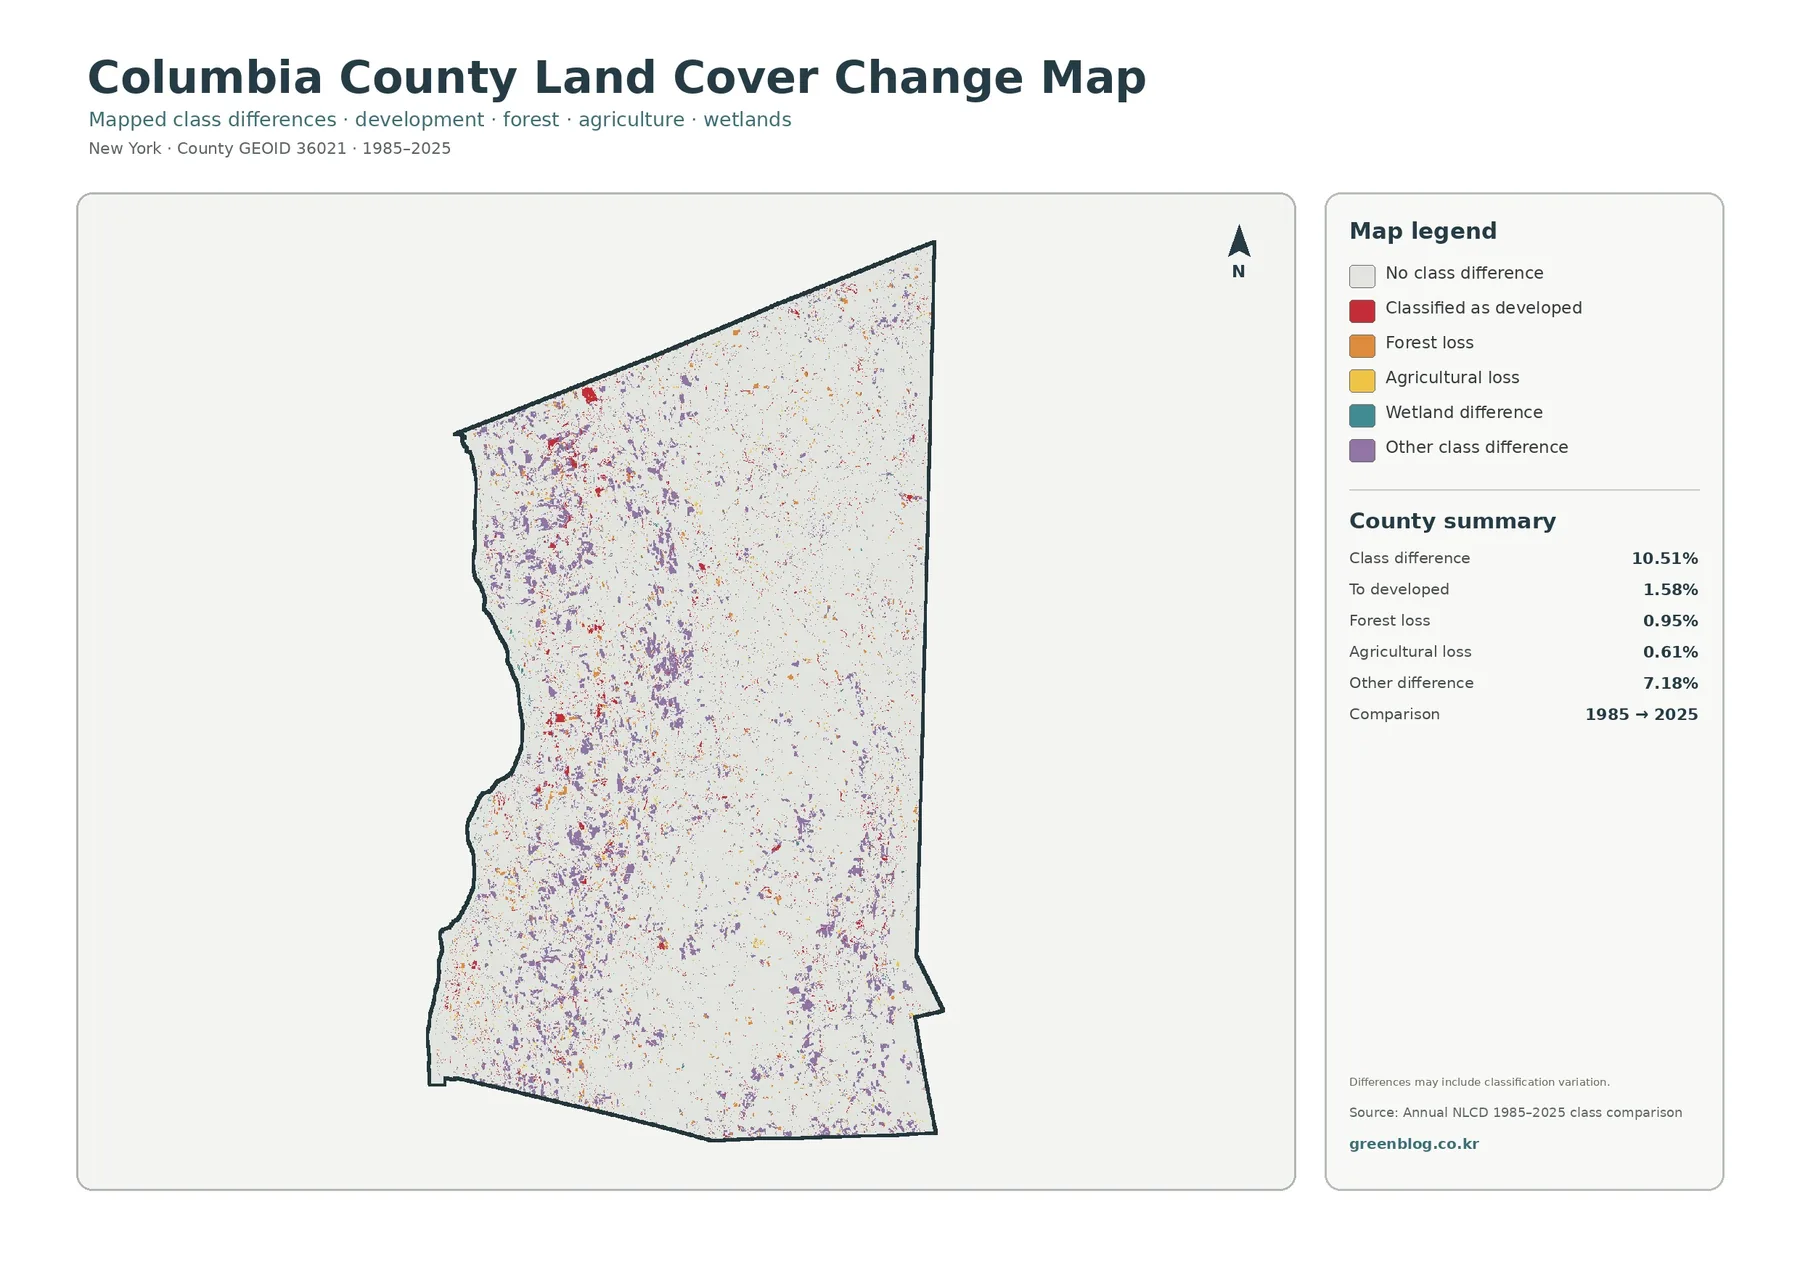
A colored change pixel is not automatically proof of a specific land-use event. Differences can reflect genuine conversion, but they can also be influenced by imagery, classification methods, mixed pixels, or small boundary shifts between classes. The map therefore works best as a guide to places that deserve closer examination rather than as a final record of construction, clearing, or agricultural abandonment.
When a site-specific question arises, begin with the change layer, identify the colored patch, and then inspect the 2025 land-cover map to see its current class. Historical aerial imagery and local records can then be used to determine what actually happened. A two-date map also cannot show every intermediate condition; land may have changed more than once between 1985 and 2025.
Using the four maps as a sequence
The general land-cover map is the best starting point because it establishes the overall geography. Locate the Hudson River, the developed concentration around Hudson, the broad eastern forest, and the agricultural mosaics farther west. The forest-and-farmland map can then simplify the rural landscape and make the relationship between fields and woodland easier to follow.
Next, the impervious map shifts attention from land-cover categories to the intensity and shape of built surfaces. A developed patch that looks substantial on the first map may contain only a small highly impervious core. Finally, the change map adds a time comparison. Keeping that last distinction clear prevents readers from mistaking a present-day class for evidence of when or why a change occurred.
This sequence works well in classrooms and presentations because each image answers a separate question. The first asks what covers the land now. The second asks how forest and agriculture are arranged. The third asks where sealed built surfaces are concentrated. The fourth asks where two mapped years disagree. Together they provide a more useful description of Columbia County than any one map can provide by itself.
Practical uses for planning, education, and comparison
At county scale, land-cover maps are well suited to preliminary planning context, environmental education, watershed study, habitat comparison, and presentation graphics. The consistent Annual NLCD framework also makes it possible to compare Columbia County with neighboring counties without changing the basic legend from one place to another.
A teacher might ask students to explain why the eastern half appears more wooded while agricultural cover is stronger farther west. A conservation discussion could use the map to identify broad forest blocks or wetland-rich areas before consulting more specialized datasets. A community presentation could pair the impervious map with transportation and hydrology layers to show where built surfaces are concentrated.
These uses all depend on maintaining the distinction between a screening map and an authoritative site record. County-scale classification is valuable for recognizing broad patterns, but decisions about a property, permit, regulated wetland, agricultural district, conservation easement, or development proposal require the appropriate official source.
Scale, mixed pixels, and other limitations
Annual NLCD land cover is a raster product commonly interpreted at roughly 30-meter cell scale. A single cell can contain several real surfaces: trees around a house, a narrow road beside a field, or wet ground mixed with forest. The classification assigns a representative class, which means boundaries on the map are generalized rather than surveyed lines.
Mixed pixels matter most where the landscape changes over short distances. Columbia County has many such transitions among fields, woodland, wetlands, roads, and small settlements. A narrow feature may be underrepresented, and a complex edge may shift slightly from one mapped year to another. Those limitations are normal for regional raster mapping and should be considered before making a fine-scale interpretation.
The 2025 map is also a time-specific classification. Construction, clearing, vegetation recovery, crop changes, or wetland conditions after that observation period will not automatically appear. For current planning or property-level work, combine the map with recent imagery, field inspection, and local or state records.
Download the Columbia County map set
The download archive contains four original JPG files: the general land-cover map, forest-and-farmland map, impervious-surface/developed-land map, and the 1985–2025 land-cover-change map. WebP versions are used in the article for efficient viewing, while the JPG files are convenient for offline reference, reports, presentation slides, and print-oriented layouts.
For a concise visual explanation, use the general map first and add only the specialized map that matches the question. For a fuller county profile, all four can be placed in order so the reader moves from present-day cover to rural land patterns, built surfaces, and finally long-term class differences.
Frequently Asked Questions
What is the dominant land cover in Columbia County?
Forest is the largest 2025 class in the supplied summary at 54.09 percent. It is especially extensive in the eastern and southeastern parts of the county, while agriculture is more prominent across many western and central areas.
Why is developed cover higher than the highly impervious area?
Developed land cover can include a mixture of buildings, pavement, lawns, trees, and other surfaces. The impervious layer measures the sealed portion more directly, so land with at least 50 percent impervious surface occupies a much smaller share of the county than the full developed class.
Does the 1985–2025 map prove where land use changed?
No. It records differences between two land-cover classifications. Some differences can represent real changes, while others may reflect imagery, classification variation, mixed pixels, or boundary shifts. A site-specific conclusion requires additional evidence. Map File Information Download the map files associated with this page for reference, printing, and compatible visual projects. Map File Information Download the map files associated with this page for reference, printing, and compatible visual projects.
Map File Information
Download the map files associated with this page for reference, printing, and compatible visual projects.
- Included Files: Use only the versions confirmed in the article and supplied images
- File Type: Use the confirmed download contents
- Intended Use: Printing, education, presentations, and map-based projects
Related Maps
- Albany County Land Cover Map
- Bronx County New York Land Cover Map
- Cattaraugus County New York Land Cover Map
Sources and references
- MRLC Annual NLCD Data — national land-cover datasets and access information.
- USGS Annual NLCD Land Cover Classification — land-cover class definitions and interpretation guidance.
- U.S. Census Bureau TIGER/Line Shapefiles — geographic boundary data for county-scale mapping.
- Columbia County Climate Adaptation & Resiliency Plan — official county planning and environmental context.
Green Map creates custom-edited map images using open geographic data sources such as geoBoundaries, Natural Earth, OpenStreetMap, and government open data.
These maps are edited visual materials, not raw data files, and are provided for education, documents, presentations, and graphic reference.