Hawaii’s population is highly uneven across the islands. The 2024 ACS five-year estimate places the statewide population at 1,445,235, and Honolulu County alone accounts for 1,001,146 residents.
The tract-level density values reinforce that concentration. The highest and most extensive densities occur on Oahu, especially around Honolulu, while dense areas on the other islands are smaller and more separated.
A 2010–2020 Census comparison adds a useful contrast, because the county with the largest current population was not the county with the fastest percentage growth during that decade.
The analysis below relies on the ACS and decennial Census values supplied with the article. The five site-owned graphics remain as optional reference material; no factual claim in the text depends on interpreting image color, symbol size, or shape.
Table of Contents
Three measures tell different stories about Hawaii
| Measure | Value in the supplied material | How to read it |
|---|---|---|
| 2024 state population | 1,445,235 | ACS 2024 five-year estimate |
| Average state density | About 225 people per sq mi | Statewide average across 6,423 sq mi of land |
| Largest county population | Honolulu — 1,001,146 | Total residents, not density |
| Highest county density | Honolulu — about 1,666 people per sq mi | Residents per unit of land |
| Largest 2010–2020 increase | Kauai — +9.3% | Decennial Census percentage change |
| County with decline | Kalawao — -8.9% | Change over the decade, not current size |
Total population answers “how many people,” density answers “how concentrated are they,” and population change answers “how much did the count rise or fall between two dates.” Those measures can point in different directions.
Honolulu County is both the largest and the densest in the supplied 2024 data, but Kauai County had the highest 2010–2020 percentage increase. Hawaii County is second in total population yet much less dense than Maui or Honolulu. Keeping those measures separate is essential when comparing population size, density, and change.
Census tracts show where Oahu’s population is most concentrated
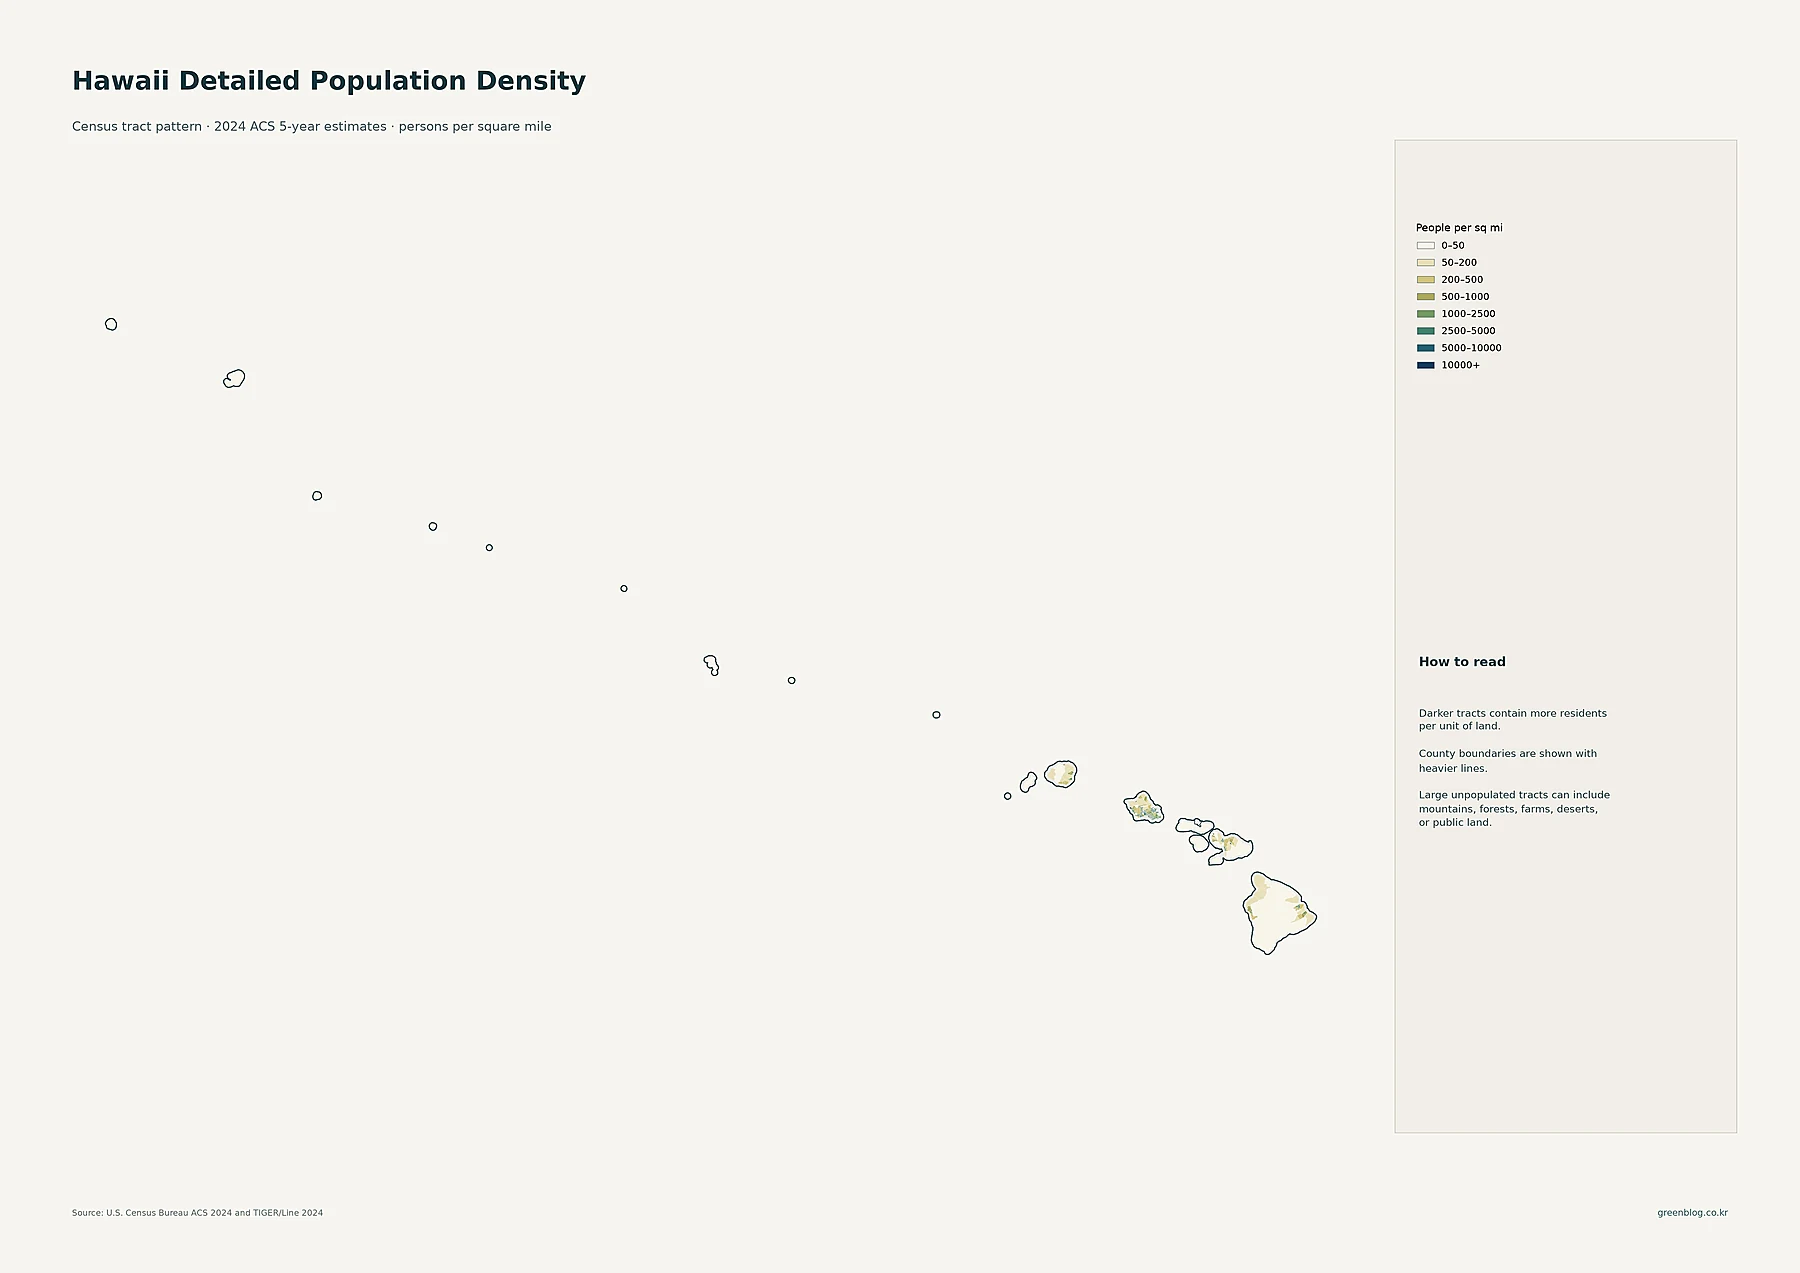
The tract-density data are grouped into bands from 0–50 people per square mile through 50–200, 200–500, 500–1,000, 1,000–2,500, 2,500–5,000, 5,000–10,000, and 10,000 or more. These categories provide a consistent way to compare local concentration across the islands.
The highest-density tracts are concentrated on Oahu, with the strongest concentration in the southern part of the island around Honolulu and adjoining urban areas.
On Hawaii Island, higher-density tracts occur around Hilo and other settled areas while much of the island remains sparsely populated. Maui and Kauai also have localized population concentrations rather than uniformly high density across the whole island.
This illustrates the difference between tract statistics and a county average. A county can have a moderate average density even when one town or coastal settlement is much more densely populated than the rest of the county.
Large low-density tracts can include mountains, forests, deserts, or public land, so tract density should not be treated as a direct explanation of why settlement occurs in a particular place. It measures concentration, not cause.
Taken as tract statistics, the figures indicate that Hawaii’s highest-density areas are disproportionately concentrated on Oahu, while density on the other islands is more localized.
Urban Honolulu leads the census-place totals
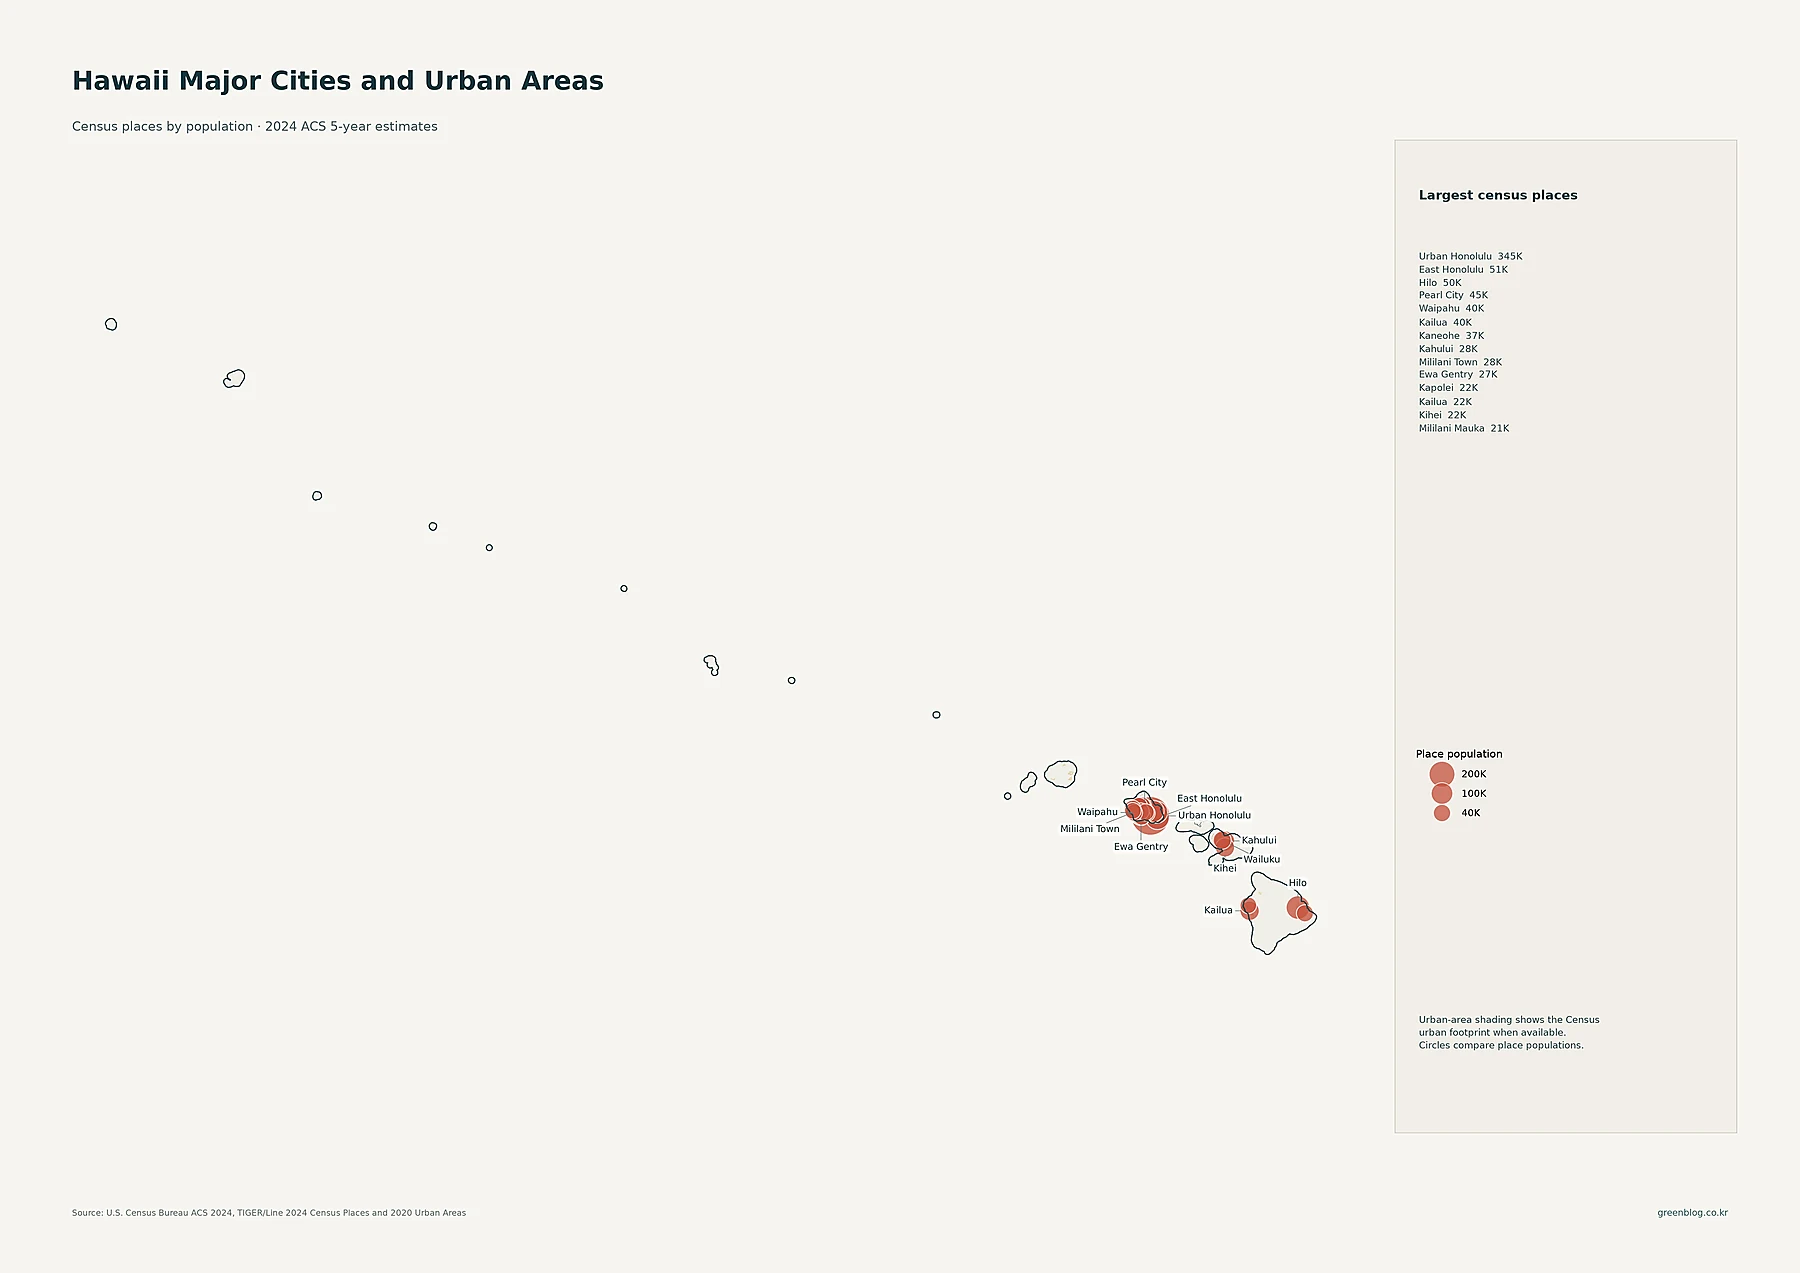
Urban Honolulu is the largest census place in the supplied data at 345,482 residents. East Honolulu follows with 51,360, Hilo with 50,404, Pearl City with 44,547, Waipahu with 40,482, Kailua with 39,640, and Kaneohe with 37,355.
Kahului has 28,288 residents, Mililani Town 27,668, and Ewa Gentry 26,563. Kapolei is listed at 22,232, Kihei at 21,567, and Mililani Mauka at 21,278.
Many of Hawaii’s larger census places are close together on Oahu: Urban Honolulu, East Honolulu, Pearl City, Waipahu, Kailua, Kaneohe, Mililani Town, Ewa Gentry, Kapolei, and other places form a dense network on a relatively small island.
These figures are census-place population totals. Hilo is the most prominent labeled center on Hawaii Island, while Kahului and Kihei stand out on Maui. Place population should not be confused with county totals or population density.
County totals make Honolulu’s scale unmistakable
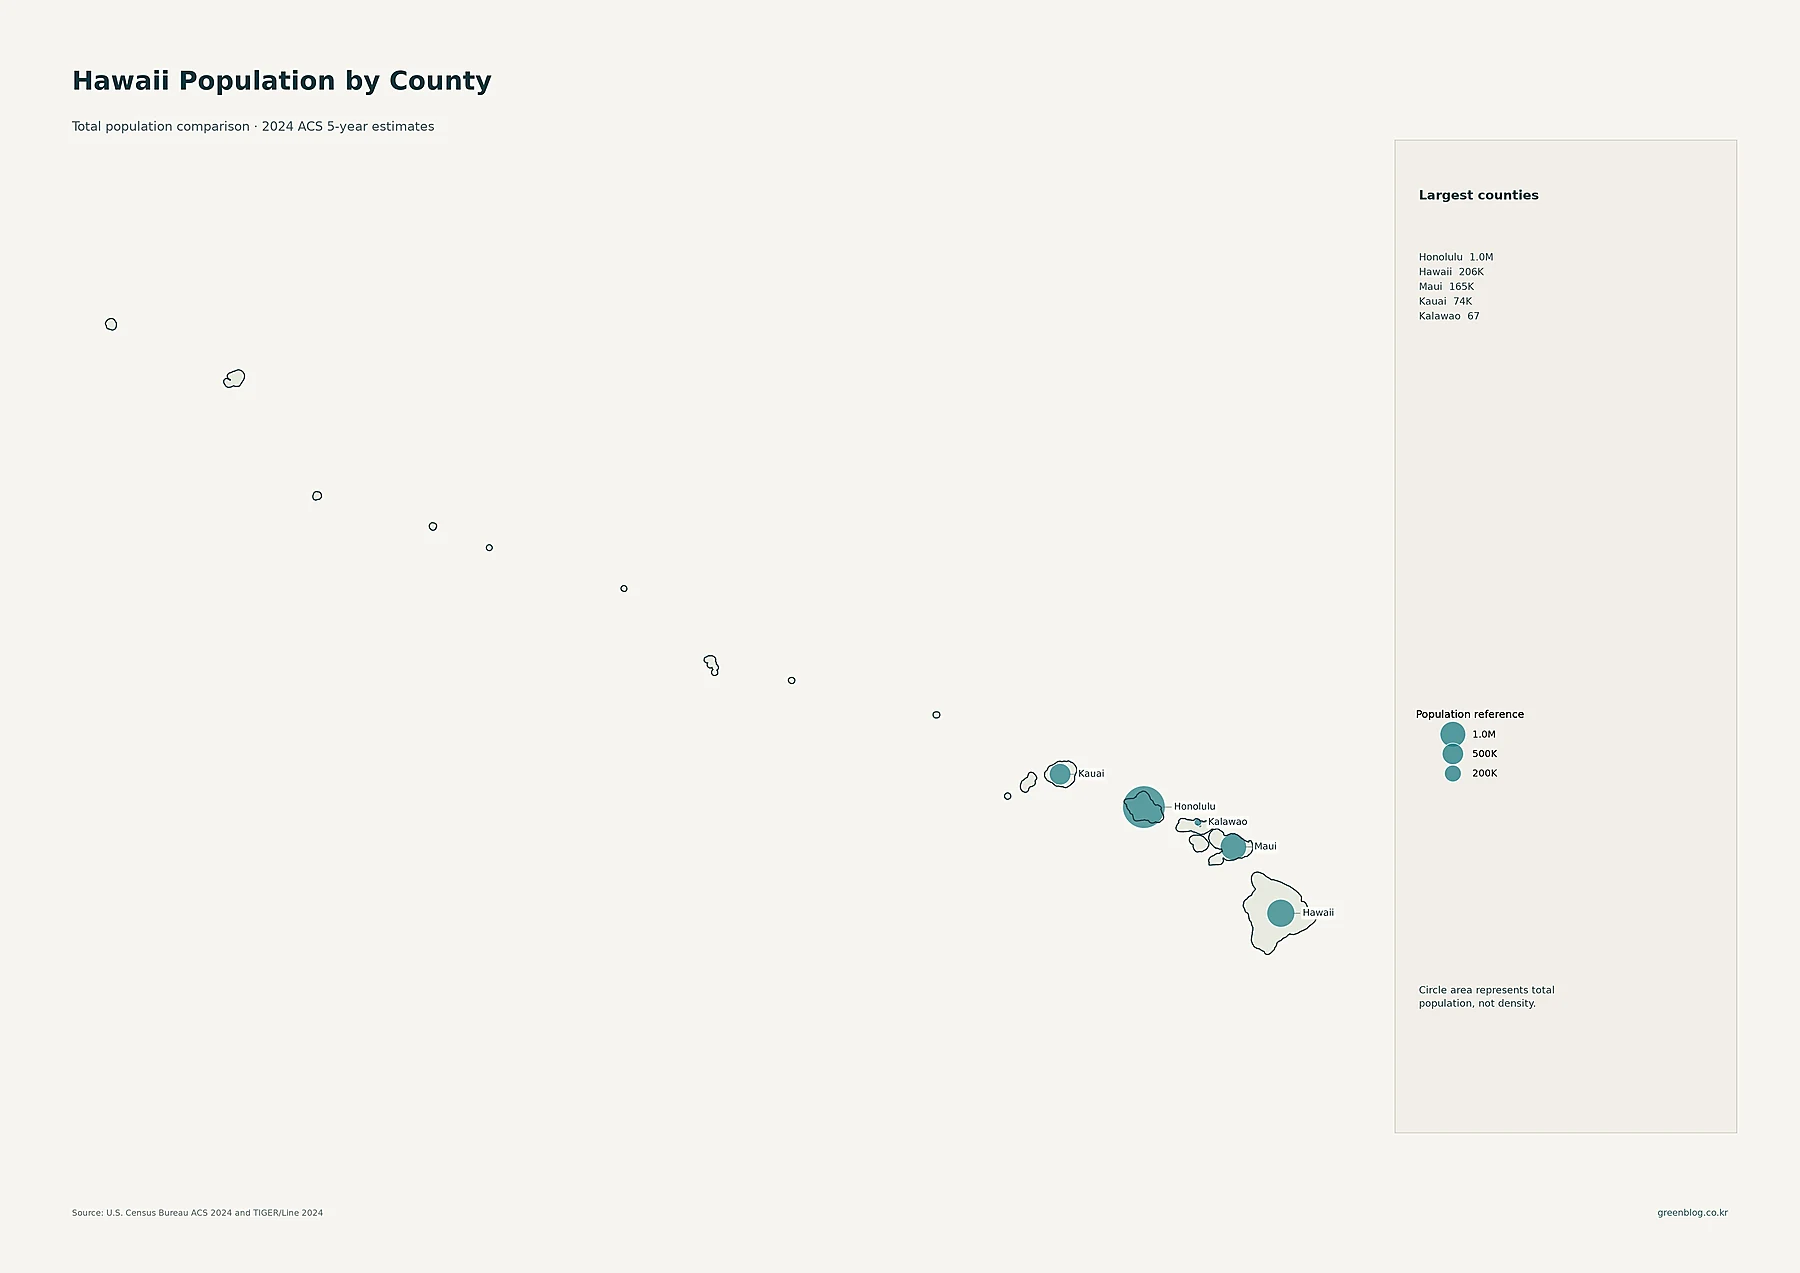
Honolulu County has 1,001,146 residents in the 2024 ACS data. Hawaii County is a distant second at 205,769, followed by Maui County at 164,522 and Kauai County at 73,731. Kalawao County has 67 residents.
Honolulu County’s population total is dramatically larger than the totals for the other counties in the supplied 2024 data. That difference is a statement about the number of residents, not about density.
Hawaii County illustrates why population size and density must be separated: it has the second-largest county population but covers a much larger land area, so its average density is far below Honolulu County’s.
County population totals answer how many people live in each county. County density answers how closely those residents are distributed across the available land. The two measures should be compared separately.
County density separates Oahu from the larger, less dense islands
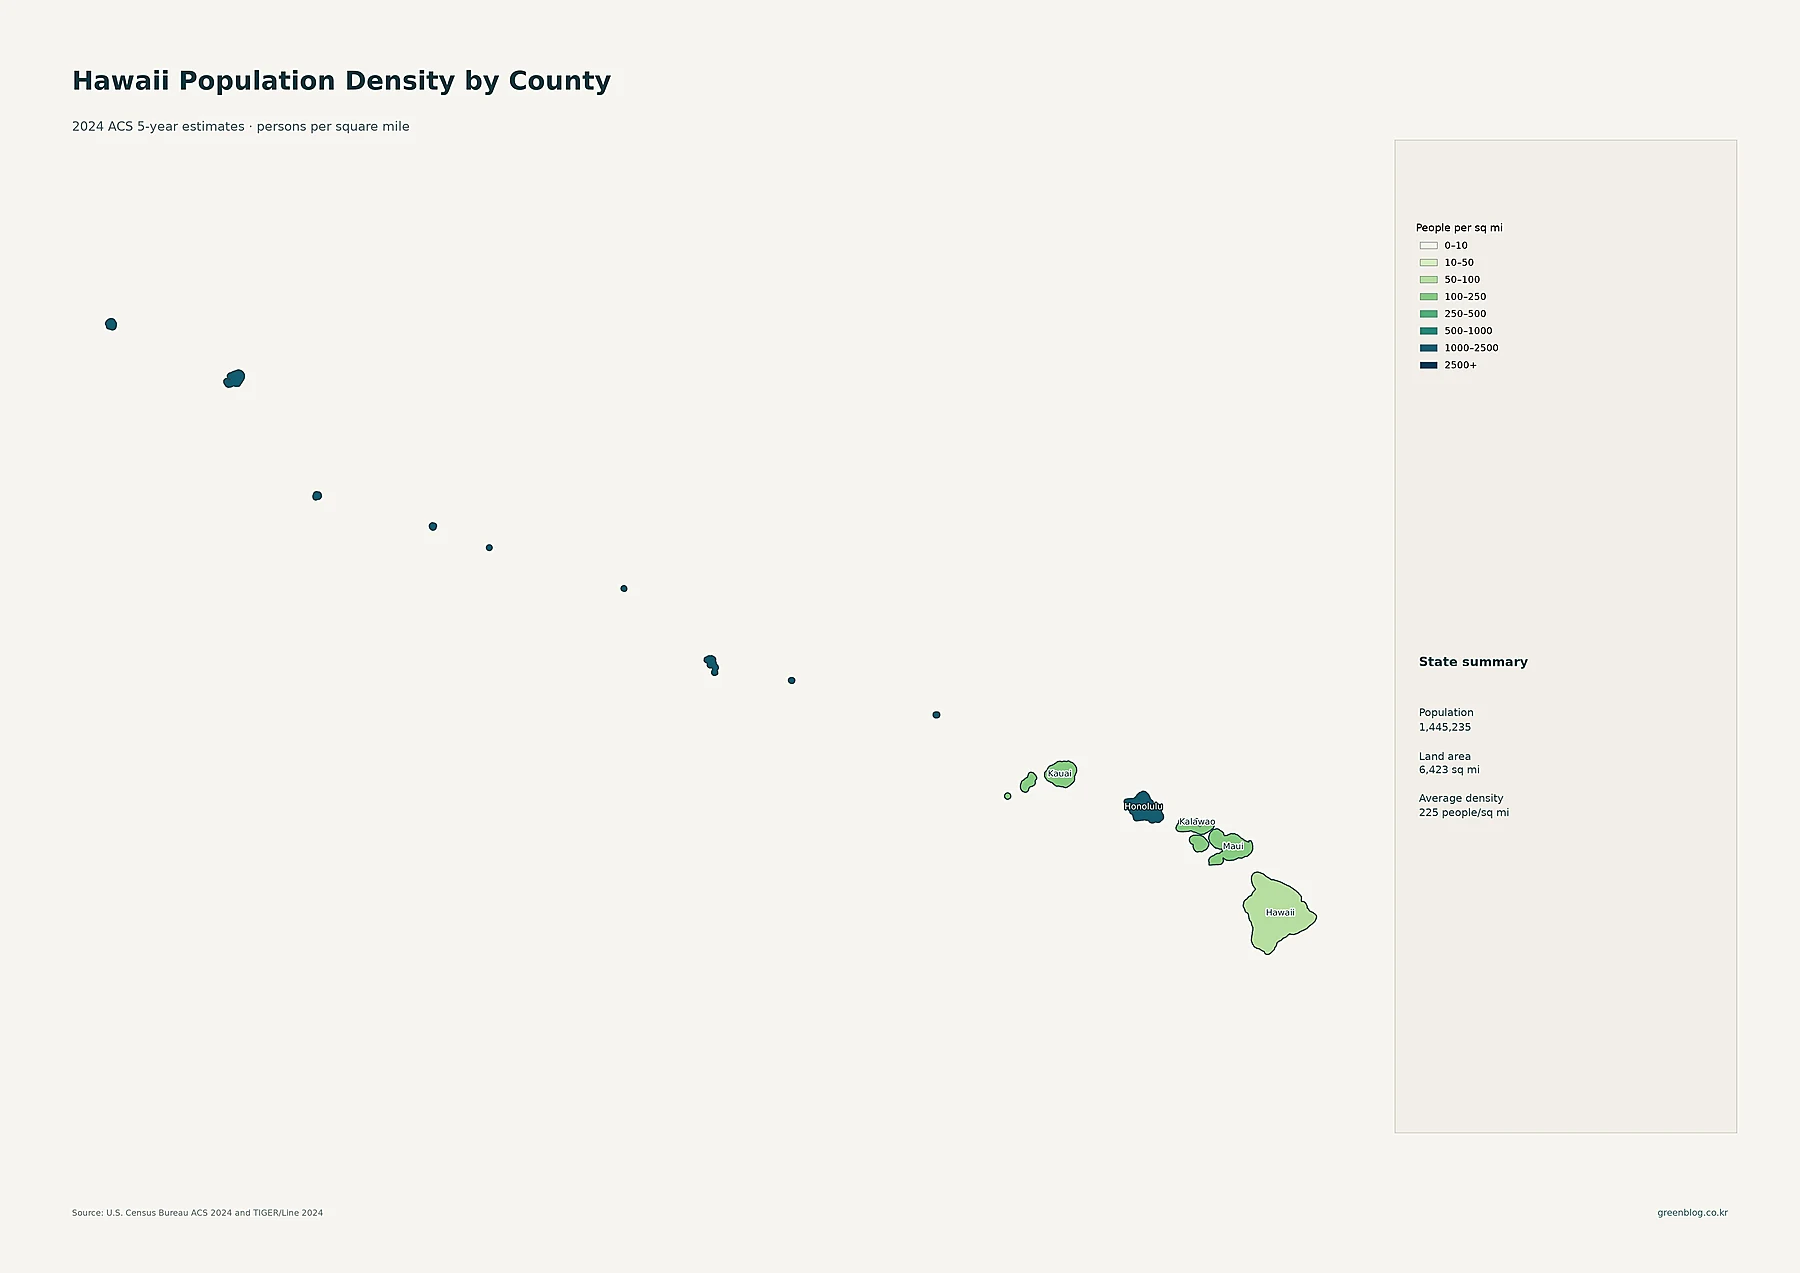
Honolulu County has the highest county-average density at roughly 1,666 people per square mile. The difference between Honolulu and the other counties is large enough that a statewide average alone gives a poor picture of island-level settlement.
Maui is about 142, Kauai about 119, Hawaii County about 51, and Kalawao about 5.6. Honolulu therefore has an average density more than ten times that of Maui and far above the larger Hawaii County.
The supplied state summary reports 1,445,235 residents, 6,423 square miles of land, and an average density of about 225 people per square mile. That statewide average is useful for broad context, but it does not describe any single island particularly well.
The statewide average sits far below Honolulu County and above Hawaii County. Tract-level values add another scale of detail by showing that population concentration varies substantially within individual counties.
Kauai had the fastest 2010–2020 county growth
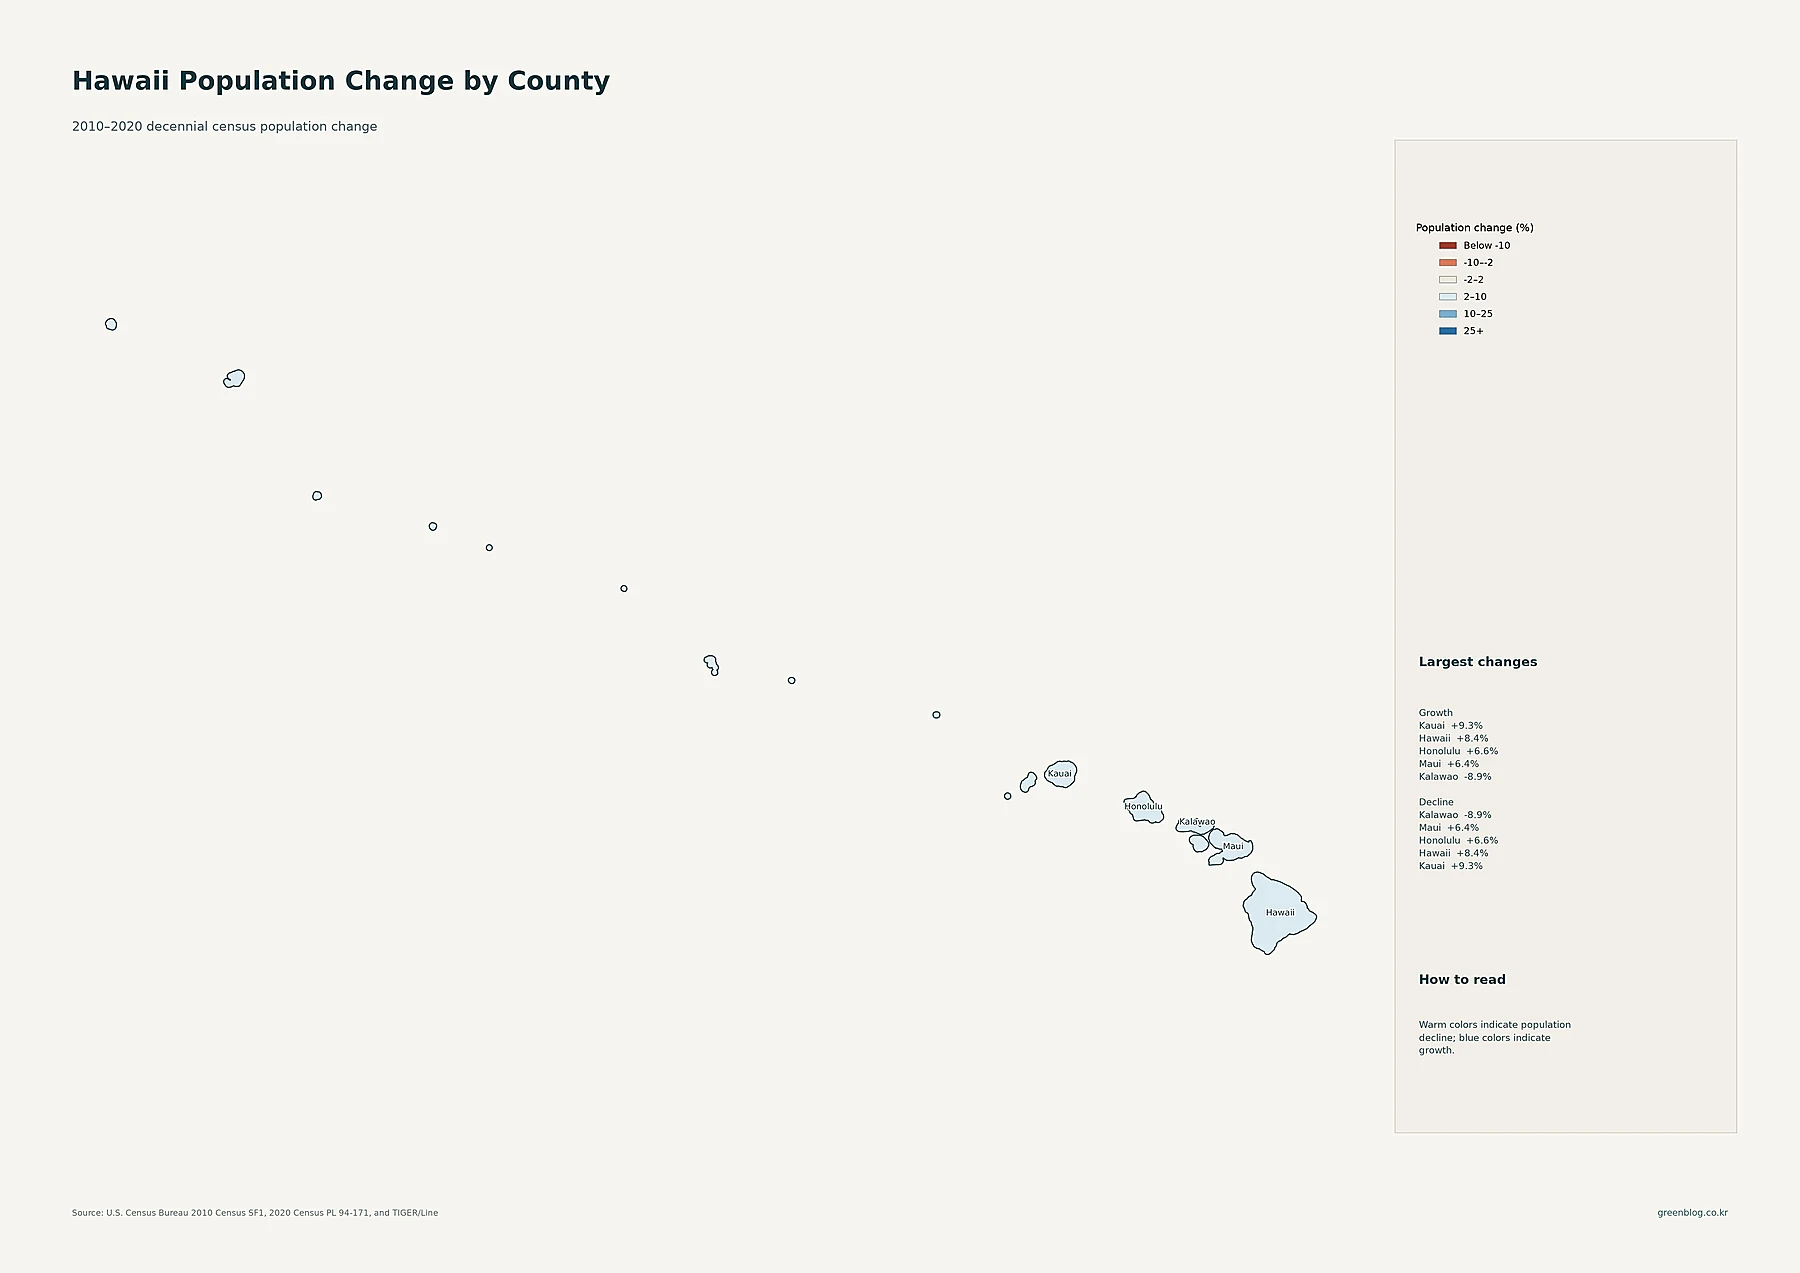
The 2010–2020 series uses decennial Census counts rather than the 2024 ACS estimates. It measures percentage population change between the two censuses, so it should not be mixed with the later current-population estimates.
Kauai County rose from 67,091 residents in 2010 to 73,298 in 2020, a gain of about 9.3%. Hawaii County increased from 185,079 to 200,629, or about 8.4%.
Honolulu County grew from 953,207 to 1,016,508, about 6.6%, while Maui County rose from 154,834 to 164,754, about 6.4%. Kalawao County declined from 90 to 82 residents, or -8.9%.
The ranking is a useful reminder that the fastest percentage growth does not necessarily occur in the county with the most people. Honolulu was vastly larger in absolute population, but Kauai posted the highest percentage increase over the decade.
What the island-by-island comparison reveals
Taken together, the county population, county density, census-place, tract-density, and historical-change measures make Oahu’s role clear. Honolulu County combines the state’s largest county population with its highest countywide density, and the densest tract-level concentrations are also centered on Oahu.
Multiple independent measures therefore point to the same broad spatial fact: Hawaii’s population is strongly concentrated on Oahu.
The other islands still differ meaningfully from one another. Hawaii County has 205,769 residents but averages only about 51 people per square mile. Maui County has fewer residents, 164,522, yet a substantially higher density of about 142.
Kauai County has 73,731 residents and density around 119, while recording the fastest 2010–2020 percentage growth. Those contrasts are why no single measure can answer every population question. County totals, density, place population, and decade-long change each describe a different aspect of settlement.
Download and use the Hawaii population map set
Use tract-density figures when the goal is to compare fine-grained concentration within the islands. Use county totals to compare how many people live in each county, county density to compare residents per unit of land, and census-place totals to compare named population centers.
For historical change, use the 2010–2020 decennial Census series and keep that period clearly separated from the 2024 ACS estimates used for current population and density.
Hawaii population map collection
The ZIP package contains high-resolution JPG versions of the population maps shown above.
FAQ
Which Hawaii county has the highest population density?
Honolulu County is highest in the supplied 2024 ACS five-year data at about 1,666 people per square mile. Maui is about 142, Kauai about 119, Hawaii County about 51, and Kalawao about 5.6.
Is Honolulu also Hawaii’s most populous county?
Yes. Honolulu County has 1,001,146 residents in the supplied 2024 ACS estimate, far more than Hawaii County at 205,769. Total population and density are still separate measures even though Honolulu ranks first in both here.
Which Hawaii county grew fastest from 2010 to 2020?
Kauai County had the largest percentage increase at about +9.3%. Hawaii County grew about +8.4%, Honolulu +6.6%, and Maui +6.4%, while Kalawao declined by about -8.9%.
Related Maps
Official data sources
- U.S. Census Bureau — American Community Survey (ACS): framework for the 2024 five-year population and density estimates.
- U.S. Census Bureau — TIGER/Line Shapefiles: geographic boundaries for counties, census tracts, and related mapping.
- U.S. Census Bureau — Decennial Census: basis for the 2010 and 2020 county population-change comparison.
Green Map creates custom-edited map images using open geographic data sources such as geoBoundaries, Natural Earth, OpenStreetMap, and government open data. These maps are edited visual materials, not raw data files, and are provided for education, documents, presentations, and graphic reference.