The Carroll County Arkansas Land Cover Map set for 2025 makes one county-scale contrast immediately visible: forest dominates much of the western side, while agriculture covers broad areas across the north and east. The county summary reports 50.82% forest and 40.08% agriculture, leaving developed land, water, grassland, shrubland, and wetlands as much smaller shares. Those percentages are useful, but the four maps are more informative when the location of each cover type is compared rather than treated as a single county average.
This page includes four views of the same county: general land cover, forest and farmland, impervious/developed land, and a 1985–2025 land-cover change comparison. The four original JPG maps are available together in one download after the map explanations. They can be used for printing, class materials, presentations, or as a county-scale reference when a labeled parcel or zoning map would be more detail than the task requires.
Table of Contents
A county where wooded hills meet broad farm country
Carroll County’s official website places the county in the Ozarks and the foothills of the Boston Mountains. It also identifies Berryville and Eureka Springs as the two county seats, with the Kings River forming the natural line between the county’s eastern and western districts. That local description fits the broad setting in which the land-cover maps should be read: this is not a uniformly wooded county and not a uniformly agricultural one. The maps show a strong west-to-east change, plus a mixed southern area where forest and agricultural cover interlock in smaller patches.
The county website also highlights Beaver Lake, Table Rock Lake, and the Kings River. Water occupies only 1.47% of the 2025 land-cover summary, yet blue areas along the western and northern margins are visually important because they break up large forest and farm zones. A land-cover map does not label every stream or reservoir, so named water features should be confirmed on a hydrography or reference map. Here, the water pixels are most useful for understanding what kinds of cover surround the county’s larger water settings.
The 2025 land-cover map shows the countywide pattern first
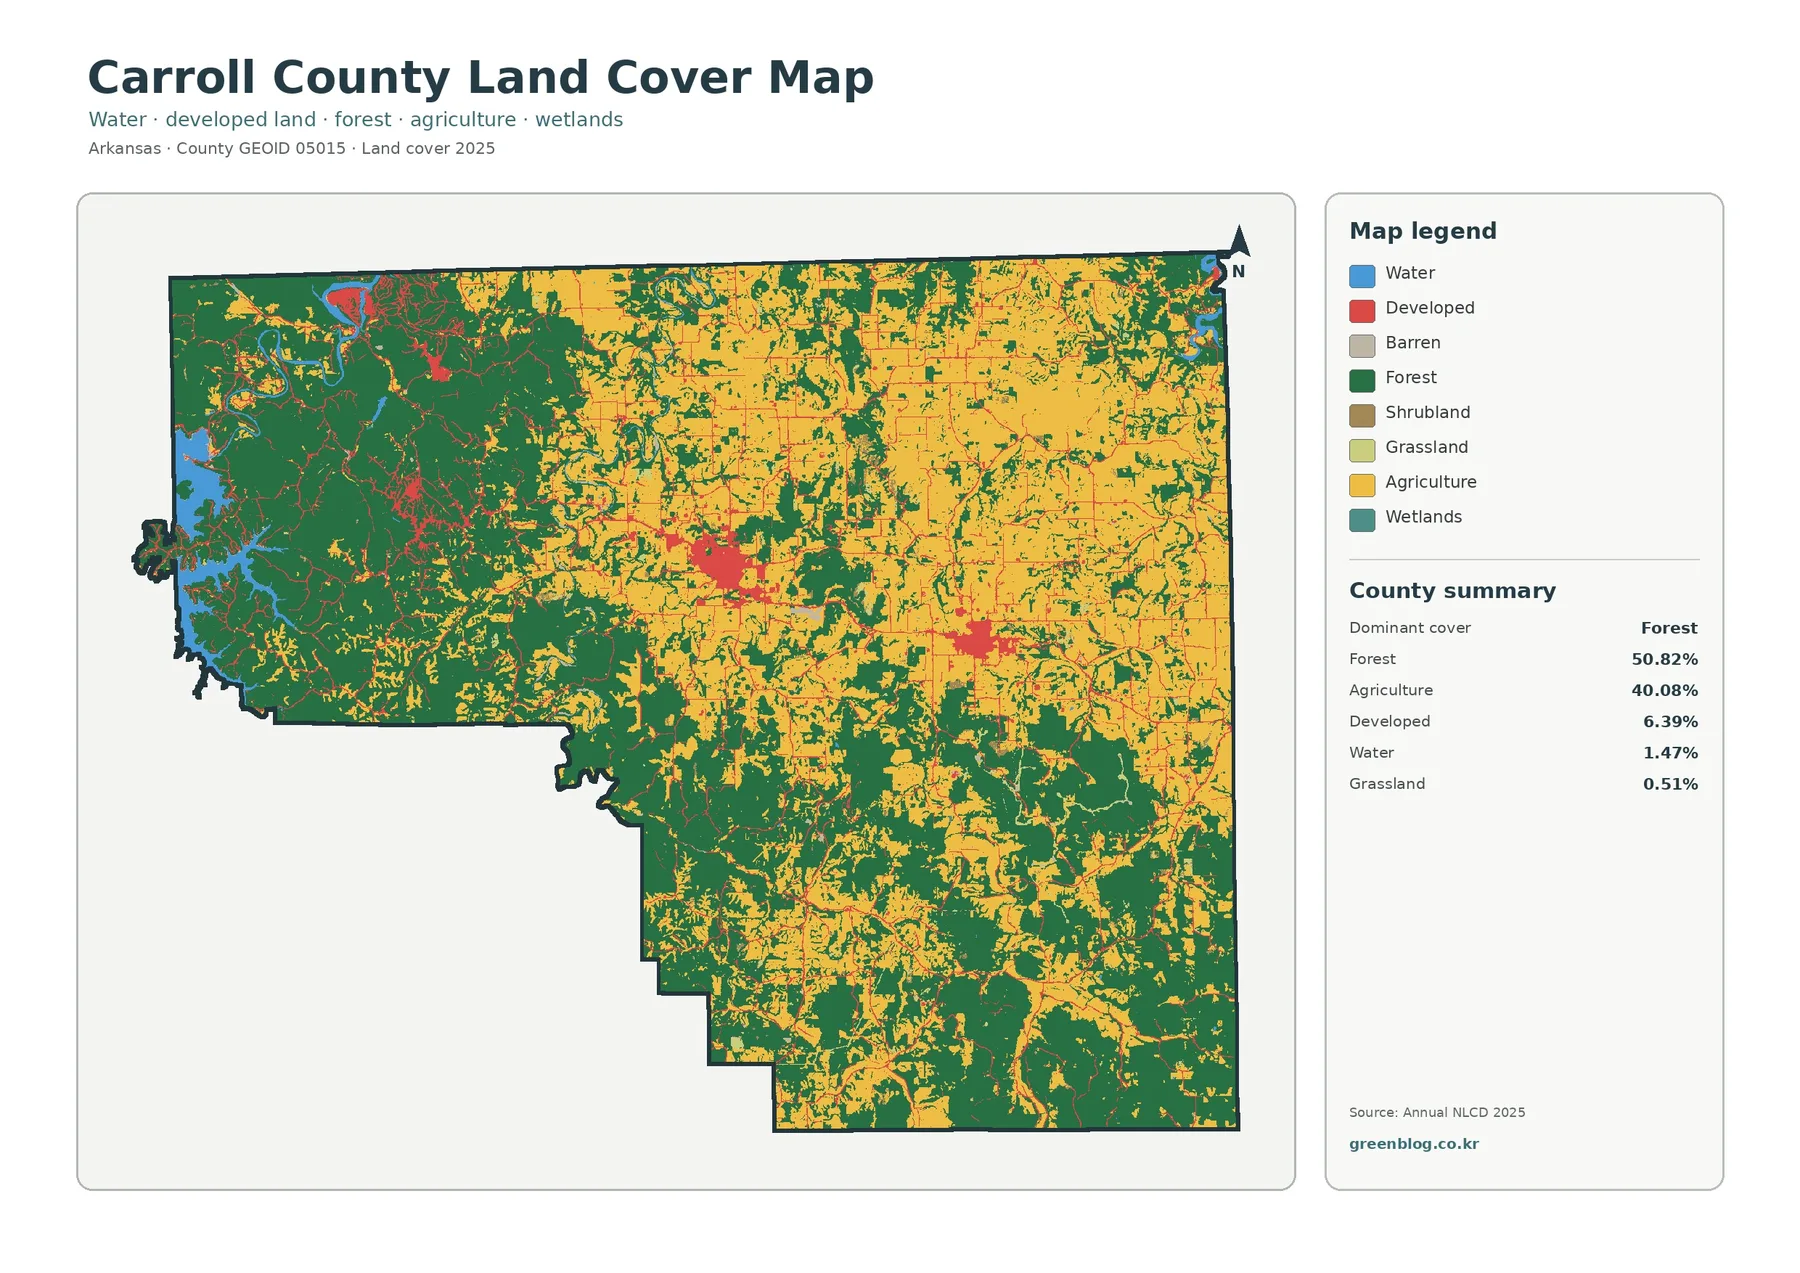
Forest is the largest class at 50.82%, but it is not spread evenly. Dark green forms broad, connected areas across the west and remains common through the south. Agriculture, shown in yellow, becomes much more extensive in the northern and eastern parts of the county. In the middle and southeast, the two classes form a patchwork instead of a clean boundary. This arrangement matters because a countywide percentage can make 50% forest and 40% agriculture sound evenly mixed when the map shows that each cover type is much more dominant in some areas than in others.
Forest and farmland become easier to separate in the second view
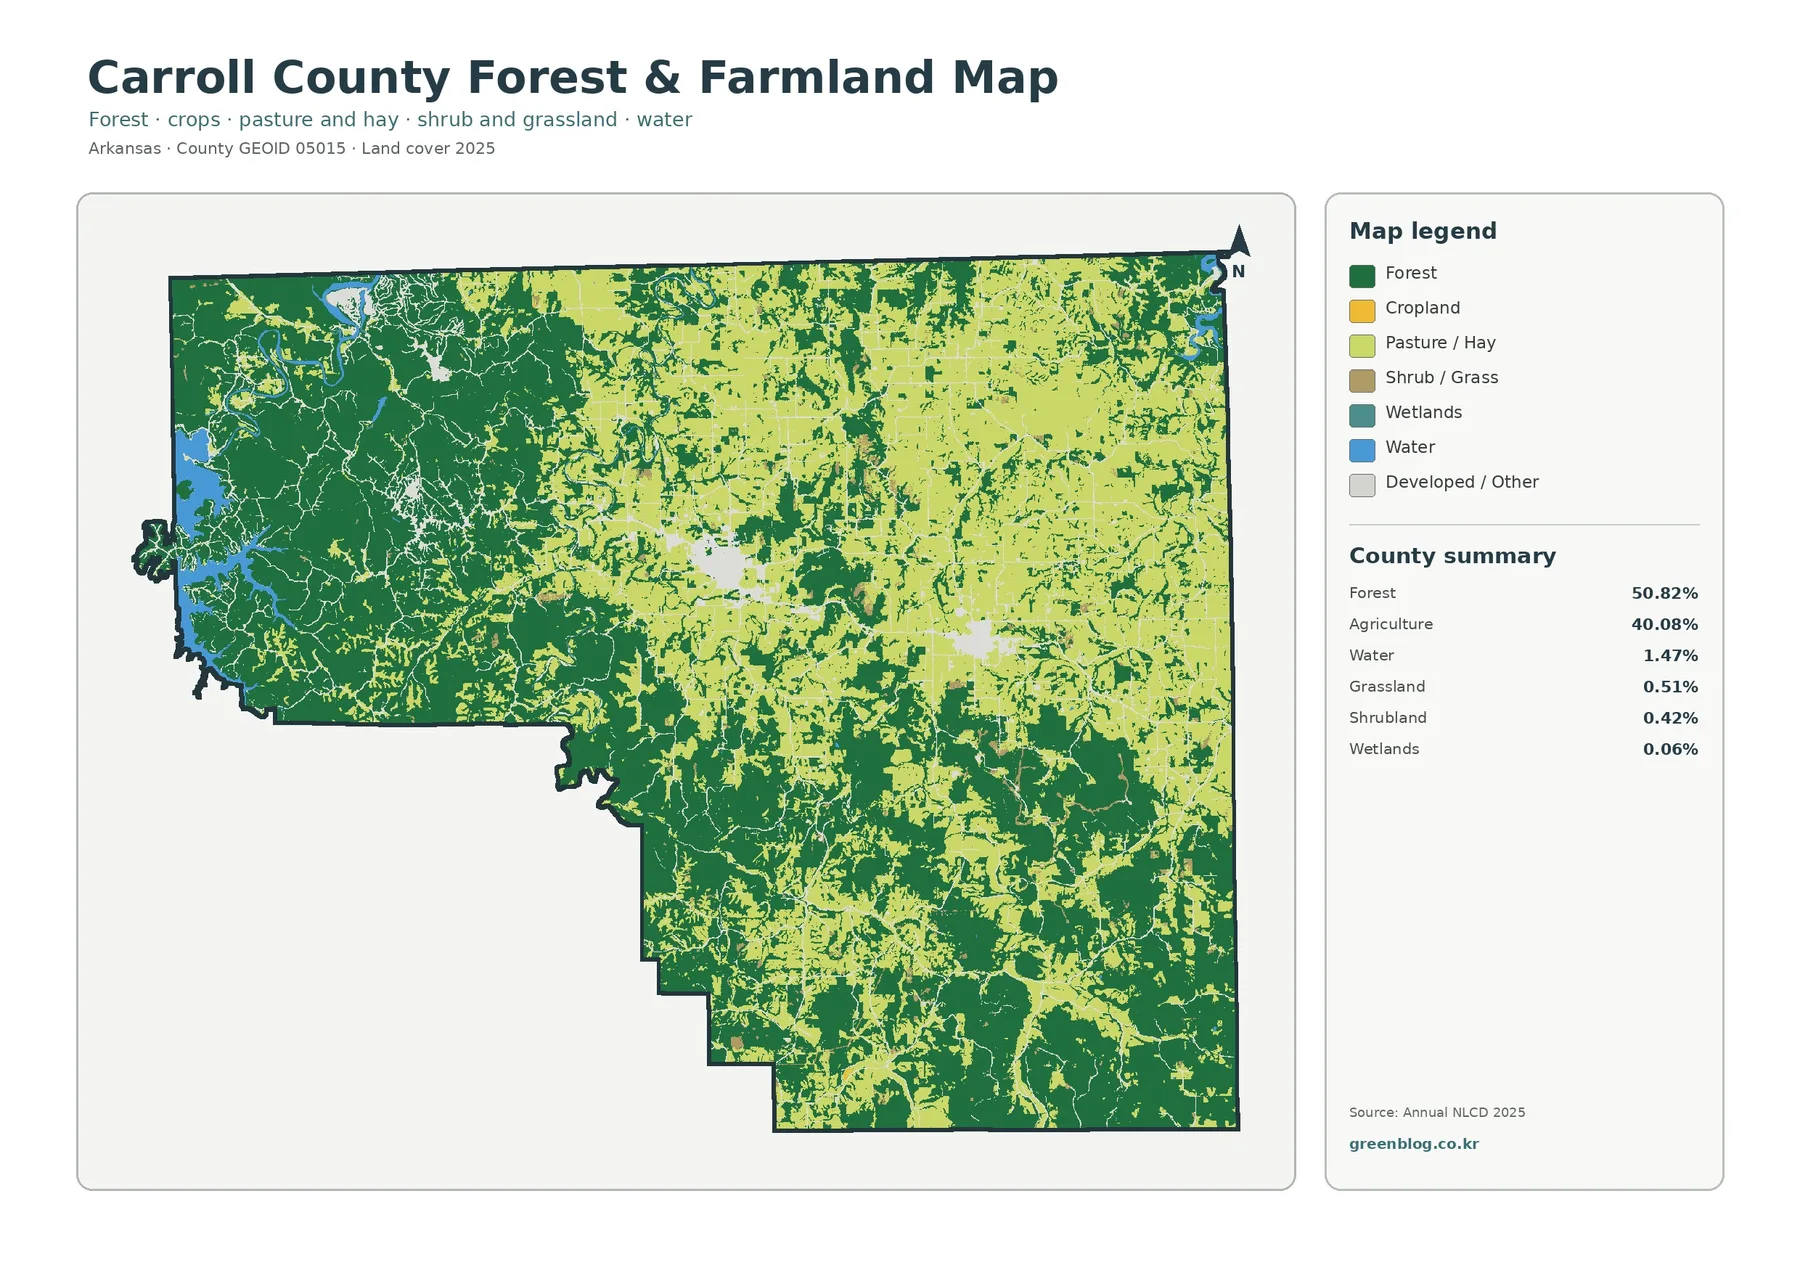
The forest-and-farmland map separates agricultural cover into more readable groups instead of treating all agriculture as one color. Much of the open land across the north and east appears as pasture or hay, with smaller cropland areas mixed into that wider agricultural matrix. The west remains strongly forested. Farther south, neither class forms one continuous block; farm openings and wooded areas alternate, creating a more fragmented pattern than the broad northern farm belt or western forest zone.
Impervious surface pinpoints where hard development is concentrated
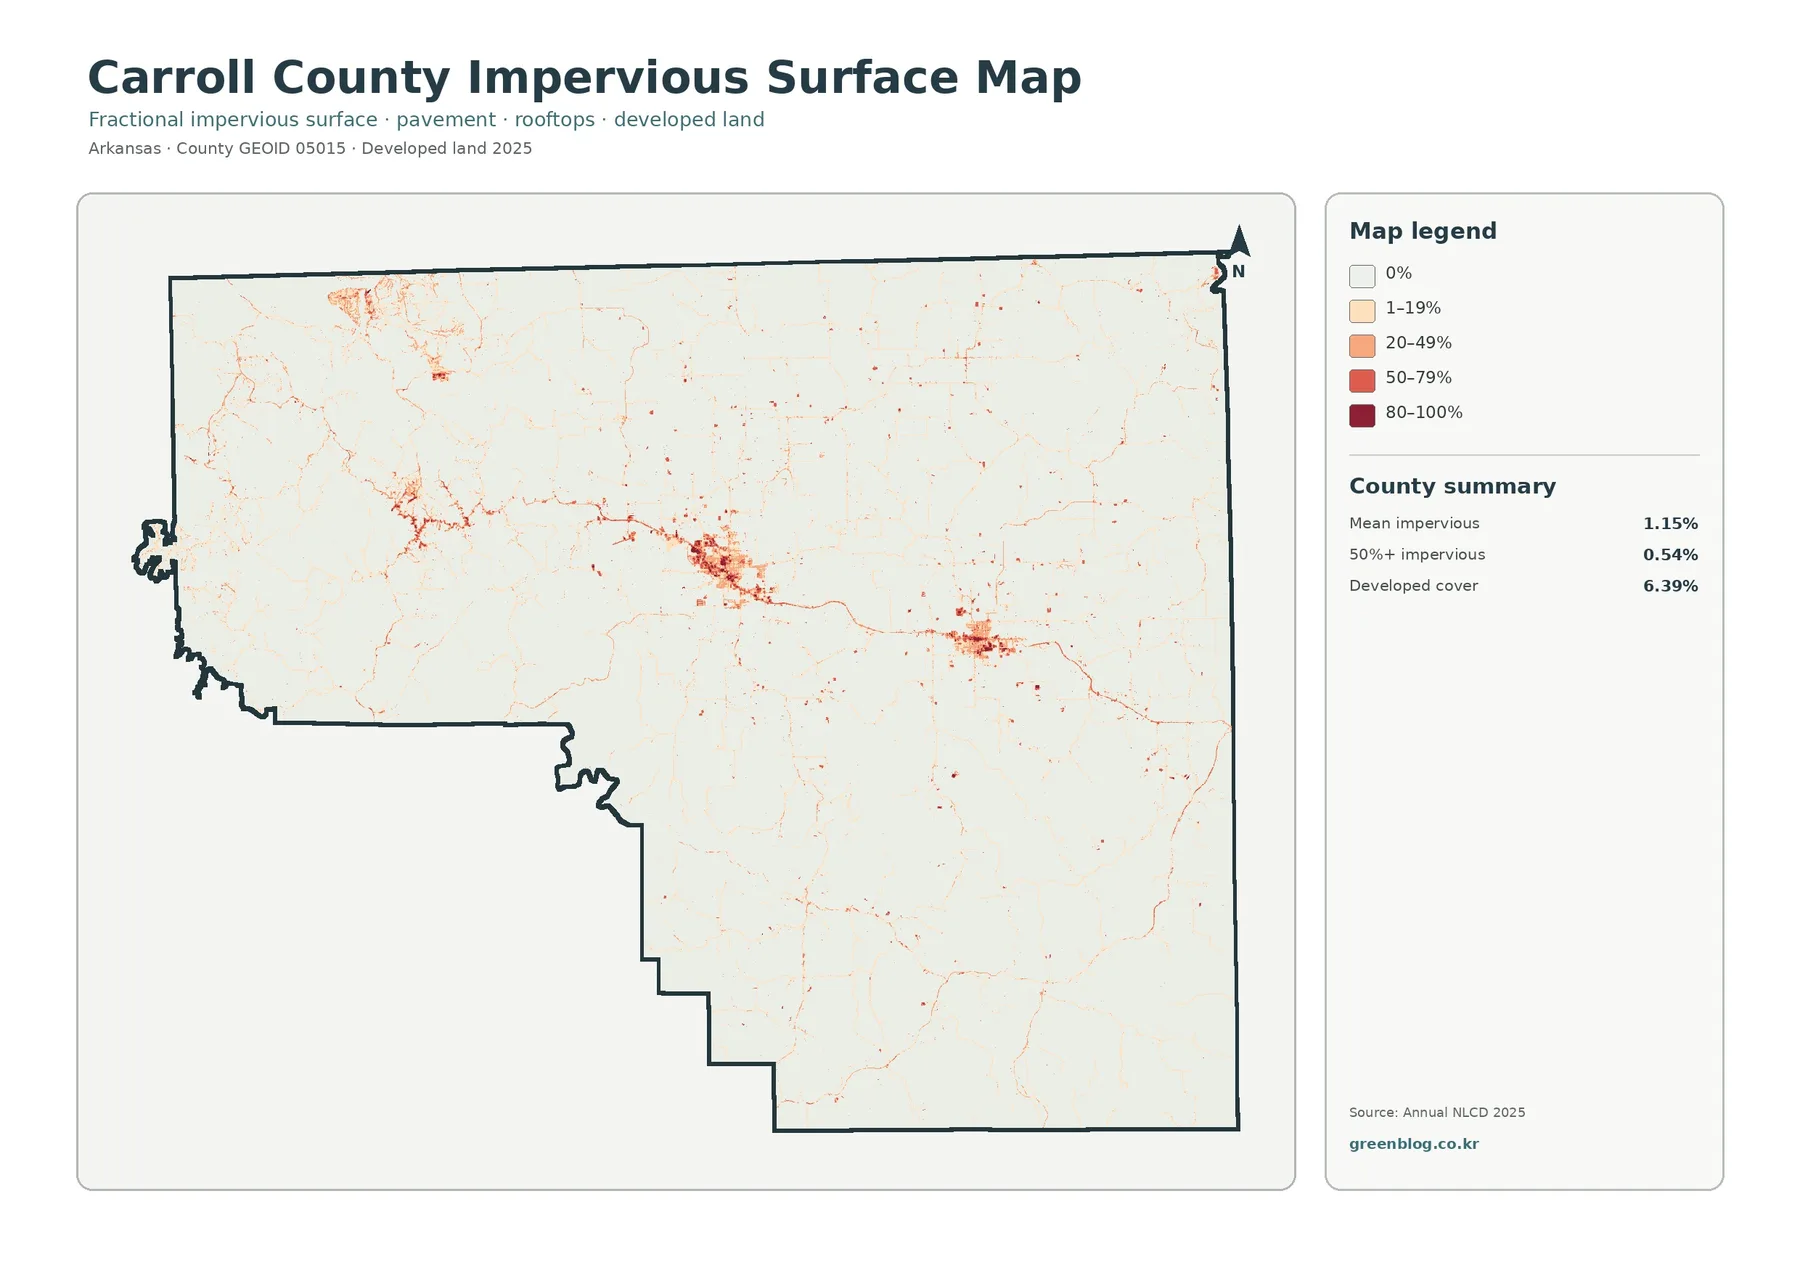
Impervious surface means a hard surface such as pavement, a rooftop, or a parking area where water does not readily soak into the ground. In this map, most of Carroll County is very pale, while stronger orange and red tones gather in a few compact centers and along thin connecting lines. Those brighter areas contrast sharply with the extensive forest and agricultural land that dominates the other two maps. The pattern is concentrated rather than countywide.
The county summary gives a mean impervious value of 1.15% and says 0.54% of the county is mapped at 50% or more impervious surface. Developed land, however, is 6.39% in the general land-cover map. The numbers differ because they measure different things. A developed land-cover class can include lower-density areas where lawns or other vegetation are mixed with buildings and roads, while the impervious product focuses on the fraction of a cell covered by hard surfaces. Reading both maps together separates the footprint of development from the hardest-surfaced portions of that development.
The 1985–2025 comparison maps class differences, not a simple net-loss total
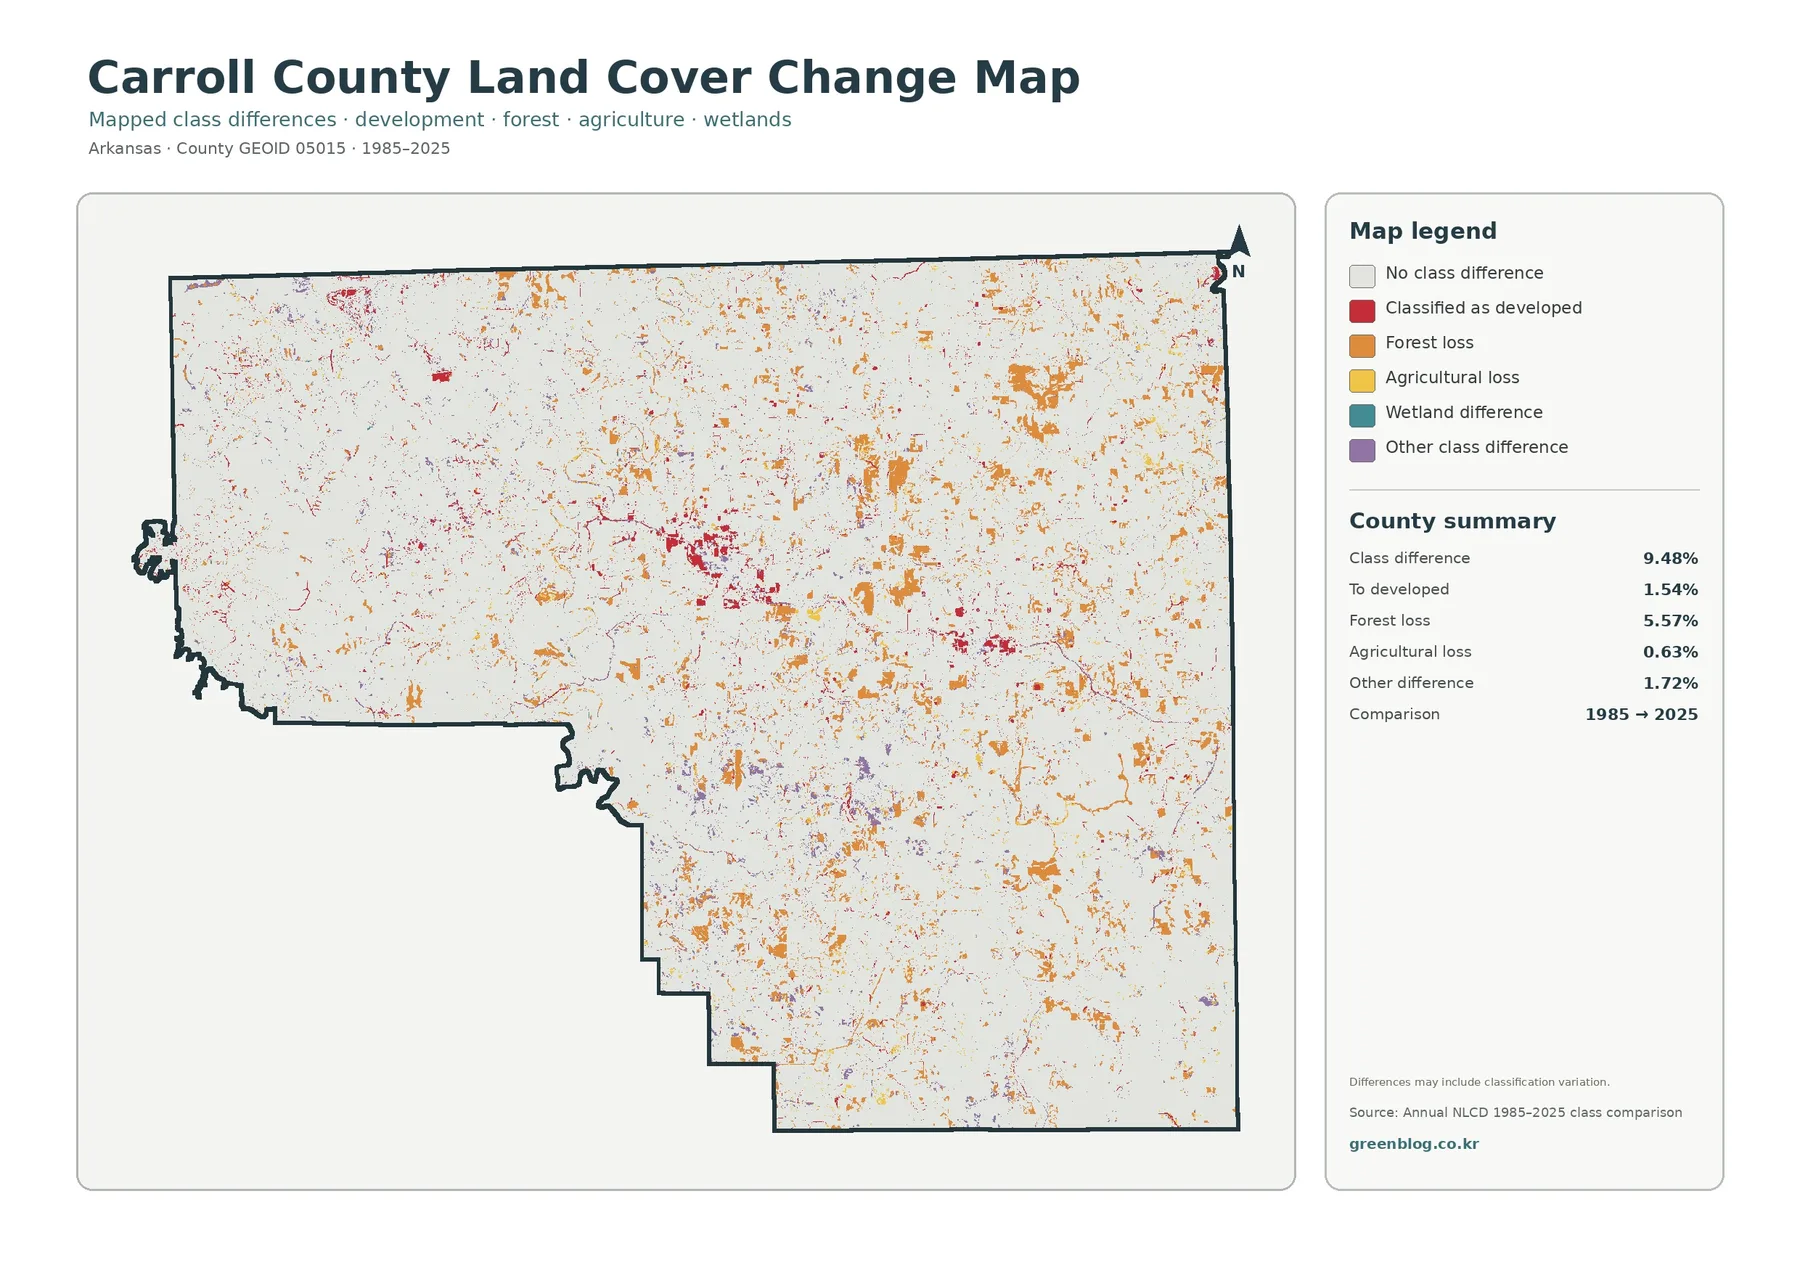
The change map reports a class difference across 9.48% of the county between 1985 and 2025. Its summary marks 5.57% as forest loss, 1.54% as changed to developed, 0.63% as agricultural loss, and 1.72% as other difference. These categories should be read as cell-by-cell comparison results. They are not the same as subtracting the 2025 forest percentage from a historical forest percentage, and the 1.54% developed category should not be described as the county’s total developed area.
Orange forest-loss cells are scattered across many parts of the county, with visible concentrations in the east and south as well as smaller patches elsewhere. Red cells classified as changed to developed are more noticeable around the same broad developed centers and linear routes that stand out in the impervious map. Agricultural-loss and other-change colors occur in smaller pieces. The spatial pattern suggests many separate areas of difference rather than one single front of change moving across Carroll County.
The map itself cautions that differences may include classification variation. That warning is important. A change-colored cell can reflect a real conversion on the ground, but image conditions, classification decisions, or mixed land cover within a raster cell can also affect the comparison. If a project needs to explain why a particular tract changed, the map should be treated as a screening layer and followed with historical aerial imagery, local records, or field information.
Download the four original JPG maps
The WebP images in the article are screen-friendly previews. The downloadable archive contains the original JPG versions at 2480 × 1754 pixels each. The set is useful when a larger image is needed for printing, a slide, a report, or side-by-side comparison outside the browser. Because all four maps use the same county boundary, they can be arranged as a consistent reference set without rebuilding the extent for each topic.
What these maps do not tell you
Annual NLCD products are raster classifications, which means the landscape is represented as a grid of cells rather than as surveyed property polygons. A cell can contain more than one real-world surface, and a narrow road, streamside strip, building, or field edge may be generalized. The map therefore works well for county-scale pattern recognition but should not be used to measure a legal parcel boundary, confirm ownership, identify zoning, or decide whether a site is suitable for development.
Frequently Asked Questions
What is the largest land-cover class in Carroll County?
Forest is the largest 2025 class in the supplied county summary at 50.82%, followed by agriculture at 40.08%. The map shows that these classes are not evenly distributed: forest is especially extensive in the west, while agricultural cover is broader across the north and east. Developed land is much smaller at 6.39% but is visually concentrated in a few centers and corridors.
Why is developed land 6.39% when mean impervious surface is only 1.15%?
Developed land and impervious surface are related but not identical measures. A developed land-cover class can include vegetation mixed with buildings and roads, especially in lower-density areas. Impervious surface focuses on the portion covered by hard materials such as pavement and rooftops. The supplied summary also shows that only 0.54% of the county is mapped at 50% or more impervious surface. Map File Information The download contains the same four map views discussed above: 2025 land cover, forest and farmland, impervious/developed land, and the 1985–2025 land-cover change comparison.
Map File Information
Download the map files associated with this page for reference, printing, and compatible visual projects.
- Included Files: Use only the versions confirmed in the article and supplied images
- File Type: Use the confirmed download contents
- Intended Use: Printing, education, presentations, and map-based projects
Related Maps
- Arkansas County Arkansas Land Cover Map
- Ashley County Arkansas Land Cover Map
- Baxter County Arkansas Land Cover Map
Sources and References
- MRLC Annual NLCD Data — national land-cover data and access information
- USGS Annual NLCD Land Cover Classification — class definitions and interpretation reference
- U.S. Census Bureau TIGER/Line Shapefiles — county boundary reference
- Carroll County, Arkansas official website — county seats, the Kings River district boundary, and local lake/Ozark context
- University of Arkansas System Cooperative Extension Service — Carroll County — county agriculture and community education office
Green Map creates custom-edited map images using open geographic data sources such as geoBoundaries, Natural Earth, OpenStreetMap, and government open data.
These maps are edited visual materials, not raw data files, and are provided for education, documents, presentations, and graphic reference.