Calhoun County, Arkansas is overwhelmingly a forest-and-wetland landscape in the 2025 land-cover summary. Forest accounts for 49.75% of the county and wetlands for 29.47%, while developed land is 5.91%. The strongest developed concentrations appear around Thornton in the northwest and Hampton near the county’s center, standing out against much broader areas of forest, wet ground, grass, and shrub cover.
This page uses four map views to separate those patterns: current land cover, forest and farmland, impervious surface and developed land, and class differences between 1985 and 2025. The article uses WebP previews for quick viewing, while the four original JPG maps are available together in one download for teaching, presentations, county-scale reference, and follow-up landscape comparisons.
Table of Contents
Hampton and Thornton are the clearest hard-surface concentrations
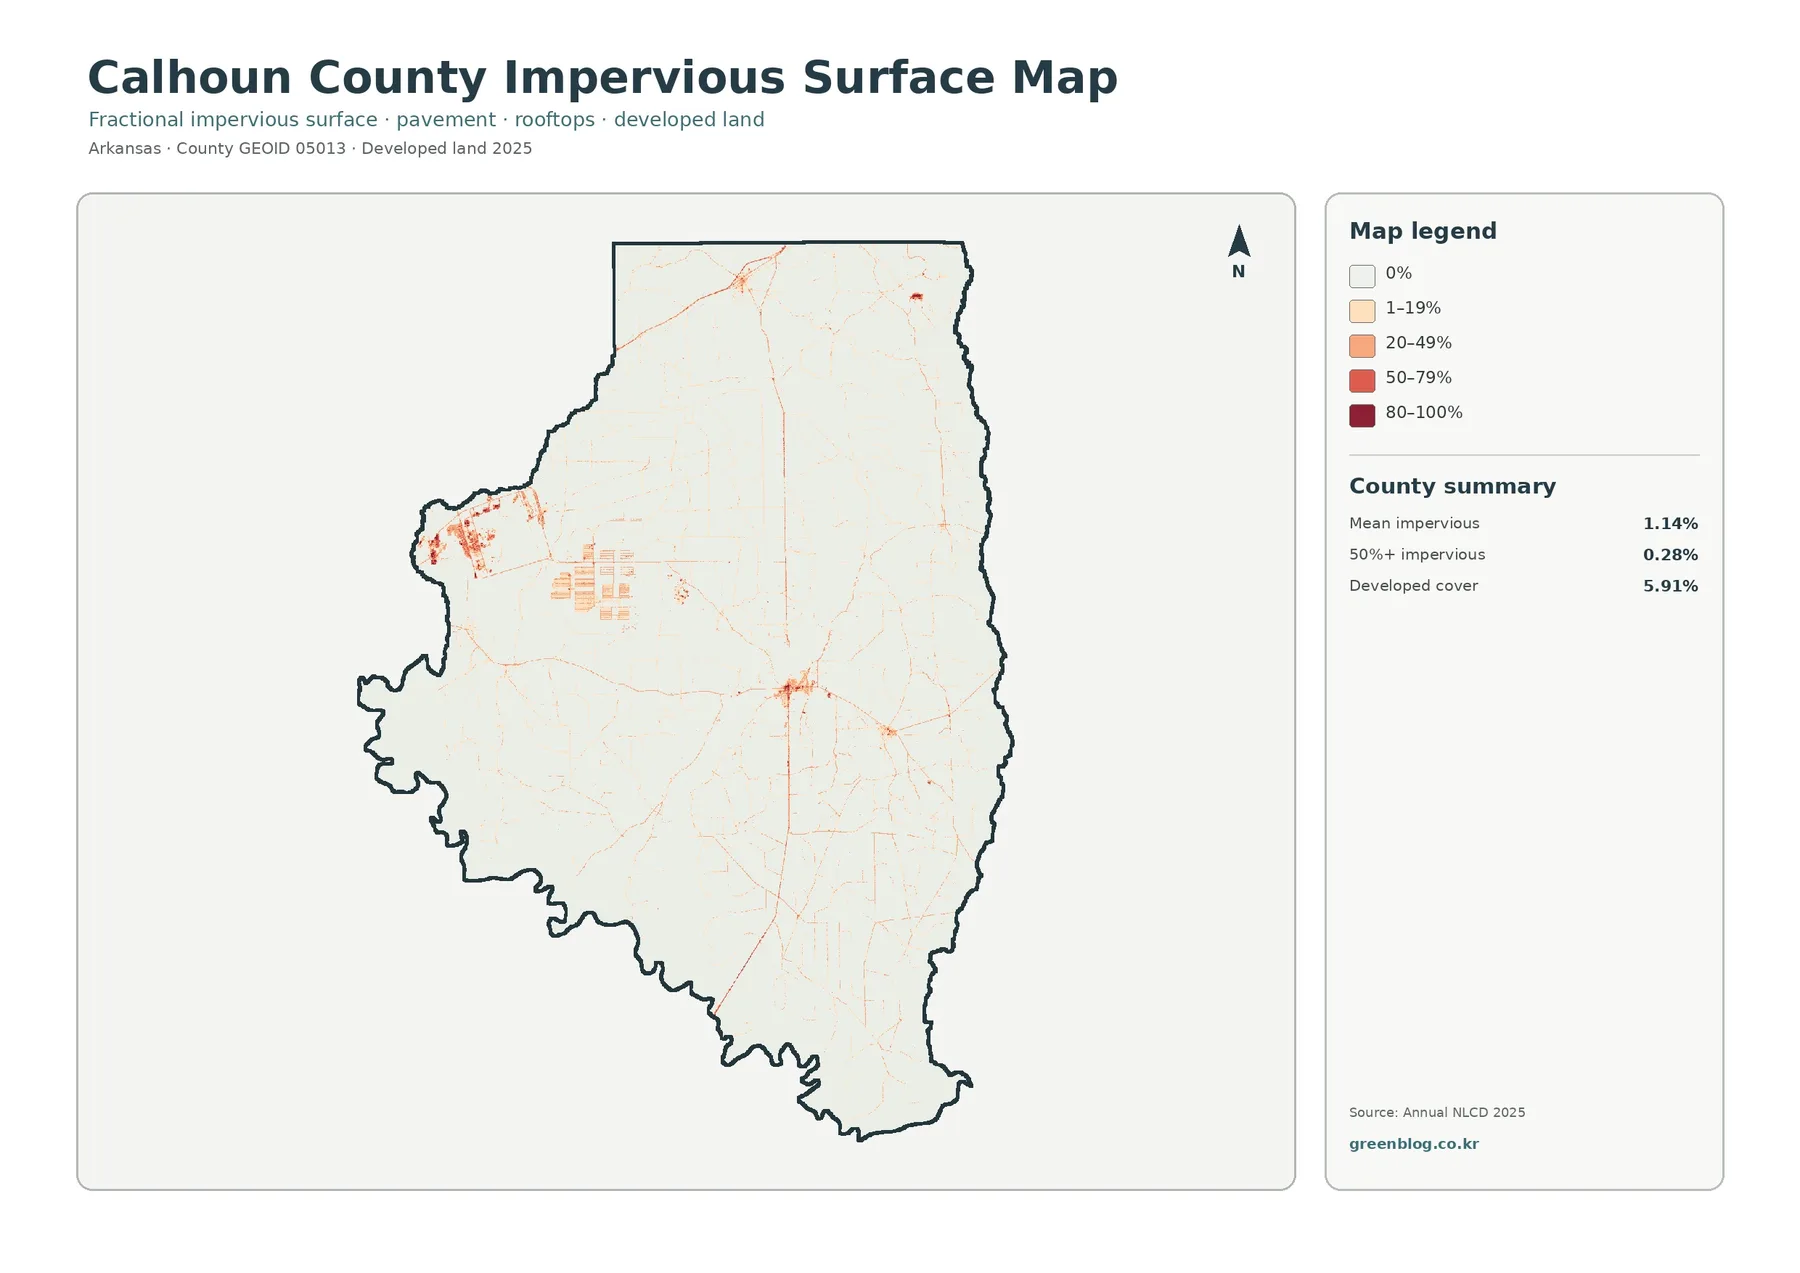
The impervious map is a useful place to start because it shows how localized development is. Mean imperviousness across Calhoun County is only 1.14%, and land at 50% or greater impervious cover accounts for 0.28%. Most of the map is therefore very pale. Stronger orange and red values form a compact cluster in the northwest around Thornton and another near Hampton, while thinner lines extend between and away from those centers along the road network.
Impervious surface means pavement, rooftops, parking areas, and other hard surfaces that do not readily absorb water. It is not the same measure as the 5.91% developed-land share. A developed cell can contain lawns, trees, bare soil, and other permeable surfaces around buildings and roads, so developed land can cover a larger area than the actual hard-surface fraction. That difference is why the county can have 5.91% developed cover while averaging only 1.14% imperviousness.
Forest and wetlands define the overall 2025 map
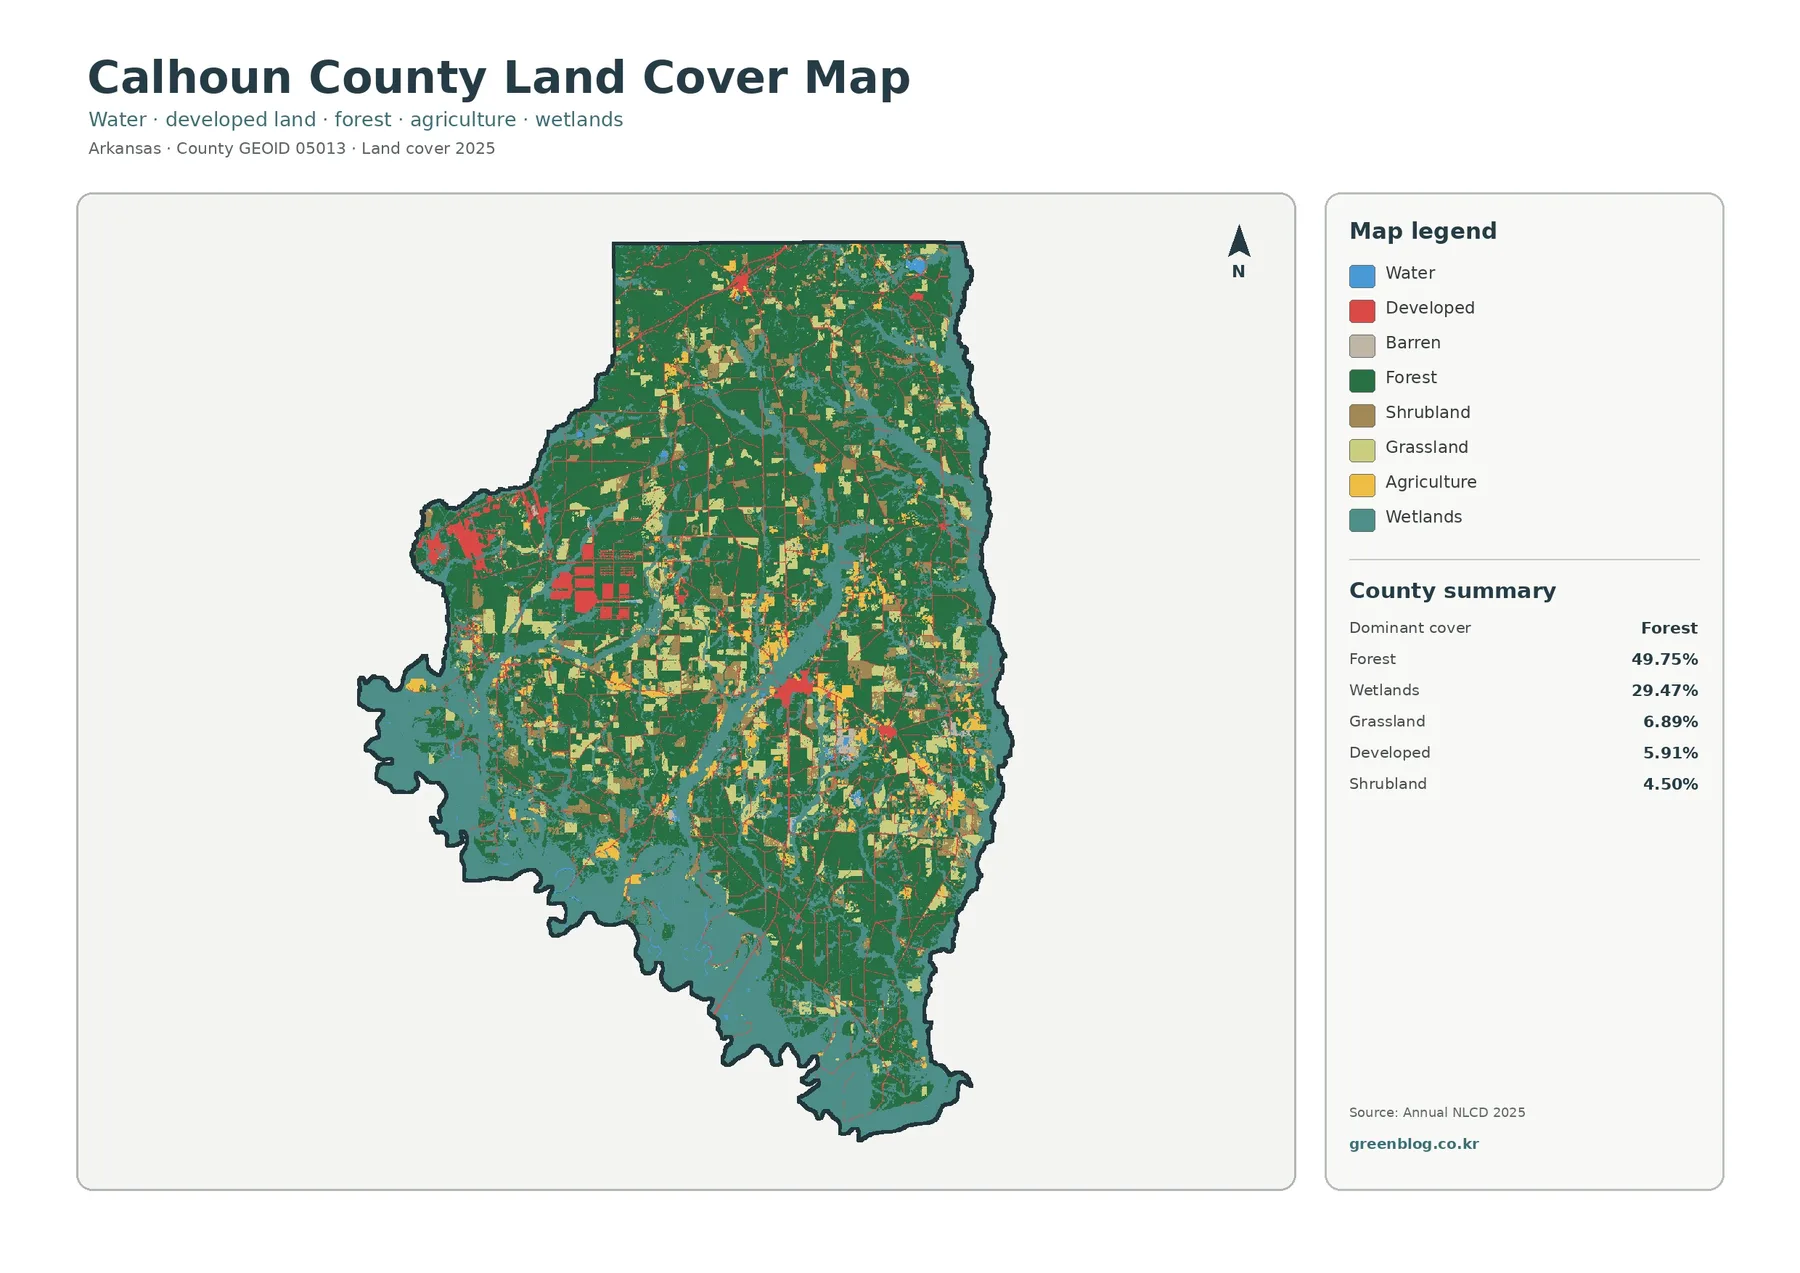
The general map puts every major mapped class into one view. Forest is the largest class at 49.75%, followed by wetlands at 29.47%. Grassland contributes 6.89%, developed land 5.91%, shrubland 4.50%, agriculture 2.54%, and open water 0.60%. Forest and wetlands together make up roughly four-fifths of the mapped county, which explains why dark green and blue-green tones dominate the image.
Those dominant covers are not separated into two simple halves. Large forest blocks spread through the north, center, and east, while wetland colors become especially broad toward the west and south and also follow branching interior corridors. Grassland, shrubland, and agriculture break the forest into smaller openings without creating one countywide farming belt. Development is visually different because it is concentrated in a few compact areas and narrow linear traces rather than scattered evenly across the landscape.
Wetlands are widespread, but open water is a much smaller class
The 29.47% wetland figure can be easy to misread if wetland and open water are treated as the same thing. Open water is only 0.60% in the county summary. Wetland classes can include places with saturated soils and water-tolerant vegetation that are not continuously open ponds, lakes, or river surfaces. On the map, this is why extensive blue-green wetland areas occupy far more land than the small blue water patches.
Calhoun County also contains protected natural landscapes that provide useful regional context. The Arkansas Natural Heritage Commission’s Moro Big Pine Natural Area-Wildlife Management Area page places that Coastal Plain natural area in Calhoun County. Its official description discusses diverse forest and seasonally wet habitats. The county map used here does not include the natural area’s boundary, so it should not be used to trace or estimate the protected site. The source is relevant as local ecological context, not as a substitute for the official management-area map.
The forest-and-farmland view prevents small open areas from being mistaken for one large farm zone
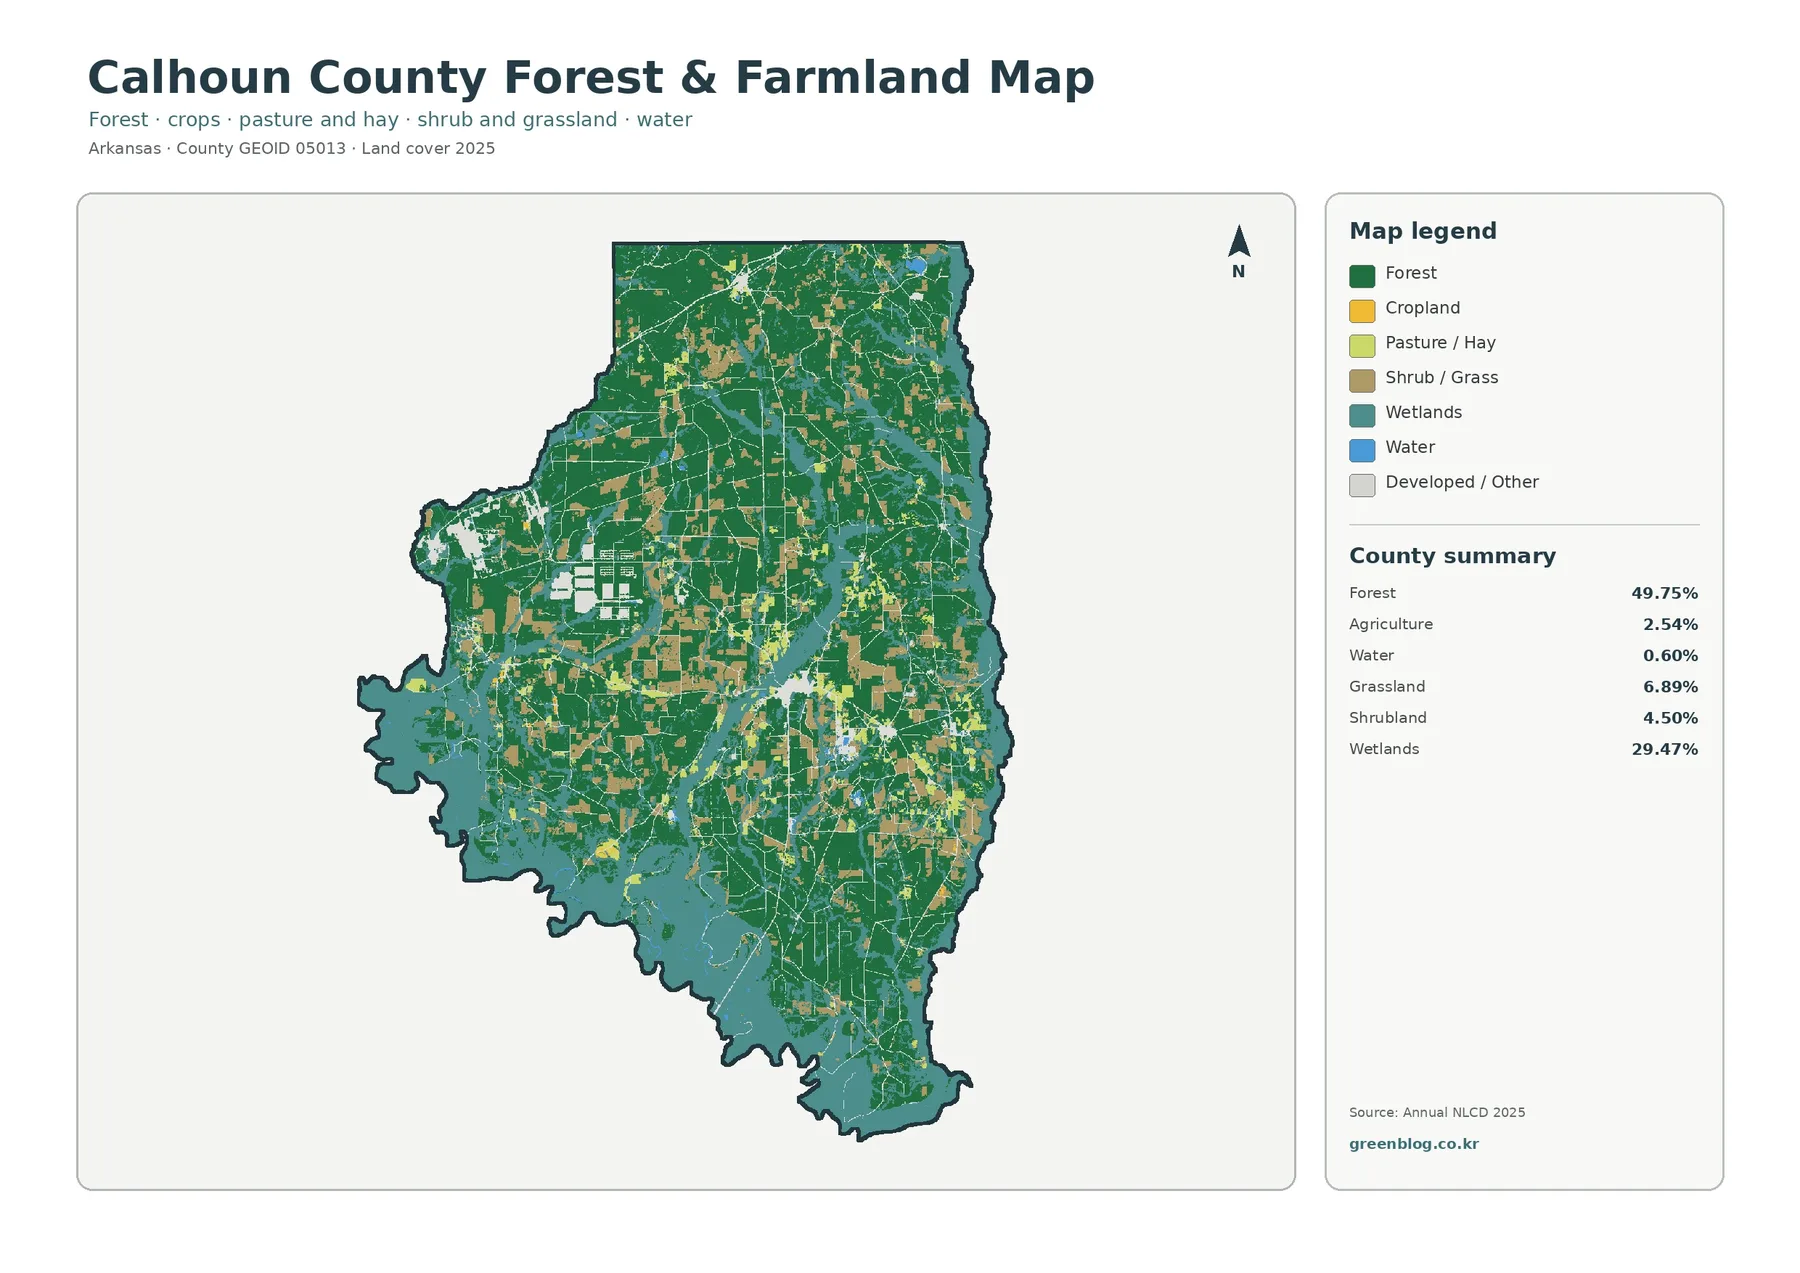
Removing some of the urban emphasis makes the distribution of forest and open vegetated land easier to compare. Forest still covers 49.75% of the county. Agriculture, however, is only 2.54%. Cropland colors appear in small patches through parts of the north, center, and east instead of forming a broad continuous agricultural plain. Grassland at 6.89% and shrubland at 4.50% create additional openings, so a light-colored field-shaped patch is not automatically cropland.
This distinction matters for agricultural interpretation. The legend separates cropland from pasture or hay and from shrub or grass cover. A county land-cover map can help locate broad agricultural or open-land patterns, but it cannot identify farm ownership, a particular crop, yield, or management practice. For those questions, the University of Arkansas System Cooperative Extension Calhoun County Office is a more appropriate local reference because it provides county services and information related to agriculture, forestry, wildlife, livestock, and forage.
The 1985–2025 comparison reports class differences across 22.92%
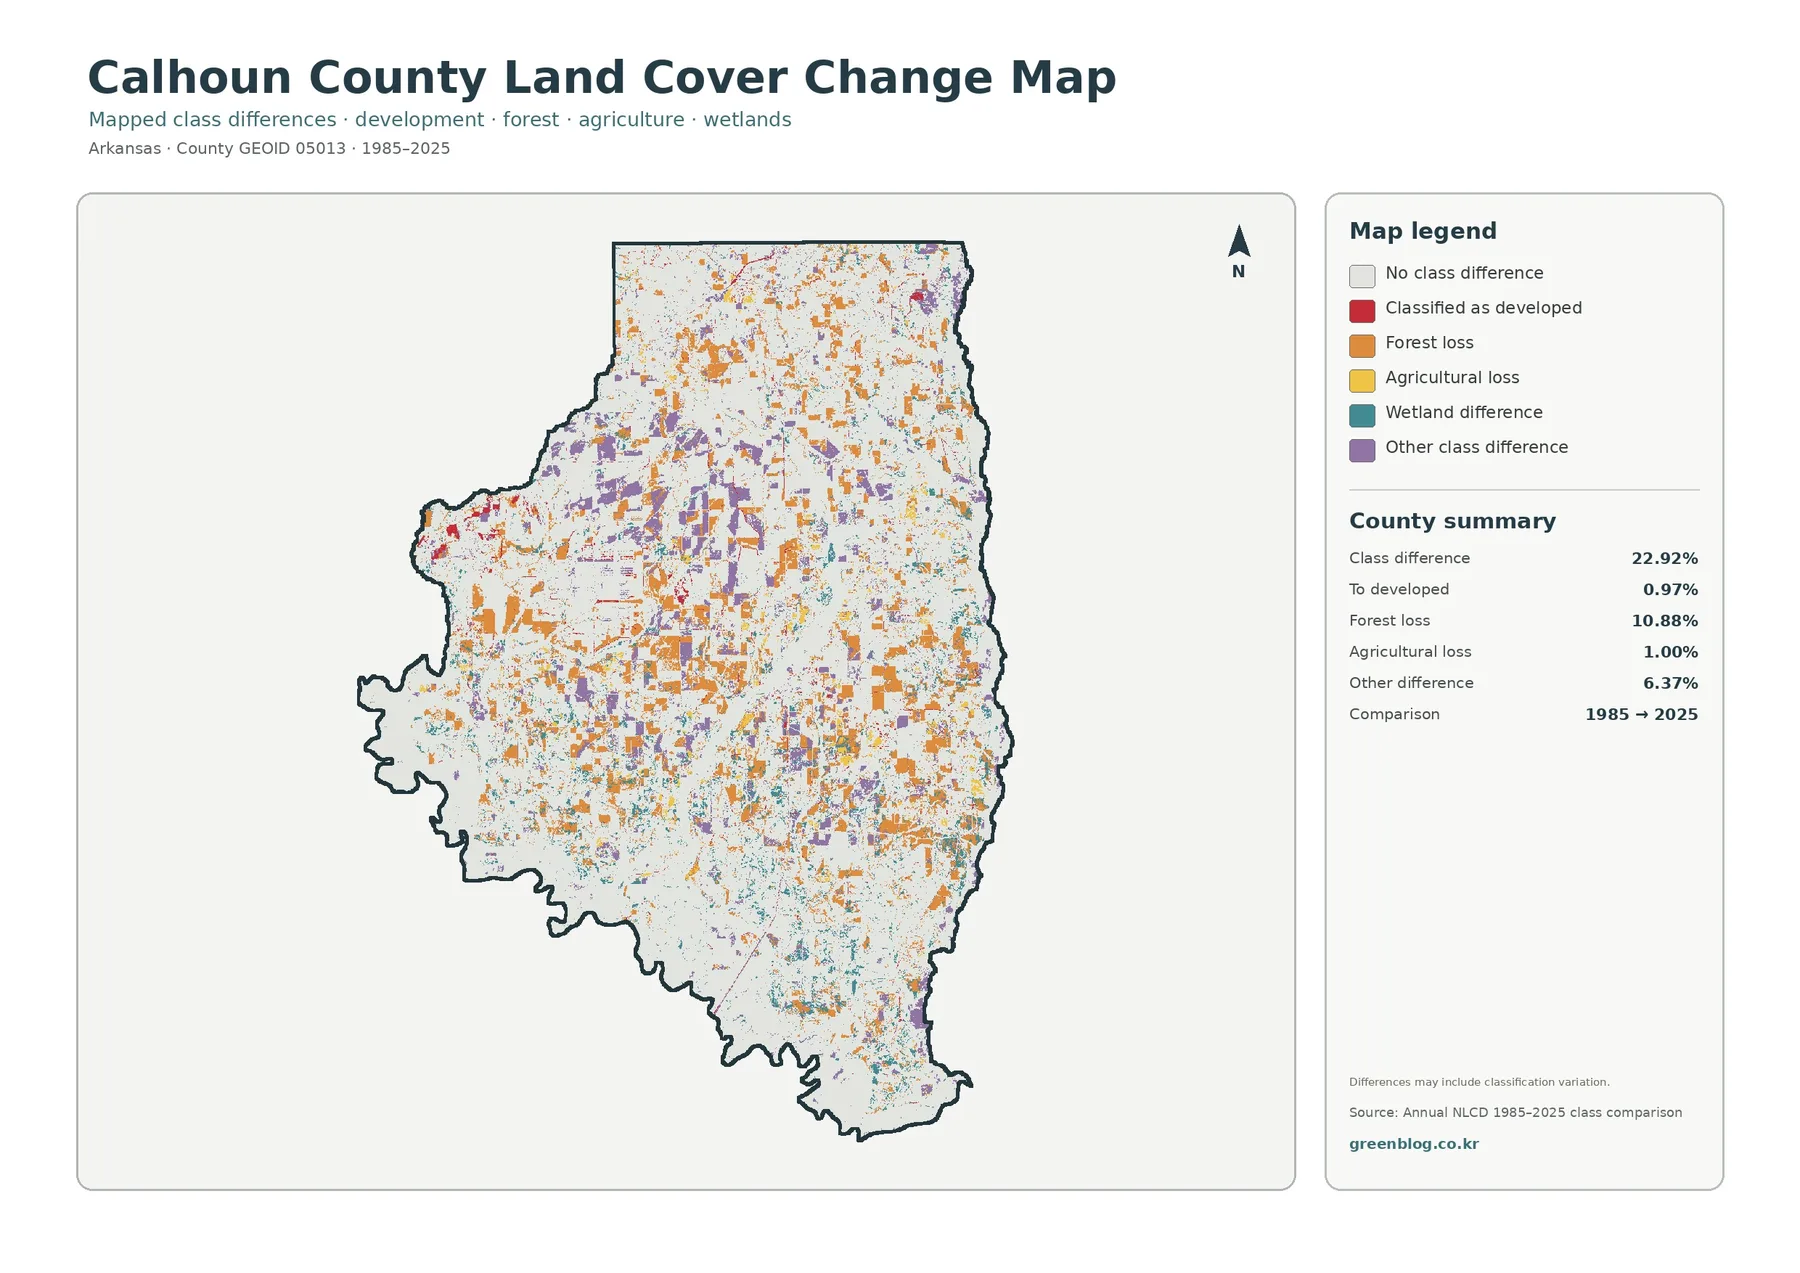
The change map highlights cells whose representative land-cover class differs between the 1985 and 2025 comparison years. The county summary reports class difference across 22.92% of the mapped area. Forest loss is the largest separately listed category at 10.88%. Cells classified to developed account for 0.97%, agricultural loss for 1.00%, and other class difference for 6.37%. Wetland difference is shown in the legend, but the map summary does not print its own percentage, so it should not be reconstructed by subtracting the other categories.
A forest-loss label is not proof of permanent deforestation. Timber harvest followed by regrowth, changes in vegetation condition, a shift between neighboring vegetated classes, actual conversion, imagery differences, and classification boundaries can all affect a two-date comparison. Agricultural loss should be treated with the same caution. The map identifies places worth investigating; it does not provide a cause, a year-by-year history, or a legal land-use record.
Choosing the right map for a county-scale question
The impervious map answers a different question. It is useful for settlement, runoff, and built-surface context because it separates a low countywide mean from much stronger local values around Hampton and Thornton. The change map is most useful for screening locations where the 1985 and 2025 classifications differ. It can guide a closer look at historical imagery or local records, but it should not be presented as evidence that a specific policy, road, timber operation, or development project caused the mapped difference.
Raster scale and land-cover limits matter when zooming in
Annual NLCD is raster data. The landscape is divided into grid cells, and each cell receives a representative class or value. At the commonly used 30-meter scale, narrow roads, small buildings, small ponds, field edges, and thin strips of vegetation can be simplified. A single cell may contain more than one real surface type even though the map displays one category. That mixed-pixel effect becomes increasingly important when someone zooms from a county overview toward an individual property.
Download the four Calhoun County JPG maps
The ZIP contains the original JPG versions of the 2025 land-cover map, forest-and-farmland map, impervious-surface and developed-land map, and 1985–2025 land-cover change map. Each JPG is 2480×1754 pixels, while the article previews are 1800×1273 WebP images. The original files are useful for enlarging the legend, inspecting smaller mapped patches, placing a map in a slide or document, and keeping all four county views together for later comparison.
Frequently Asked Questions
What is the largest land-cover class in Calhoun County?
Forest is the largest 2025 class at 49.75%, followed by wetlands at 29.47%. Grassland is 6.89%, developed land 5.91%, shrubland 4.50%, agriculture 2.54%, and open water 0.60%. Forest and wetlands together account for roughly four-fifths of the mapped county.
Why is developed land 5.91% when mean imperviousness is only 1.14%?
Developed land is a land-cover class that can include buildings and roads mixed with lawns, trees, soil, and other permeable surfaces. Imperviousness measures hard surfaces more directly. Those definitions produce different numbers. The map also reports that areas with at least 50% impervious cover make up 0.28% of the county.
Does the 22.92% class difference mean 22.92% of Calhoun County became developed?
No. The 22.92% figure is the total share of cells whose representative class differs between the 1985 and 2025 comparison. Only 0.97% is separately listed as classified to developed. Forest loss is 10.88%, agricultural loss 1.00%, and other class difference 6.37%, with wetland difference also mapped but not assigned a separate printed percentage.
Can the maps be used to identify parcel boundaries or legal wetlands?
No. These are generalized raster land-cover maps intended for broad pattern comparison. They do not show ownership, parcel surveys, zoning, building rights, or regulatory wetland boundaries. Site-specific legal or planning questions require county records, surveys, and the appropriate agency’s official information.
Map File Information
Calhoun County Land Cover Maps — 4 JPG Files
- Included Files: Use only the versions confirmed in the article and supplied images
- File Type: Use the confirmed download contents
- Intended Use: Printing, education, presentations, and map-based projects
Related Maps
- Arkansas County Arkansas Land Cover Map
- Ashley County Arkansas Land Cover Map
- Baxter County Arkansas Land Cover Map
Sources and References
Annual land-cover products are available through MRLC Annual NLCD Data, and category definitions are documented by the USGS Annual NLCD Land Cover Classification. County boundary data can be checked through U.S. Census Bureau TIGER/Line Shapefiles.
Local context comes from the University of Arkansas System Cooperative Extension Calhoun County Office, the Association of Arkansas Counties Calhoun County profile, and the Arkansas Natural Heritage Commission Moro Big Pine Natural Area-WMA page. These sources provide county and natural-resource context; they are not used to redraw the raster map into parcel, municipal, or protected-area boundaries.
Green Map creates custom-edited map images using open geographic data sources such as geoBoundaries, Natural Earth, OpenStreetMap, and government open data.
These maps are edited visual materials, not raw data files, and are provided for education, documents, presentations, and graphic reference.