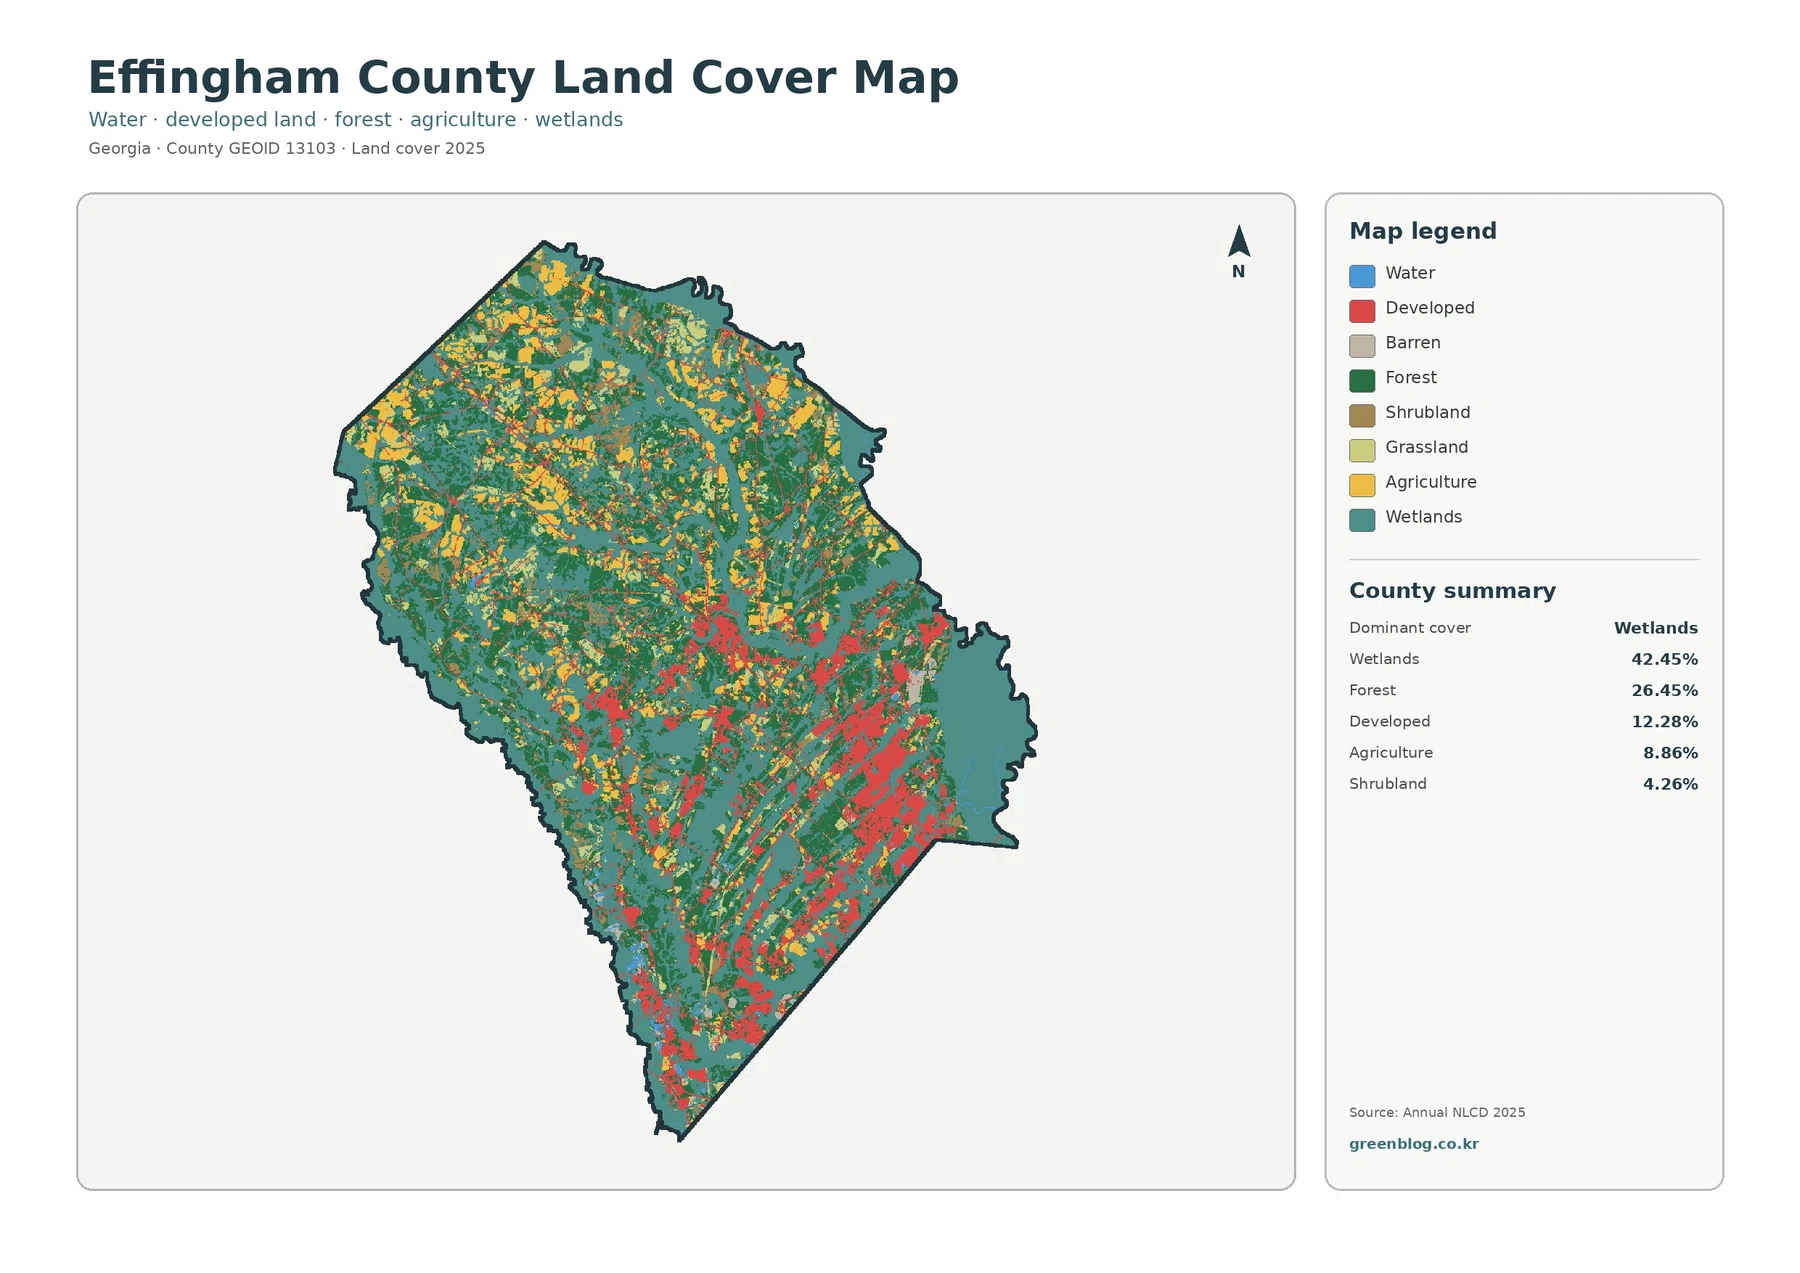
Effingham County’s 2025 land-cover picture is defined first by water-influenced landscapes: wetlands account for 42.45% of the county, while forest covers another 26.45%. Developed land is much more concentrated, with the strongest clusters appearing from the county center toward the southeast rather than spread evenly across the map.
The page includes four views of the same county—general land cover, forest and farmland, impervious surface, and 1985–2025 change. The four original JPG maps are available together in one download, while the WebP images in the article are intended for quick on-screen comparison.
Table of Contents
Start with the wetland-dominated 2025 landscape
The overall map puts Effingham County’s mix into perspective. Wetlands make up 42.45% of the mapped area, forest 26.45%, developed land 12.28%, and agriculture 8.86%. Shrubland accounts for 4.26%, grassland 3.98%, and water 1.14%. Small barren areas are also part of the legend, but they are visually minor compared with the broad wetland and forest cover.
Wetlands do not appear as one isolated block. They extend through much of the county and repeatedly meet forest, farm fields, and developed patches. Farmland is easier to pick out in the northern and northwestern portions, while the denser developed pattern becomes more obvious toward the center and southeast. This produces a county map with several overlapping landscape types rather than a simple urban-versus-rural split.
The county’s current joint comprehensive plan provides useful geographic anchors. Springfield is near the center and serves as the county seat. Rincon sits in southeastern Effingham County along Highway 21, and Guyton is in the western part of the county. Those locations help orient the land-cover pattern even though this thematic map is not designed as a detailed street or municipal-boundary map.
Land cover should not be confused with zoning or legal land use. A developed pixel describes surface cover associated with built features; it does not tell whether the property is residential, commercial, industrial, or legally approved for development. The same caution applies to agriculture and wetlands. Parcel ownership, zoning districts, regulated wetland boundaries, and building rights require separate sources.
Farm and forest patches are easier to compare away from the built-up southeast
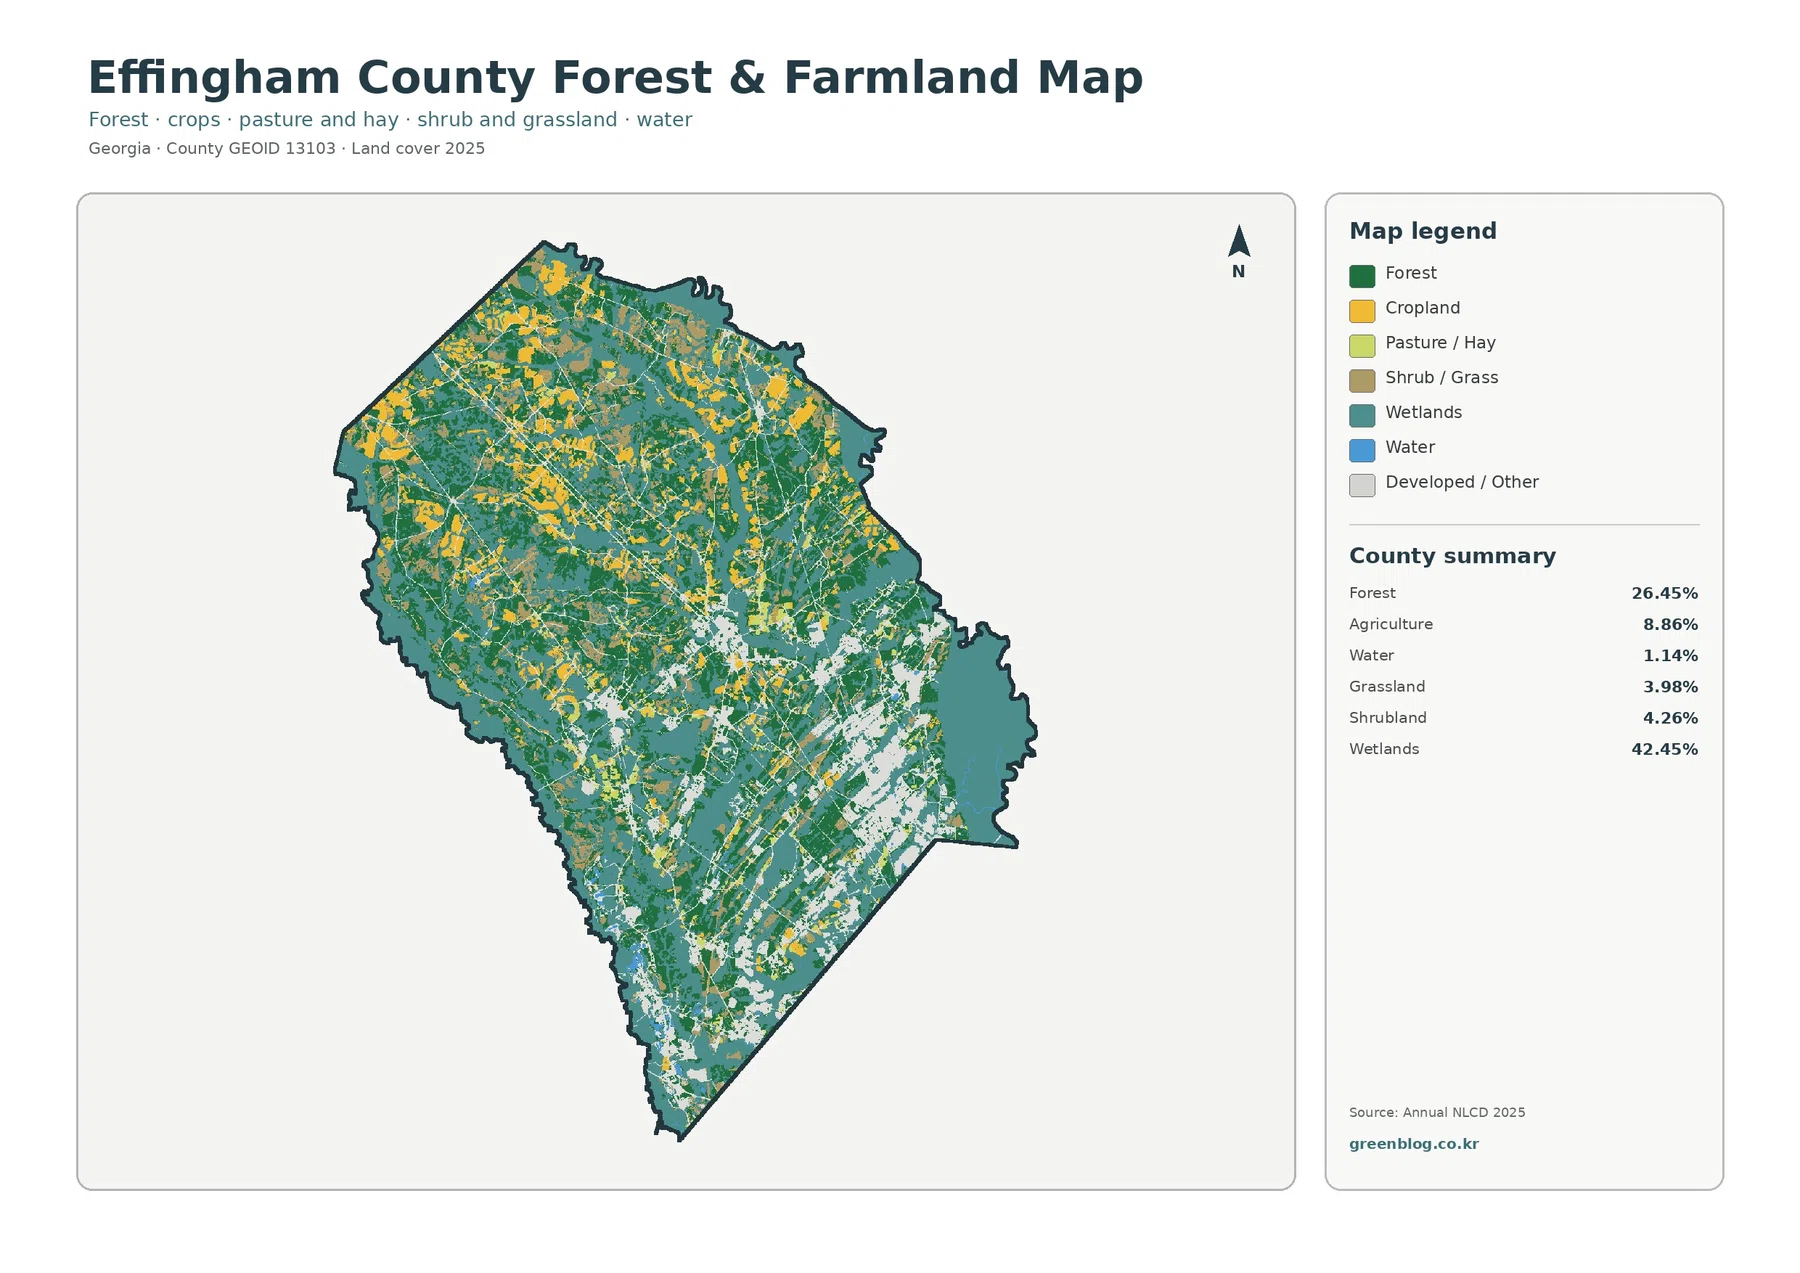
The forest-and-farmland view strips away some of the visual competition from the general map. Forest covers 26.45% of the county and agriculture 8.86%, but neither forms a single uninterrupted zone. Cropland is especially noticeable in the north and northwest, where yellow field blocks alternate with forest and wetland cover. Smaller agricultural patches continue through other parts of the county, often separated by wetter or wooded ground.
The map also makes Effingham County’s 42.45% wetland share hard to miss. Teal areas weave between both forest and farmland, creating broad transitions rather than clean straight boundaries. The county’s planning documents describe parts of Effingham as low-lying coastal plain that can be affected by flooding from rivers and canals. That local setting helps explain why wet ground matters in county planning, but a land-cover wetland class is not the same thing as a regulatory wetland boundary or a flood-hazard designation.
Agriculture and forestry are meaningful local reference points rather than generic map categories here. UGA Extension’s Effingham County resources cover crops such as corn, cotton, peanuts, soybeans, and small grains, along with forestry and livestock topics. Its county impact page also highlights forestry products and row crops as important local sectors. The land-cover map cannot identify a specific crop or management practice, but it provides a useful county-scale background for understanding where working lands sit among forest and wet areas.
This version is particularly helpful for classroom comparisons, conservation discussions, or presentations where a full developed-land legend would be distracting. A reader can trace the larger forest blocks, identify concentrations of fields, and see how wetlands break up those patterns. It is also a good companion to the impervious-surface map because it shows what surrounds the more heavily built sections of the county.
Impervious surfaces reveal a much tighter development footprint
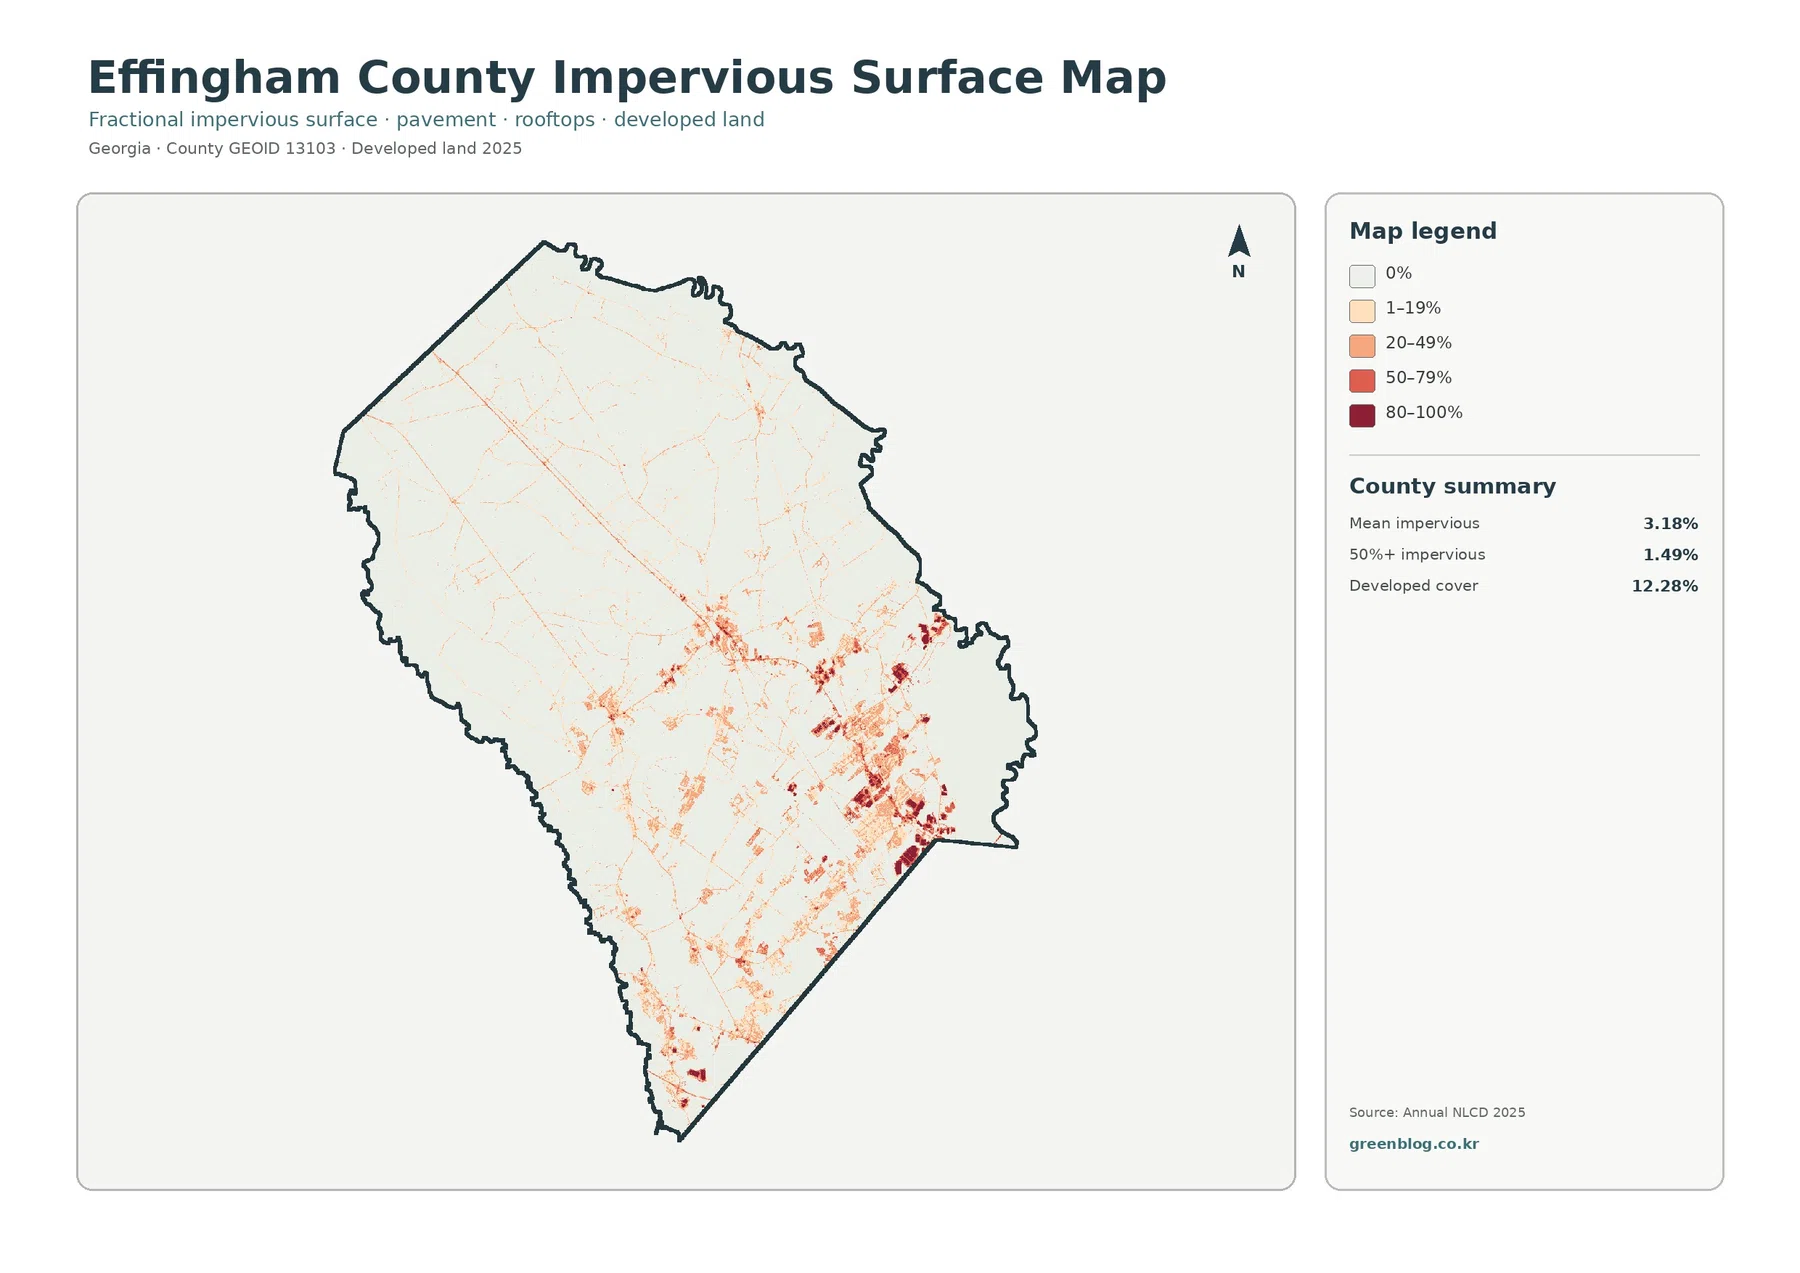
The impervious-surface map focuses on pavement, rooftops, and other surfaces that do not readily absorb water. Effingham County’s mean impervious value is 3.18%, and areas with at least 50% impervious cover account for 1.49% of the county. Developed land covers 12.28% on the general map, so the two measurements should not be treated as interchangeable. A developed class can include lawns, open space, and other surfaces with a much lower impervious fraction.
The strongest impervious concentrations are not evenly distributed. Darker patches are much more common from central Effingham toward the southeast, with substantial clusters around the Rincon side of the county and additional concentrations around the Springfield area. Thin lines extend outward along road corridors, while much of the northwest remains very light except for scattered transportation and settlement traces.
Rincon’s location is especially useful for orientation. The county plan identifies it as a southeastern community on Highway 21 and describes its growth into a commercial center. That source does not mean the highway alone caused the map pattern; it simply gives a verified place and transportation reference for the developed area that is visible. Determining why a particular parcel was developed would require local development records, zoning history, and other evidence.
Impervious data can also support watershed or stormwater discussions, but it should be used carefully. A darker cell means that a larger share of that cell is covered by hard surfaces. It does not by itself predict flooding, drainage failure, or water quality at a specific property. Elevation, soils, drainage infrastructure, rainfall, floodplain data, and site design all matter when moving from a county overview to a real engineering or planning question.
The 1985–2025 comparison shows change beyond the current urban footprint
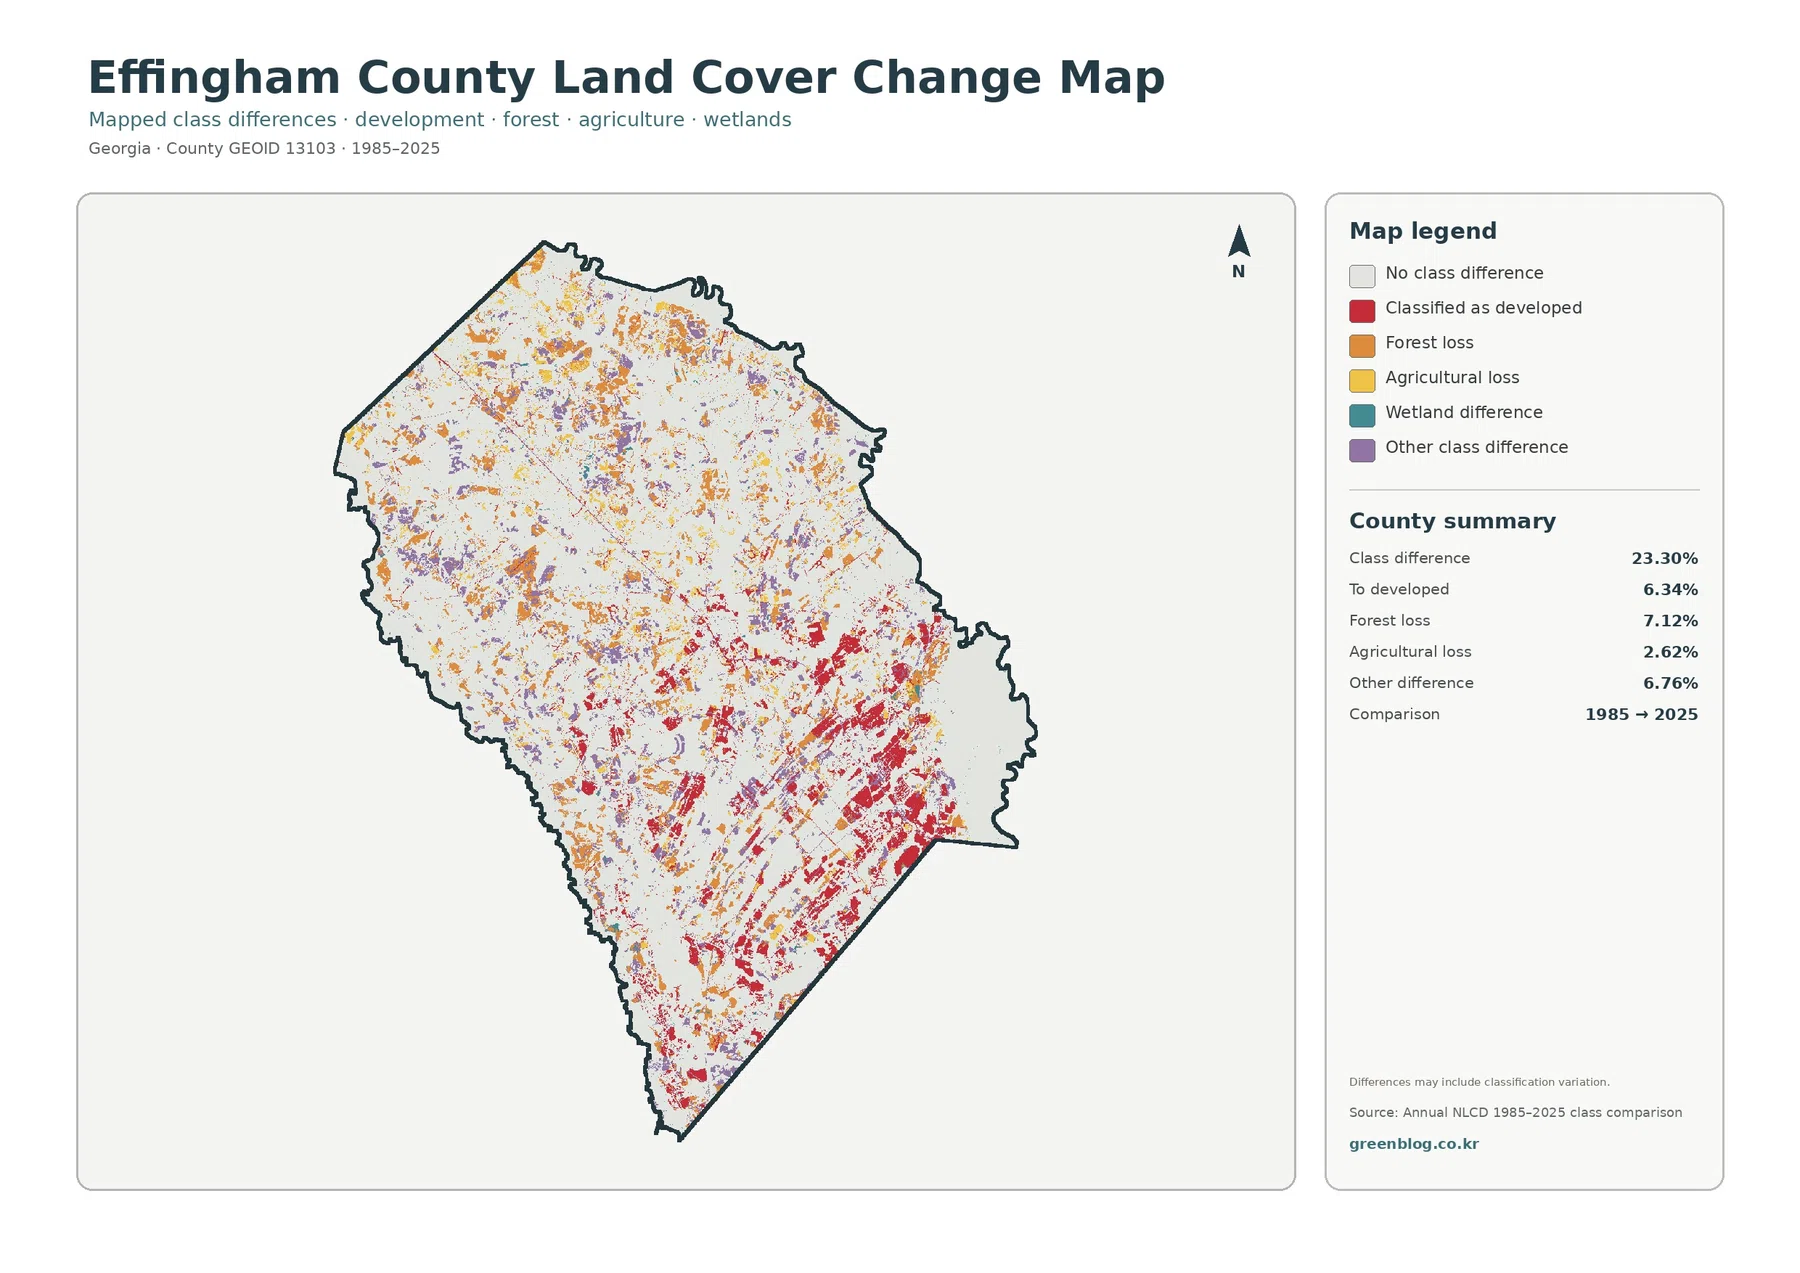
The change map compares classifications from 1985 and 2025. A class difference appears across 23.30% of the county. Areas classified as developed in the later map account for 6.34% of the comparison, forest-loss areas 7.12%, agricultural-loss areas 2.62%, and other differences 6.76%. These are map-to-map class differences, not a direct statement that every highlighted acre changed for one known reason.
Development-related change is most concentrated from the county’s center into the southeast. That pattern is useful to compare with the current impervious map because many of the stronger red change areas occur in the same broad part of Effingham where built surfaces are now densest. Forest-loss and other-difference colors are more dispersed, including many smaller patches in the north and west.
The northern half therefore tells a different story than a simple suburban expansion map would suggest. There are numerous small change cells around farm and forest patterns, while broad portions still retain the 2025 wetland or forest classifications. A reader interested in land management can use the change view to find candidate areas for closer examination, then return to the 2025 maps to see the present surface category.
The map itself warns that differences can include classification variation. Annual NLCD is designed for time-series analysis, but no remotely sensed classification is a parcel-by-parcel historical survey. Small isolated cells should be interpreted cautiously. Larger clusters that agree with the current land-cover and impervious maps provide a stronger county-scale signal than one or two scattered pixels.
Using Springfield, Rincon, and Guyton as map reference points
A practical way to navigate the four maps is to keep the county’s three incorporated cities in mind. Springfield gives a central reference, Rincon anchors the more developed southeast, and Guyton marks the western side. The comprehensive plan places all three clearly and describes the distinct settings of each community. Even without street labels on the thematic maps, those anchors make the directional differences easier to follow.
Begin with the general map if the goal is to understand the county as a whole. It establishes the wetland majority and the relationship among forest, agriculture, and developed land. Move to the forest-and-farmland view when working-land patterns matter. The impervious map is best for isolating the built footprint, and the change map is most useful after the current pattern is already familiar.
For environmental education, the wetland–forest relationship is the most distinctive county-scale feature. For growth discussions, the southeast concentration of developed and impervious cover is more informative. Agricultural presentations may benefit from the northern and northwestern field patterns. Choosing the map based on the question avoids forcing one busy image to do every job.
Scale, classification, and what these files cannot tell you
Annual NLCD products are raster datasets at 30-meter spatial resolution. Each cell represents the predominant mapped surface condition at that scale, so narrow features and small land-cover patches can be generalized. A mixed pixel may contain more than one real surface type even though the map assigns one class or an impervious percentage. The crisp color boundary on the image should therefore not be read as a surveyed property line.
The 2025 map is also a snapshot tied to its mapping year. New construction, timber harvest, field rotation, wetland conditions, or other changes after the observation period will not appear until later data are incorporated. For a site-level decision, current aerial imagery and local records should be checked in addition to the county map.
Legal questions need different documents. Effingham County Planning & Zoning maintains subdivision, zoning, and development-review information for unincorporated areas, while regulated wetlands and flood hazards rely on their own delineations and official maps. These land-cover images are best used for county-scale reference, comparison, education, and visual context rather than permitting or parcel determination.
The downloadable source JPGs are 2480×1754 pixels each. They work well for documents, presentations, and normal-size printing, but the supplied asset manifest does not mark them as meeting the project’s A3 high-resolution reference. Before very large-format printing, check the legend and small labels at the intended output size.
Frequently Asked Questions
Why do wetlands cover so much of the Effingham County map?
The 2025 map classifies 42.45% of the county as wetlands, making wetlands the dominant mapped cover. They are distributed broadly rather than confined to one small corner. County planning documents also describe low-lying coastal-plain areas and flood exposure from rivers and canals, although the NLCD wetland class should not be substituted for a regulatory wetland or flood map.
Where is the most concentrated developed land visible?
The strongest developed and impervious clusters appear from central Effingham toward the southeast, especially around the broad Rincon and Springfield areas. The maps show concentration, not cause or zoning status. Local planning and parcel records are needed for more detailed land-use questions.
Does every colored cell on the 1985–2025 map represent a confirmed ground change?
No. It represents a difference between the mapped classifications for the two comparison years, and the map notes that classification variation can be included. Larger clusters that agree with the current land-cover pattern are generally more useful for county-scale interpretation than isolated cells.
Sources and reference material
MRLC Annual NLCD Data provides access to the annual land-cover product family used for national land-cover analysis.
USGS Annual NLCD Land Cover Classification explains the major mapped surface-cover classes.
U.S. Census Bureau TIGER/Line Shapefiles are an official source for county and other geographic boundaries.
Effingham County Joint Comprehensive Plan provides local context for Springfield, Rincon, Guyton, transportation, growth, and county planning.
Effingham County 2020–2040 Joint Comprehensive Plan provides additional county context on low-lying coastal-plain areas and flooding from rivers and canals.
UGA Extension Effingham County Farming Resources describes local agriculture, forestry, crop, and natural-resource support topics.
Map File Information
The Effingham County download contains the four original JPG maps covering 2025 land cover, forest and farmland, impervious surface and developed land, and 1985–2025 land-cover change.
- Included Files: Land Cover Map, Forest & Farmland Map, Impervious & Developed Land Map, Land Cover Change Map
- File Type: ZIP containing four JPG files
- Intended Use: Documents, presentations, education, and county-scale environmental comparison
Related Maps
- Appling County Georgia Land Cover Map
- Atkinson County Georgia Land Cover Map
- Bacon County Georgia Land Cover Map
Green Map creates custom-edited map images using open geographic data sources such as geoBoundaries, Natural Earth, OpenStreetMap, and government open data. These maps are edited visual materials, not raw data files, and are provided for education, documents, presentations, and graphic reference.