Wetlands dominate the supplied 2025 Echols County Georgia Land Cover Map, covering 42.55% of the county. Forest accounts for 25.67%, while grassland and shrubland add another large share of the landscape. Agriculture and developed land are much more limited and appear more often in the western half than across the broad wetland-rich interior and east.
This page compares four views of the same county: 2025 land cover, forest and farmland, impervious surface, and 1985–2025 land-cover class differences. All four original JPG maps are available in one ZIP download below, while the WebP versions in the article make it easier to follow the discussion on screen.
Table of Contents
Wetlands shape the countywide pattern
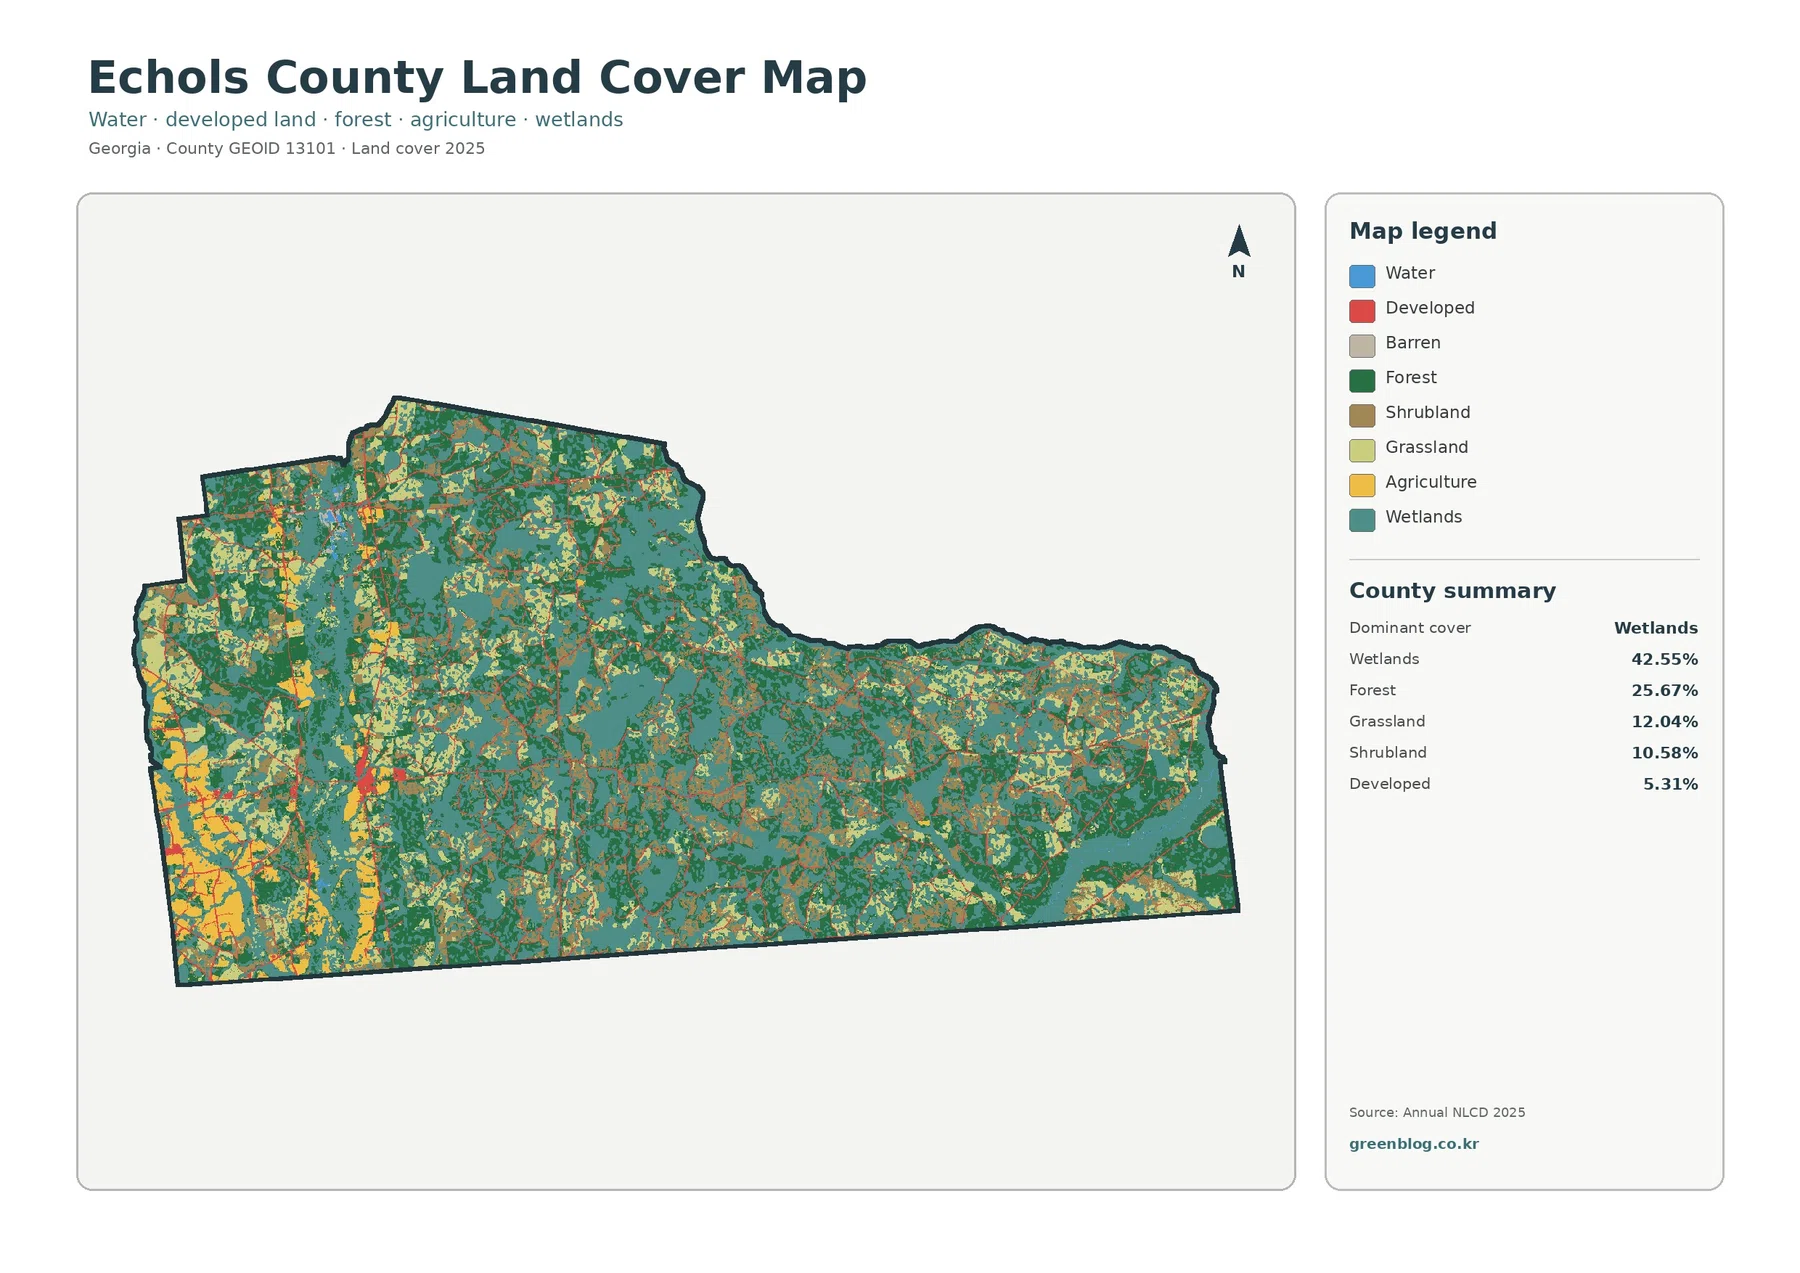
The teal wetland class is the first feature that stands out. It covers 42.55% of Echols County and forms broad areas through the center and east, with additional wetland patches extending into the western side. Forest is the next-largest class at 25.67%. Rather than forming one isolated block, dark-green forest repeatedly borders wetlands, shrubland, grassland, and the scattered agricultural areas.
Grassland makes up 12.04% and shrubland 10.58%. Those two open-vegetation classes help explain why the county does not look like an uninterrupted forest despite the relatively high forest share. They appear in many small and medium patches between forest and wetland areas. Developed land is only 5.31%, and its red marks are small compared with the natural-cover classes that fill most of the county.
The western and southwestern portions contain more visible yellow agricultural blocks. The central and eastern portions show less large-scale agriculture and more wetland and forest. This is a map pattern, not a legal land-use designation: a pixel classified as wetland, forest, or agriculture does not tell you who owns the property, how it is zoned, or whether a project could be permitted there.
Land cover describes what is on the ground as seen and classified from remotely sensed data. It is useful for broad comparisons of vegetation, water-influenced land, fields, and built surfaces. Parcel-level decisions require other records because a land-cover class is not a boundary survey, a zoning layer, a wetland jurisdiction determination, or a development-right map.
Hard surfaces remain thin and scattered
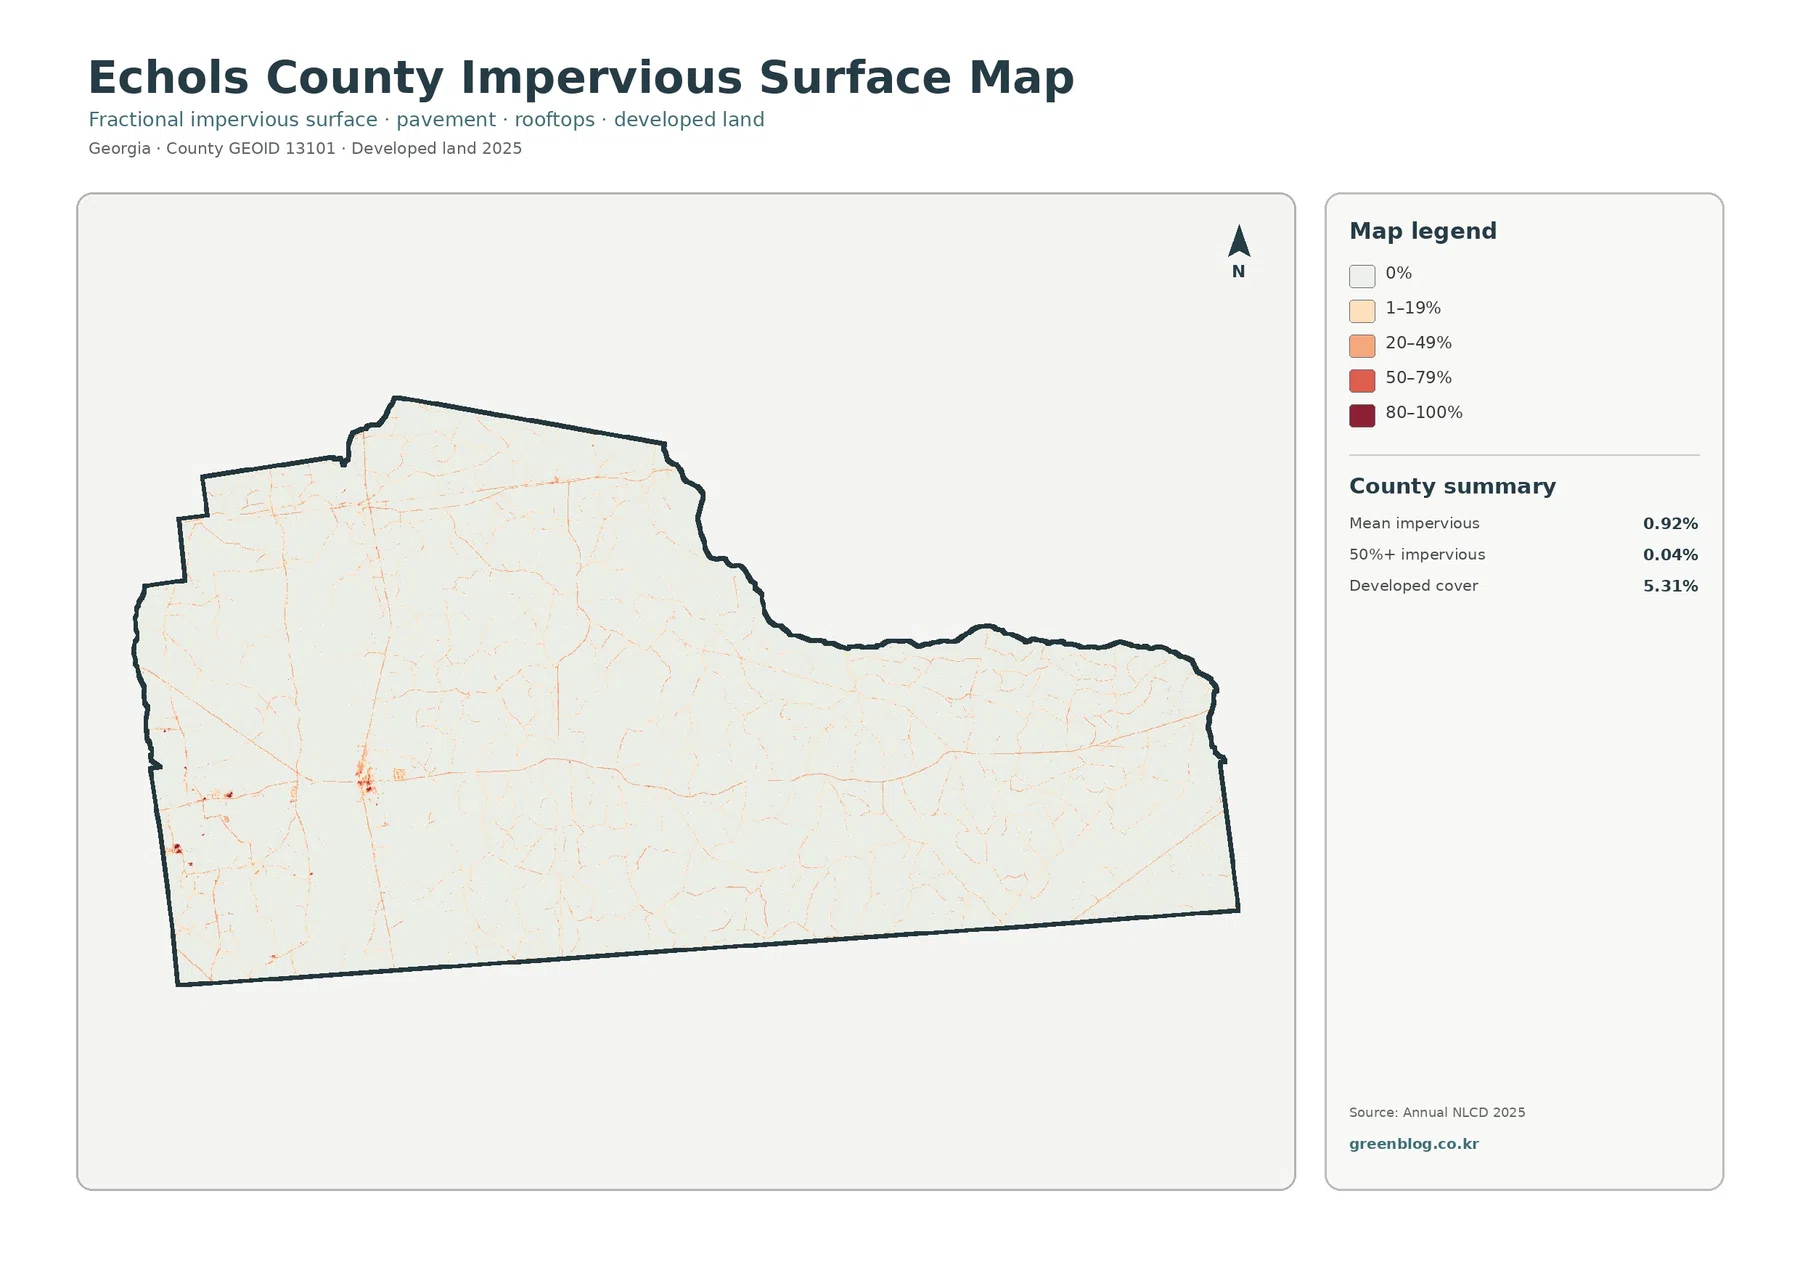
The impervious map provides a very different visual impression from the general land-cover map. Most of Echols County stays in the zero or very-low range, while narrow road-like lines and a few small clusters carry warmer colors. Mean impervious cover is only 0.92%, and just 0.04% of the county falls in cells that are at least 50% impervious.
Those figures should not be confused with the 5.31% developed-land share. A developed land-cover class can include lawns, trees, bare soil, drainage areas, and other permeable surfaces around homes, roads, and facilities. The impervious layer asks a narrower question: how much of each mapped cell is made of hard surfaces such as pavement or rooftops. That is why the countywide impervious mean is much lower than the developed classification.
Small hard-surface concentrations are easier to see in the western half, but the supplied thematic map does not label towns or road names. Echols County’s official government page describes the county as very rural, notes that it has no incorporated towns or cities, and identifies Statenville as the county seat. That context helps a reader understand the sparse map, but it should not be treated as proof that municipal status caused the impervious pattern.
For a county profile, it is useful to place the two measures side by side: developed cover identifies a broader human-influenced land-cover class, while impervious cover highlights the hardest surfaces within that setting. In Echols County, both measures point toward a landscape with limited built concentration, yet the impervious map makes the low density much more obvious than the general map does.
Forest and farmland reveal a strong west-to-east contrast
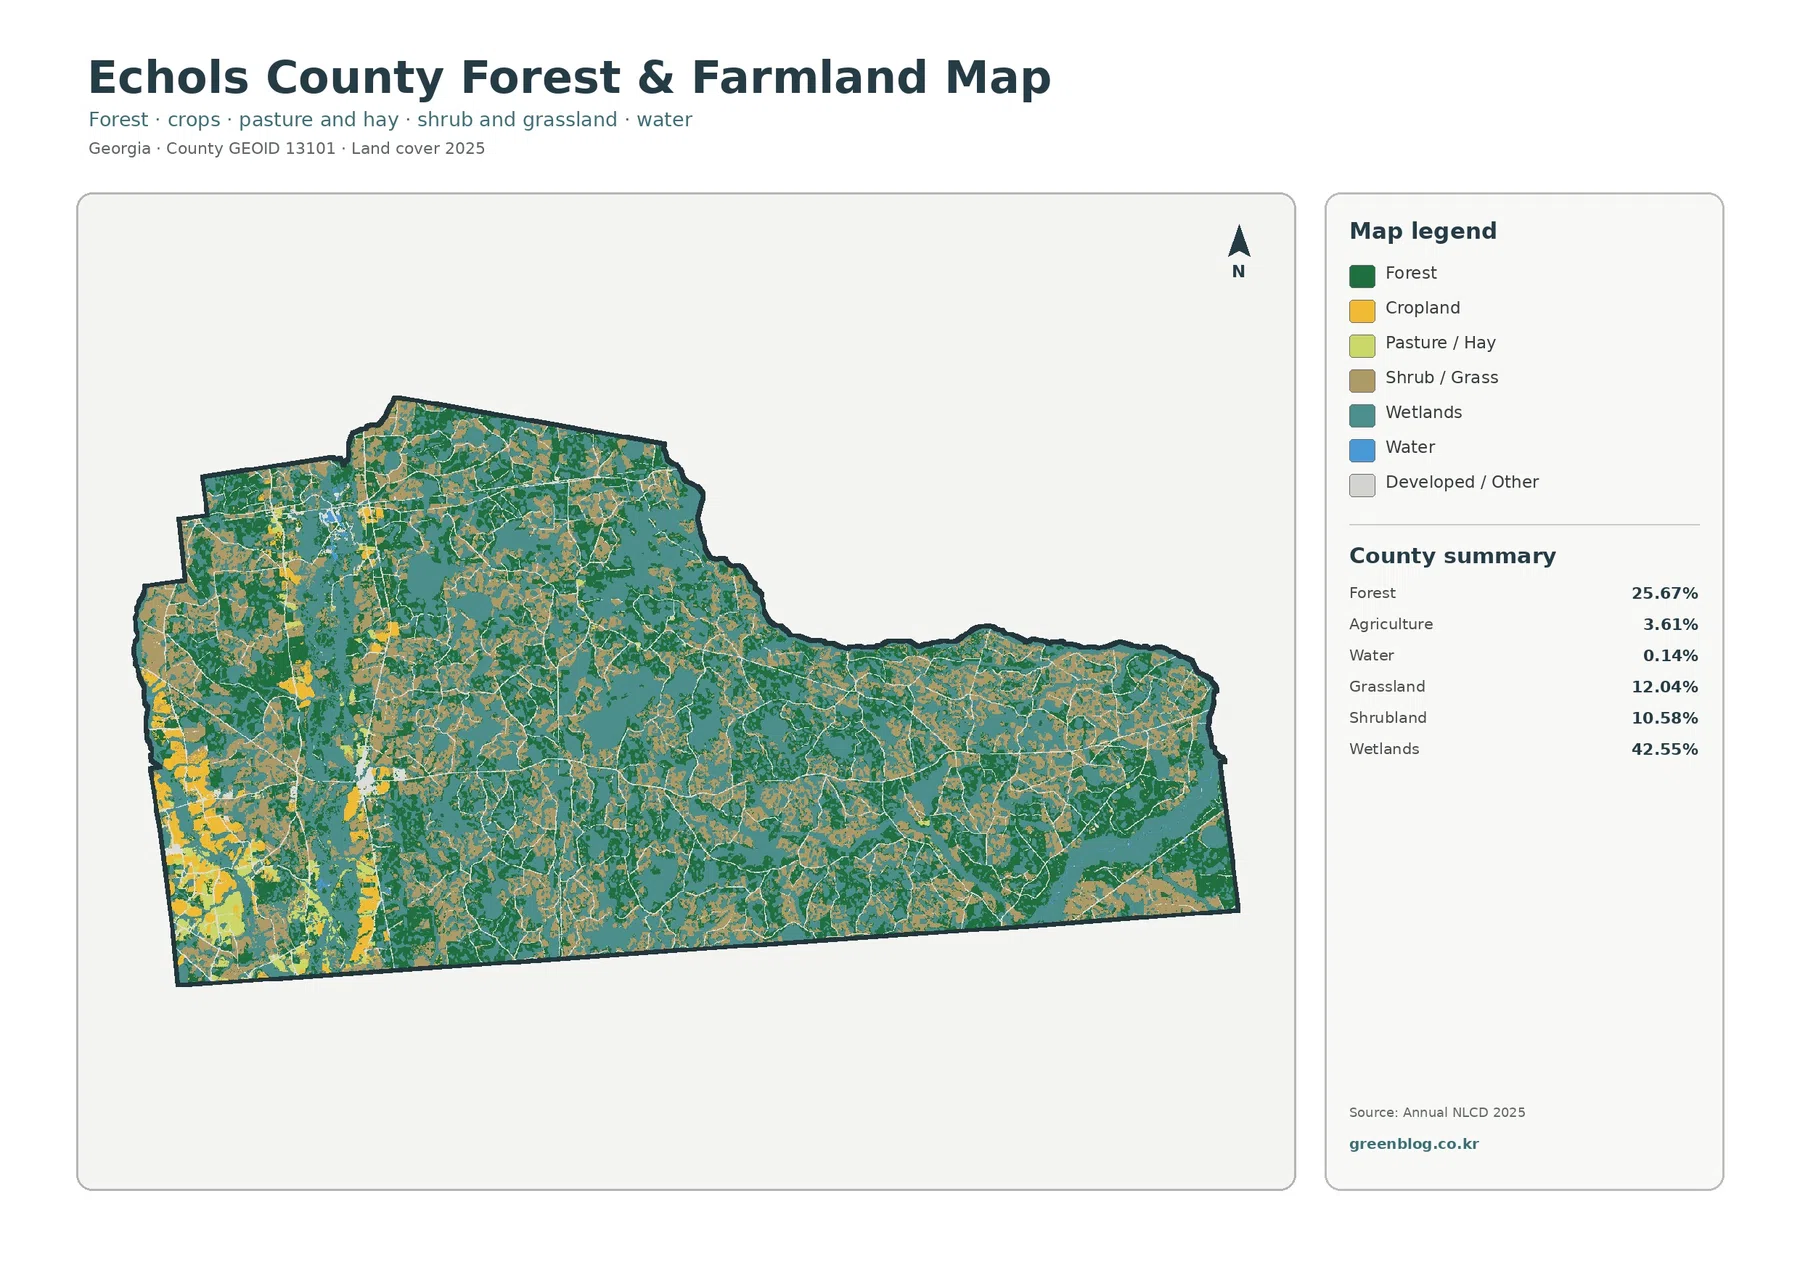
Agriculture accounts for 3.61% of the mapped county, compared with 25.67% forest and 42.55% wetlands. The relatively small agricultural share is not evenly distributed. Yellow farm blocks are most noticeable in the west and southwest, where they form clearer patches than they do across the wetland-heavy central and eastern sections.
Forest is widespread but fragmented by other vegetation classes. Dark-green patches occur beside wetlands and around the open shrub-and-grass areas, creating many short transitions rather than one simple forest edge. This view is especially useful when a general county map contains too many colors to show how the working landscape meets the natural-cover mosaic.
Open water is only 0.14%, yet wetlands occupy more than two-fifths of the county. That difference is important. The water class represents exposed water surfaces, while wetlands can include saturated soils and water-influenced vegetation. A county can therefore have a very small blue-water percentage and still have extensive wetland cover.
Agriculture’s modest mapped percentage also should not be read as a measure of its local economic importance. UGA Extension’s Echols County materials describe active vegetable and row-crop research and producer education, including work involving bell pepper, squash, tobacco, and peanut production. The land-cover map measures surface area by class; it does not measure crop value, farm employment, or the importance of individual agricultural operations.
The 1985–2025 comparison is led by forest-to-other classifications
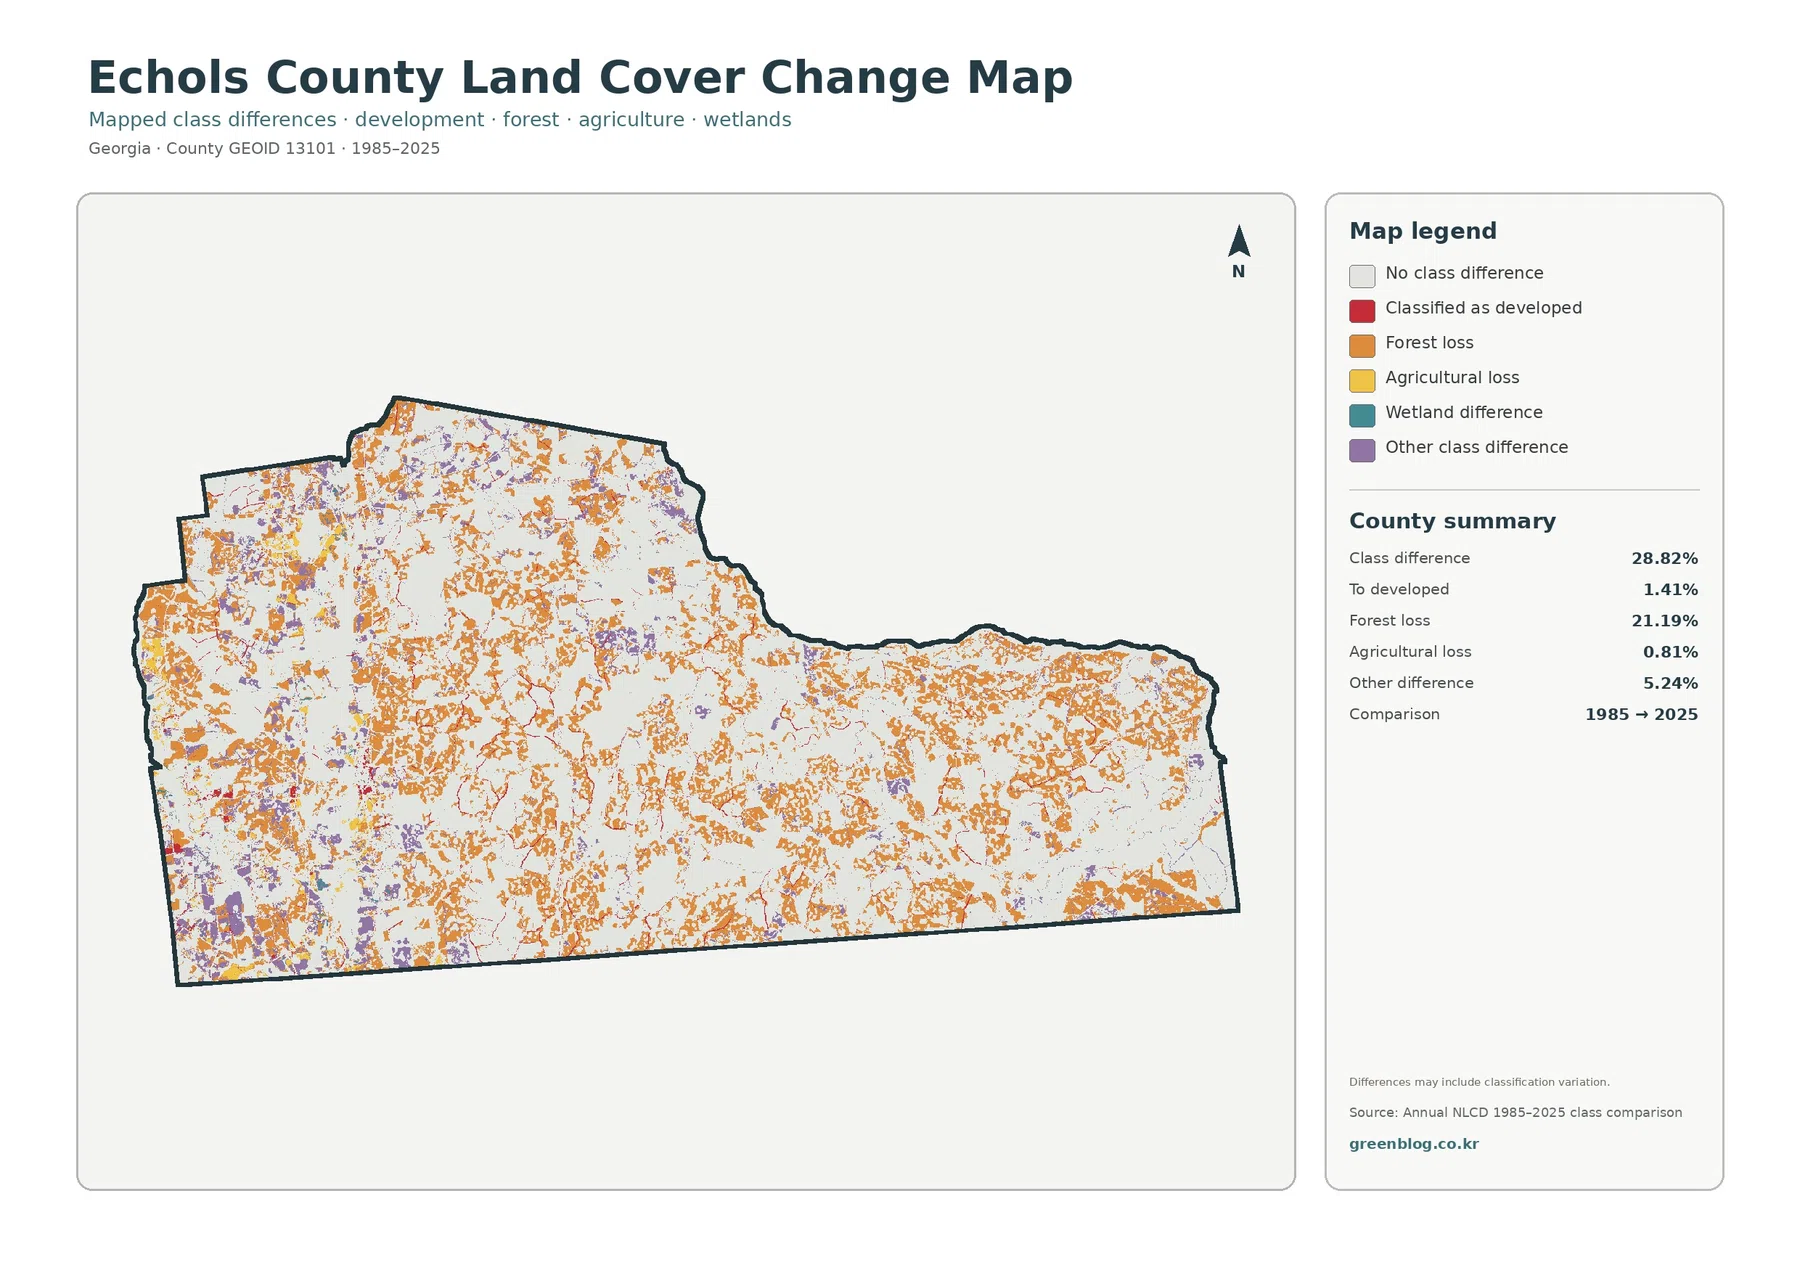
The endpoint comparison reports a class difference for 28.82% of Echols County between 1985 and 2025. Forest loss is the largest named component at 21.19%. Other class differences account for 5.24%, cells classified as developed account for 1.41%, and agricultural loss accounts for 0.81%. Orange forest-loss cells appear throughout the county instead of being confined to one settlement.
“Forest loss” on this map means that a cell classified as forest in 1985 received a different class in 2025. It does not prove that every orange cell was permanently cleared, converted to a building site, or damaged. Timber cycles, vegetation stages, shifts among shrub, grass, wetland, and agricultural classes, and classification variation can all affect an endpoint comparison.
The 1.41% developed-transition value is much smaller than the total 28.82% class-difference value. For that reason, it would be inaccurate to describe the map as showing nearly 29% urbanization. The large difference total is a collection of several class changes, with forest-to-other classification making up most of the named change shown in the summary.
This map works best as a screening layer. It can point a researcher toward places where older aerial photographs, intermediate Annual NLCD years, forestry records, or field observations may be worth checking. It cannot identify the exact year of a change, the land-management decision behind it, or whether a class later changed again between the two endpoints.
Statenville and the Alapaha River add useful local reference points
The supplied land-cover maps intentionally focus on cover classes rather than place labels, so a separate reference map helps when discussing local names. Echols County’s official site identifies Statenville as the county seat. USGS also maintains a long-standing monitoring location named Alapaha River at Statenville, confirming a major river reference in the same part of the county.
The Alapaha River site is part of the Suwannee River basin. That hydrologic setting is useful background for a county where wetlands are the dominant mapped cover, but the land-cover images should not be used as flood maps. A wetland class, a river corridor, a regulatory wetland boundary, and a floodplain are different kinds of information and may not coincide exactly.
Echols County also lies along the Florida line. Its long southern edge is easy to recognize in the county outline, while the interior remains dominated by natural-cover colors. If a project needs the legal county or state boundary at working scale, use an official boundary product such as Census TIGER/Line rather than tracing the thick outline from a presentation map.
Choosing the right map for a report or lesson
Start with the 2025 land-cover map when the main question is, “What covers most of Echols County?” It immediately establishes wetlands as the dominant class and shows forest, grassland, shrubland, agriculture, and development in the same frame. That makes it the strongest general-purpose image for a county profile or overview slide.
Use the forest-and-farmland view when the discussion turns to working land or natural vegetation. The western concentration of agricultural blocks becomes clearer, and readers can compare those blocks with the much larger wetland and forest areas. The impervious map is better for a development-density question because it removes most vegetation detail and isolates hard surfaces.
The change map belongs in a different part of a presentation. It does not describe today’s dominant cover; it compares two classification endpoints. Pairing it with the 2025 map lets a reader distinguish current conditions from long-term class differences. A caption or note should state that change colors are classifications, not a direct record of cause.
Using all four maps together is particularly helpful in environmental education. Students can see why developed land and impervious surface are not the same measure, why wetlands can be much more extensive than open water, and why an endpoint change category requires more evidence before assigning a cause. Those distinctions matter more than simply memorizing the percentages.
Scale, classification, and date limits
Annual NLCD is based on 30-meter raster cells. A single cell can contain a road, a ditch, a stand of trees, grass, and part of a field, yet the land-cover product assigns a predominant class. Zooming in makes the cell larger on screen; it does not create parcel detail that was not present in the source.
Impervious-surface data answer a somewhat different question by estimating the hard-surface fraction within a cell. Even so, the layer is not a building-footprint or pavement survey. The 0.92% county mean is an average across a large rural area, so individual road intersections, facilities, or small settlements may have much higher local values.
The current maps represent the supplied 2025 observation year. Construction, timber harvest, crop changes, storms, drainage changes, and vegetation recovery after that date may not appear. The 1985–2025 comparison is also an endpoint comparison rather than a year-by-year history, so it cannot show how many times a location changed class during the forty-year interval.
Each downloadable JPG is 2480 × 1754 pixels. That size works well for screen viewing, documents, lessons, and many presentation layouts. The package does not mark the maps as meeting an A3 high-resolution reference, so users planning a large print should make a test print and check the legend and labels before final production.
Four original JPG files in the download
The ZIP contains one JPG each for 2025 land cover, forest and farmland, impervious surface and developed land, and the 1985–2025 land-cover comparison. Use the countywide map for orientation, then add the map that directly matches the question instead of treating the four images as interchangeable versions of the same graphic.
Frequently Asked Questions
Why are wetlands 42.55% when open water is only 0.14%?
Open water mainly represents exposed water surfaces, while wetland classes can include saturated soils and water-influenced vegetation. Echols County therefore can have extensive wetland cover even though the mapped area of open blue water is very small.
Why is developed cover 5.31% but mean impervious cover only 0.92%?
Developed land-cover classes can contain lawns, trees, soil, and other permeable surfaces around roads and buildings. Impervious cover isolates pavement, rooftops, and similar hard materials, so the countywide impervious percentage is lower.
Does 21.19% forest loss mean one-fifth of the county was permanently cleared?
No. It means cells classified as forest in 1985 received another class in 2025. Timber cycles, vegetation transitions, shifts into other land-cover classes, and classification variation can contribute, so the map does not by itself establish permanent clearing or a specific cause.
Sources and Reference Data
- MRLC Annual NLCD Data – official access point for current and historical Annual NLCD products
- USGS Annual NLCD Land Cover Classification – class definitions and guidance for forest, wetlands, developed land, agriculture, and related surfaces
- U.S. Census Bureau TIGER/Line Shapefiles – official county-boundary reference for Echols County
- Echols County – Mission / Goals – county information on the Florida-line location, rural setting, and Statenville
- UGA Extension – Echols County Our Impact – local vegetable, row-crop, and agricultural and natural-resource program context
- USGS Alapaha River at Statenville – river monitoring location and Suwannee River basin reference in Echols County
Map File Information
The ZIP contains four original JPG maps for comparing Echols County's wetlands, forest, western farm blocks, sparse hard surfaces, and 1985–2025 class differences.
- Included Files: Four original JPG land-cover maps used in this article
- File Type: JPG images packaged in a ZIP archive
- Intended Use: Printing, education, presentations, and map-based projects
Related Maps
- Appling County Georgia Land Cover Map
- Atkinson County Georgia Land Cover Map
- Bacon County Georgia Land Cover Map
Green Map creates custom-edited map images using open geographic data sources such as geoBoundaries, Natural Earth, OpenStreetMap, and government open data. These maps are edited visual materials, not raw data files, and are provided for education, documents, presentations, and graphic reference.