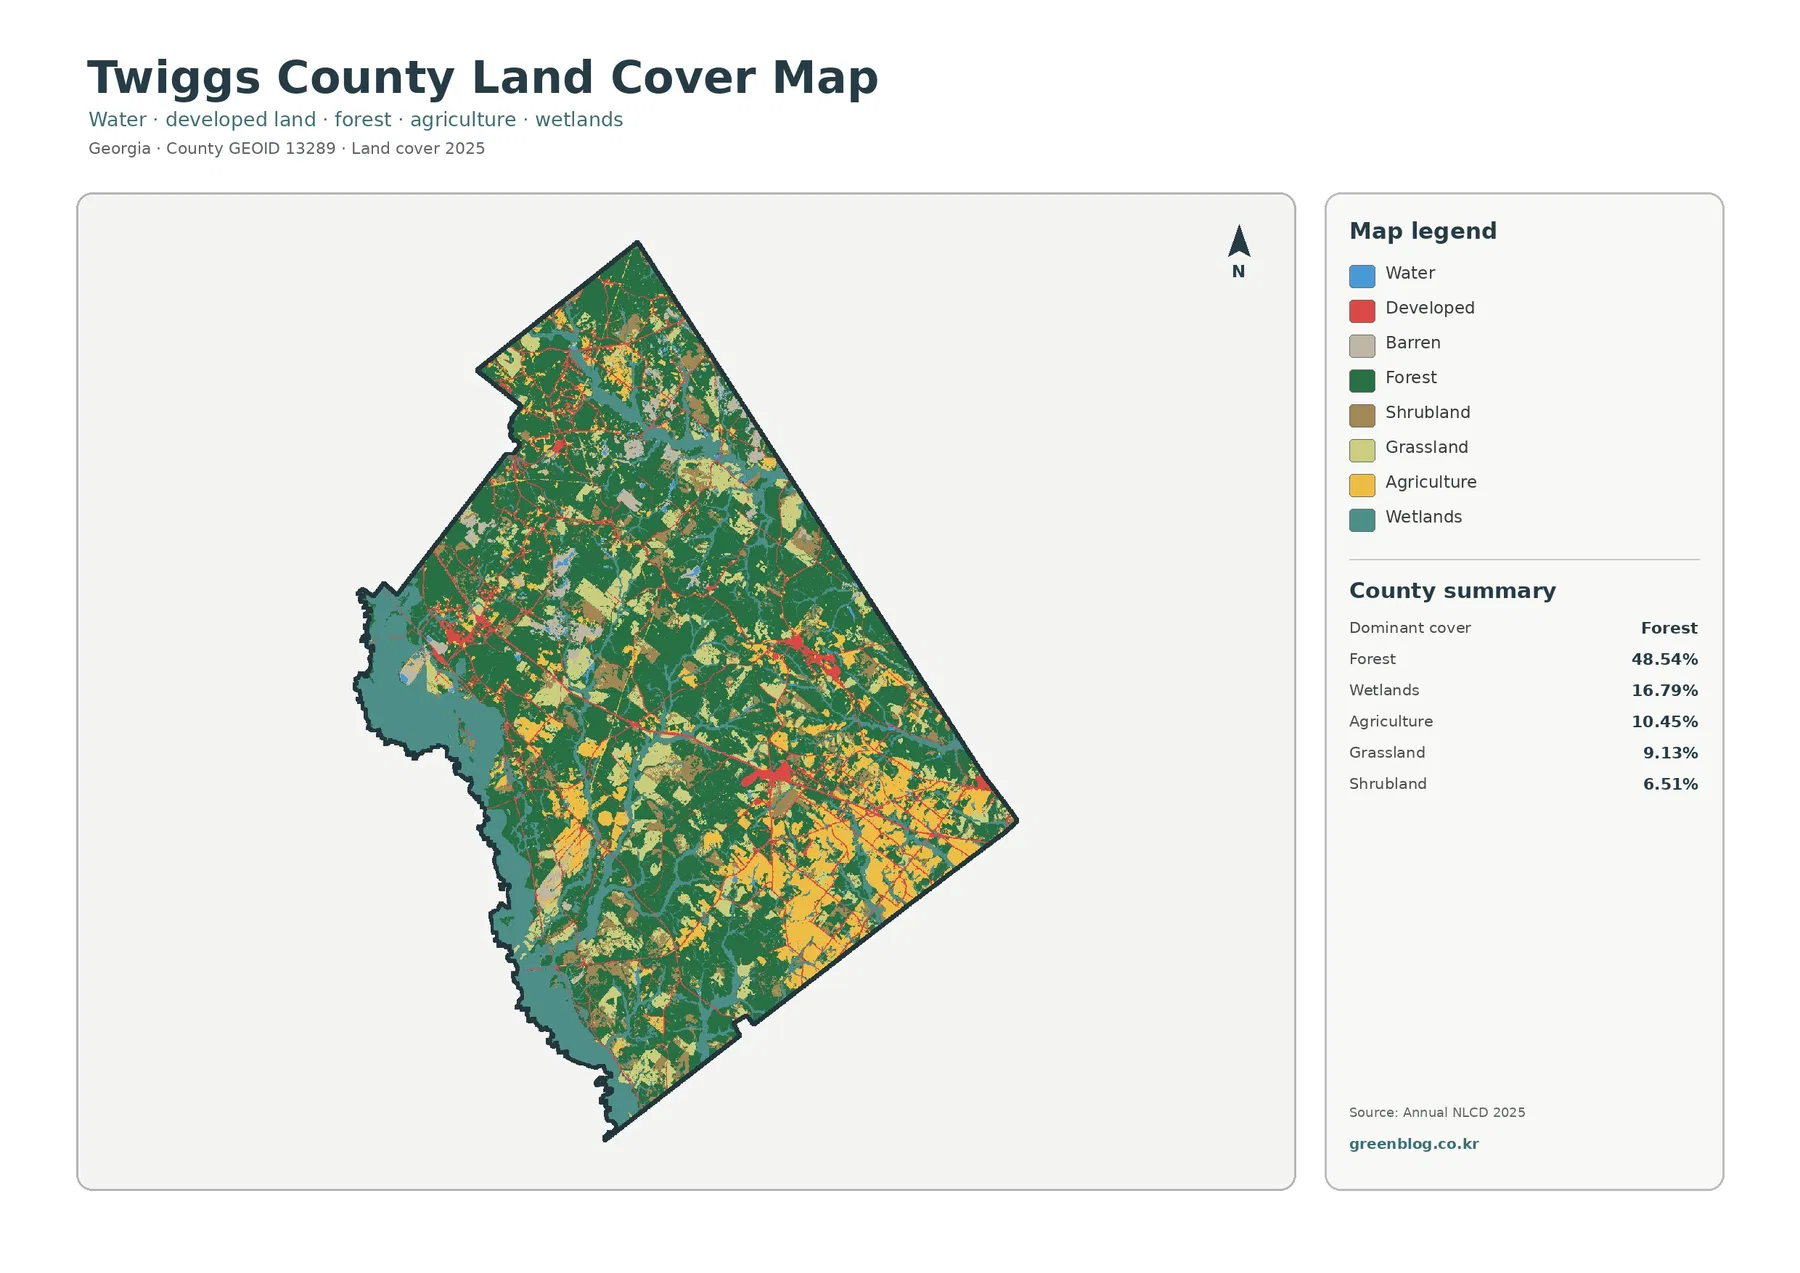
Twiggs County sits in central Georgia where a low western river edge, a more rolling interior, and a small set of incorporated places create an easy-to-recognize geography. The maps on this page are designed to answer different practical questions without turning the county into a dense technical diagram: where the boundary runs, how Jeffersonville and Danville are positioned, which named creeks cross the county, and how elevation changes between the Ocmulgee side and the higher ground to the east. A downloadable ZIP with four high-resolution A3 JPG maps is provided for readers who need files for printing, classwork, presentations, or local reference.
The strongest visual contrast is west versus interior. Along the western side, the county boundary follows the Ocmulgee River area and the elevation map stays largely in the lower green range. Farther east, ridges and narrow valleys become more noticeable, with higher tan and brown terrain in the north, east, and parts of the southeast. Jeffersonville is not on that western river edge; it lies east of center where several numbered roads come together, so the human travel pattern and the natural terrain pattern are easiest to understand when the maps are compared rather than read in isolation.
This page is a general geographic reference, not a parcel, flood-hazard, navigation, or engineering product. The county and city maps intentionally emphasize selected places and major routes instead of every local road or community. The water map identifies the Ocmulgee River and a number of named creeks, while the elevation map summarizes terrain across the county. That separation keeps each file readable and also makes it easier to choose only the map that fits a particular task.
Table of Contents
Roads and boundary give Twiggs County its first orientation
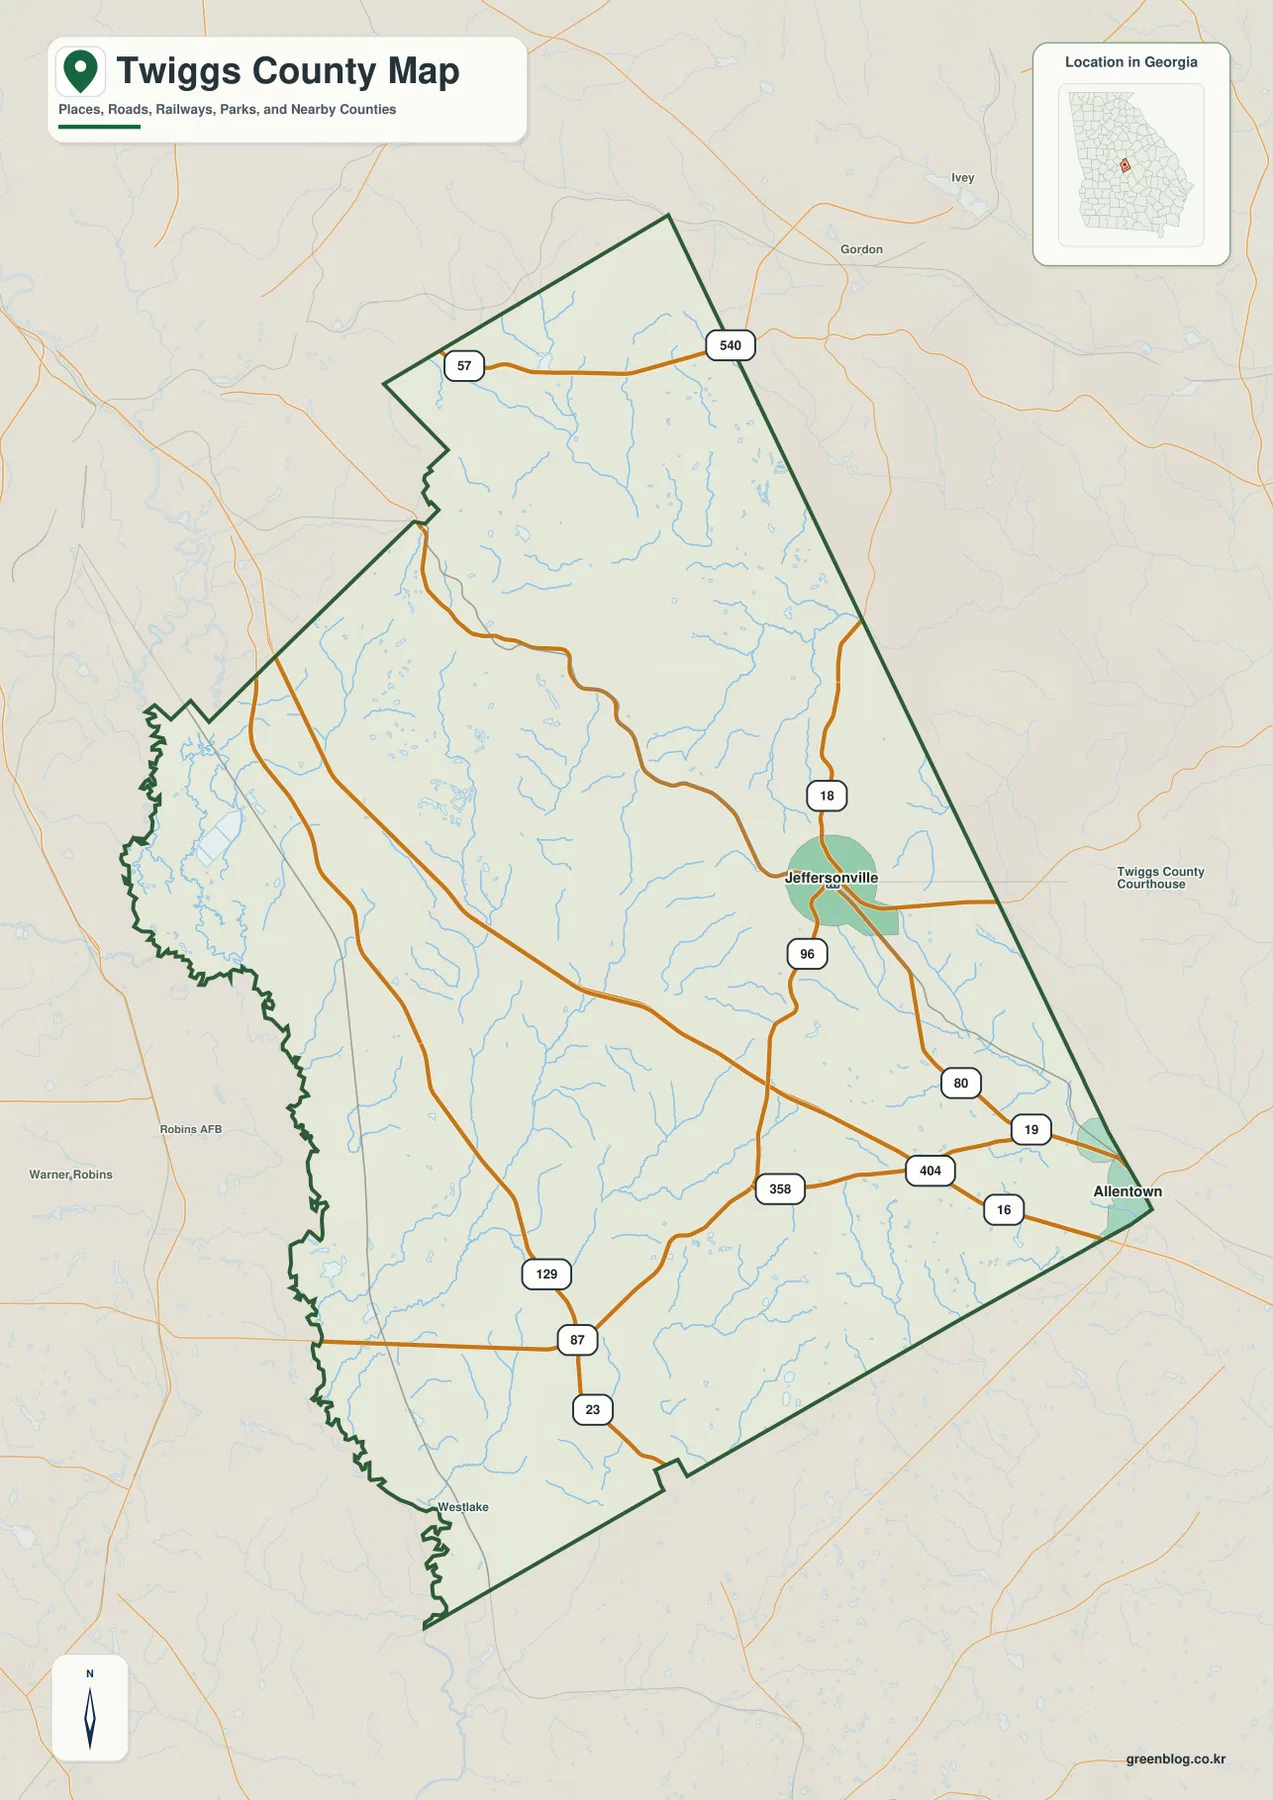
Start with the county map if you are unfamiliar with Twiggs County. Jeffersonville appears in the east-central part of the county, and route labels 18 and 96 are shown close to town. Other numbered roads appear across the southern and western portions, including 80, 19, 16, 23, 87, and 129, while 57 and 540 are visible farther north. The map is not intended to catalog every street, but it gives enough structure to see that the road network is not concentrated solely at the county seat; several through-routes cross the county from different directions.
The outline itself tells another part of the story. Much of the eastern and southeastern boundary is comparatively straight, while the western edge becomes jagged and irregular. When this outline is compared with the water map, that western shape makes sense because the Ocmulgee River forms the dominant natural feature on that side. A reader looking only at an abstract county outline might miss this relationship, but the combined road, stream, and boundary view makes it immediately visible.
The map also helps place Twiggs County among its neighbors. The city-oriented preview labels Jones County to the north, Wilkinson and Laurens counties to the east, Baldwin County toward the southeast, and Bleckley, Houston, and Bibb counties to the west and southwest. These labels are useful for regional orientation, but the page should not be used to settle a legal boundary question. Survey, deed, tax parcel, and jurisdictional decisions require the appropriate official records.
Elevation rises away from the Ocmulgee side
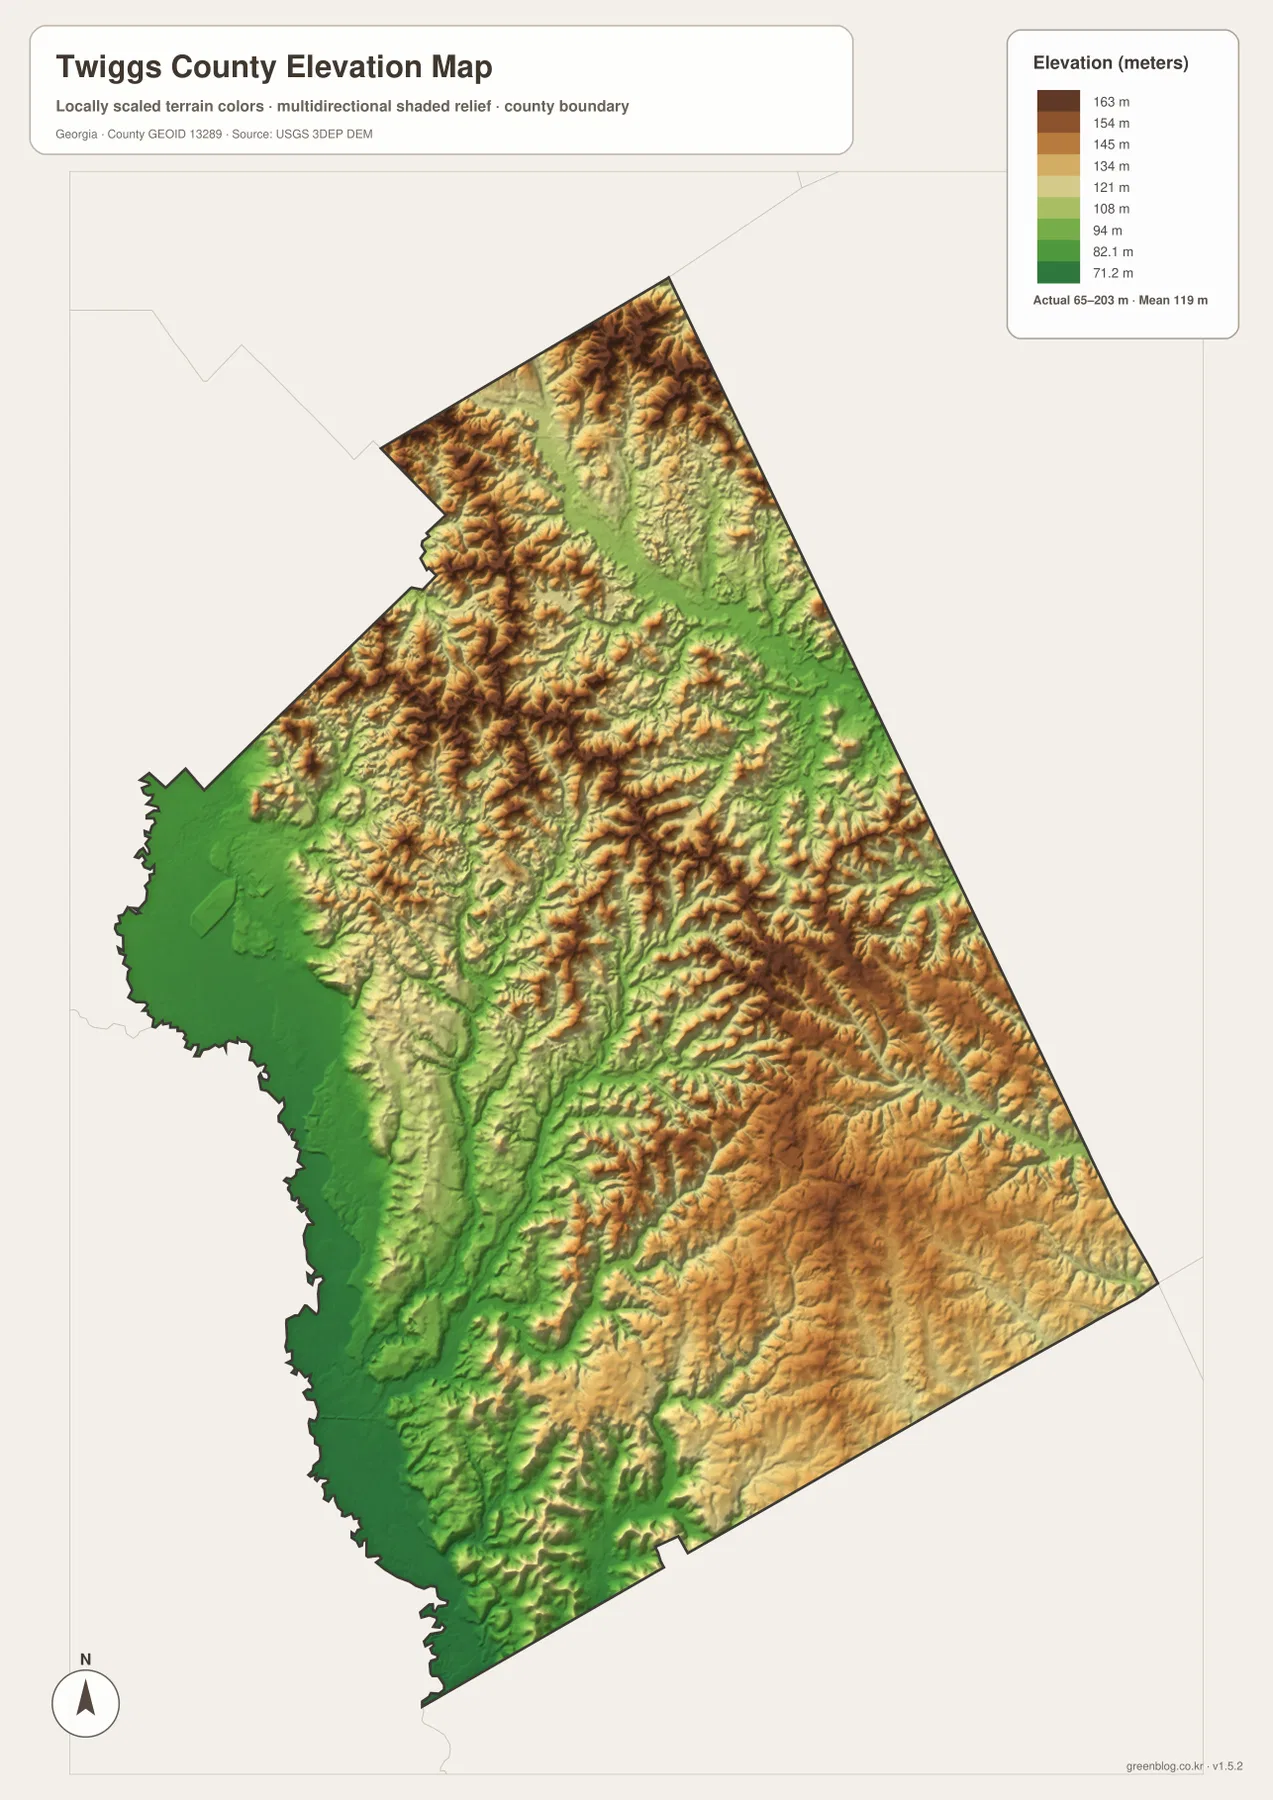
The elevation map provides the clearest explanation for why different parts of the county look and feel different on the other maps. Its legend shows an actual range of roughly 65 to 203 meters, with a mean near 119 meters. Darker greens mark the lower ground, and those colors occupy a broad strip along the western side. Moving toward the center, north, and east, the surface becomes more varied and shifts through lighter greens, tans, and browns as ridges rise above the lower valleys.
Northern Twiggs County has a tightly textured pattern of ridges and narrow low areas, while the southeast includes a broad zone of relatively elevated terrain. The center is mixed rather than uniformly high or low: green valleys thread through higher ground, producing a repeated ridge-and-valley appearance. That matters when reading the water map because many small streams occupy the lower lines between those ridges instead of crossing a flat, featureless surface.
The western lowland is especially clear. The Ocmulgee-side edge stays low for a long distance, and the green terrain extends inward in several places where tributary valleys reach toward the interior. This does not mean every green area is a floodplain, nor does the map show flood probability. It simply shows relative elevation at county scale. For a construction site, precise drainage design, or a specific property elevation, survey-grade or site-specific data would be necessary.
Creeks fill the terrain between the river and the eastern ridges
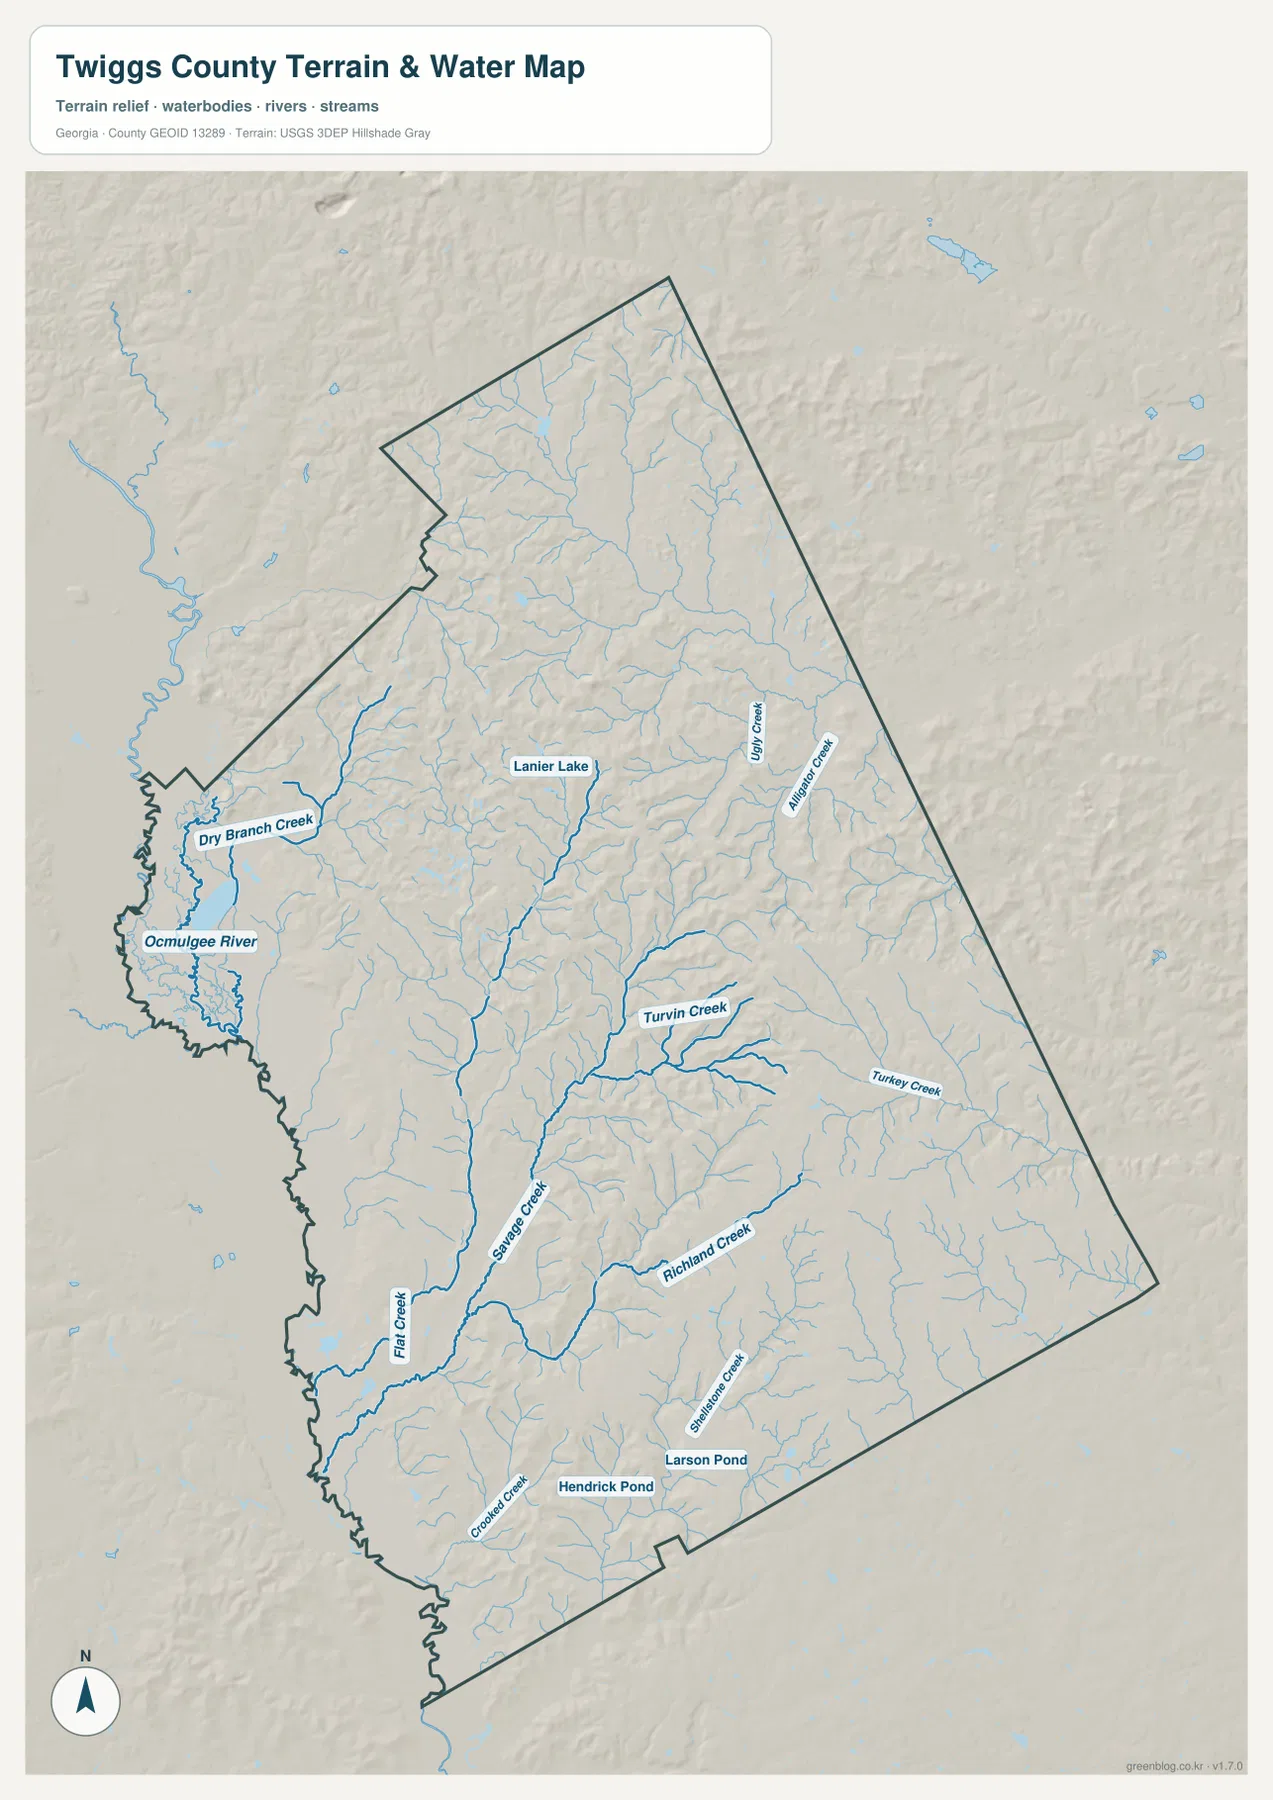
The water map adds names to the blue network that is only lightly visible on the general map. The Ocmulgee River runs along the western edge and is the most important single water feature in the frame. Near the northwest, Dry Branch Creek is labeled close to that river side. Farther south and toward the center, Savage Creek and Flat Creek stand out, while Turvin Creek and Richland Creek occupy the central-to-eastern part of the county.
Additional labels show how widespread the smaller drainage network is. Turkey Creek appears on the eastern side, Glynn Creek and Mallory Creek are labeled in the north and northeast, and Shady Grove Creek and Crooked Creek are visible farther south. Lanier Lake is marked north of the county center, while Hendrick Pond and Larson Pond appear in the southern portion. These named features give readers much better reference points than a generic statement that the county contains streams and ponds.
The map is most useful when a place description depends on water. Someone writing about the western edge can use the Ocmulgee River as the main reference, while a reader working in the interior can locate a named creek and then compare it with nearby roads or higher ridges. Because the map focuses on hydrography and terrain, it should not be interpreted as a flood insurance map, navigational chart, water-quality report, or statement about legal access to a waterbody.
Comparing the water and elevation views reveals a useful county-specific pattern. The Ocmulgee side occupies the lowest broad area, and several interior streams trace lower corridors through the rolling terrain. The relationship is visible without assuming that every valley floods or that every creek is permanent at the same flow level. The map is best treated as a geographic reference for where named water features sit within the larger terrain.
Jeffersonville and Danville show the county’s sparse settlement pattern
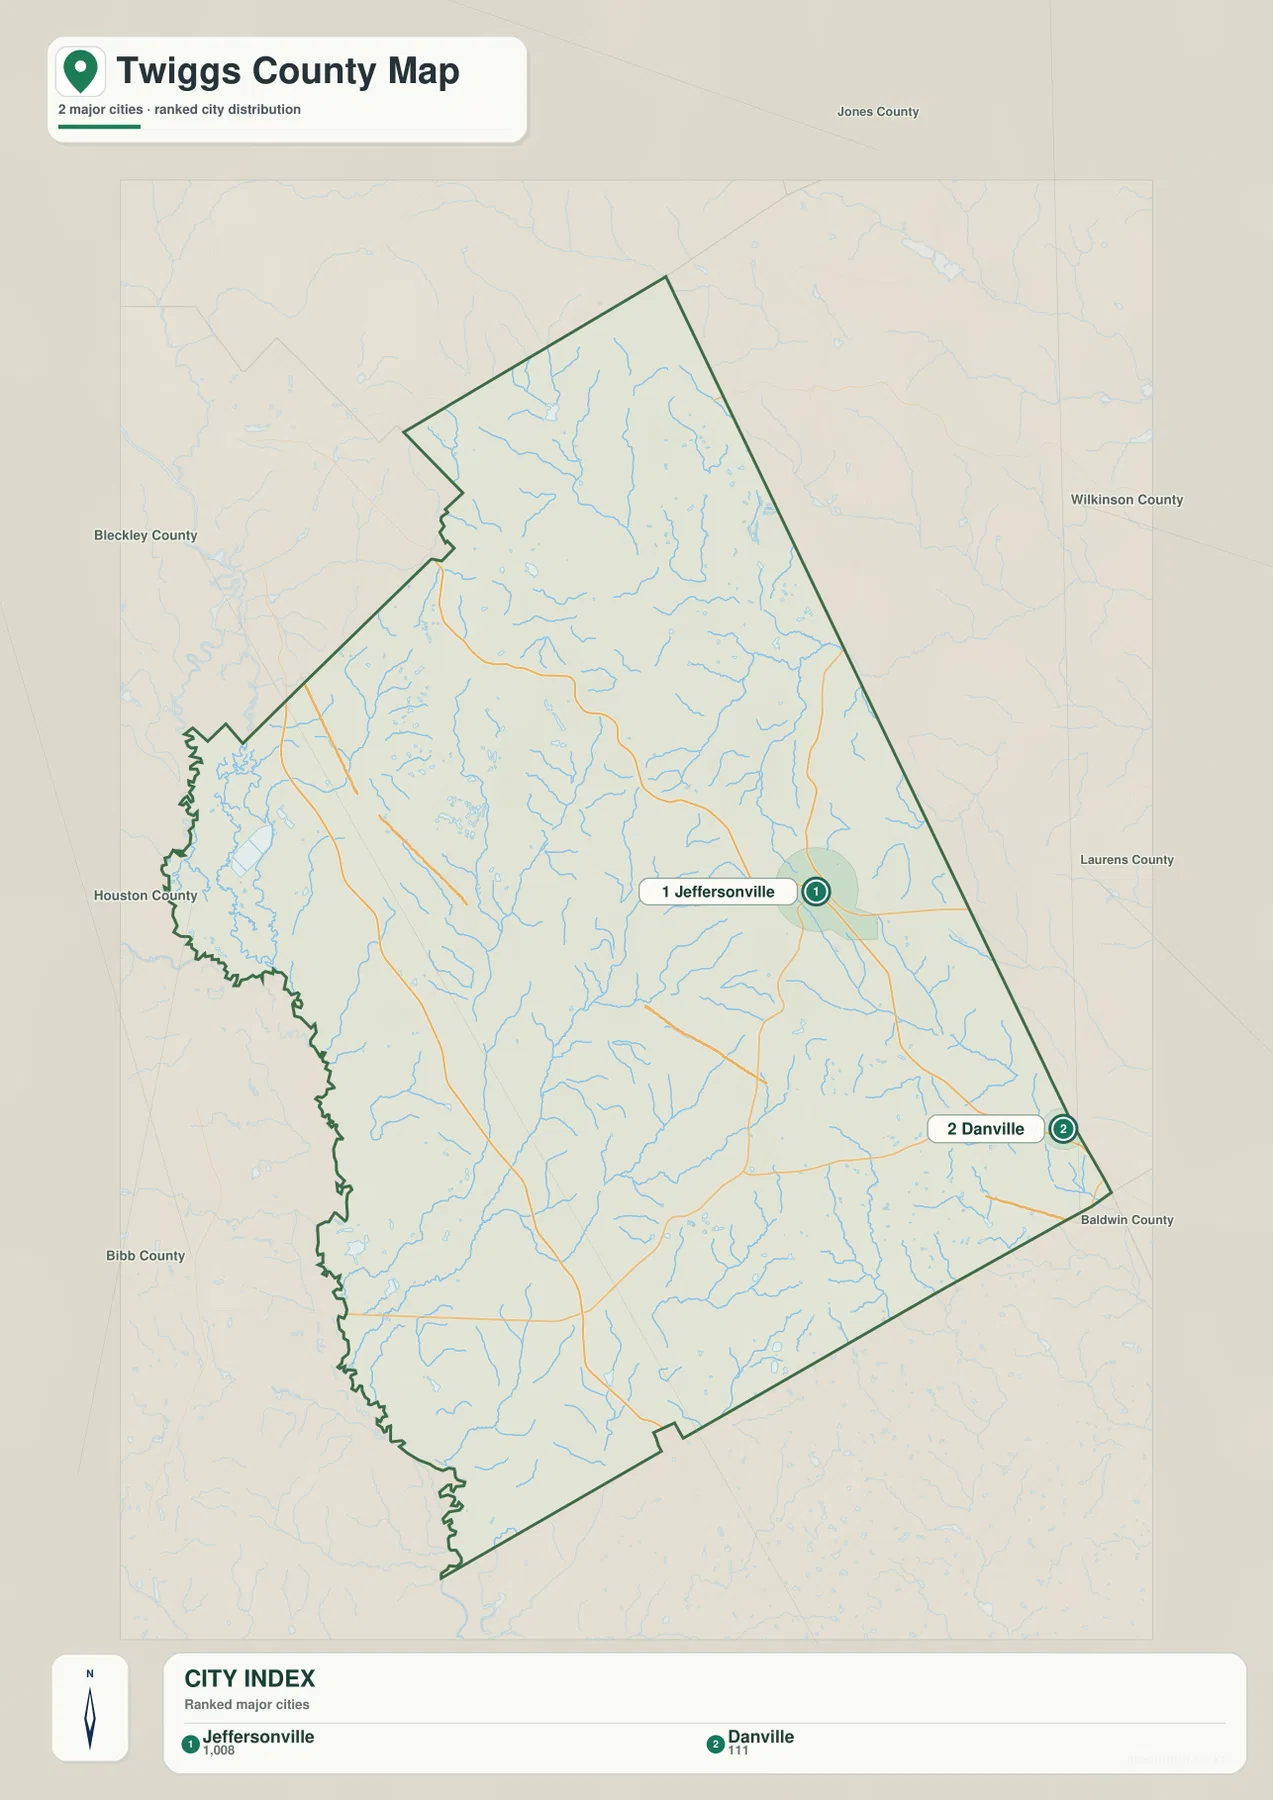
The city map deliberately removes much of the extra detail so that the relationship between Jeffersonville and Danville is easy to see. Jeffersonville, the county seat, is positioned east of the geographic center. Danville lies farther southeast, close to the edge of the county. The two places therefore form a northwest-to-southeast relationship rather than a cluster in one small area. That simple orientation is useful when a report or lesson needs to explain where the county’s principal incorporated places are located.
Jeffersonville also makes sense as the main orientation point when the city and road maps are viewed together. The county map shows several routes converging in or near the town, while the city map strips away those route labels and makes the settlement position clearer. Danville, by contrast, is easier to understand as a southeastern reference point. Readers approaching the county from that direction can use Danville first and then look northwest toward Jeffersonville.
A sparse city map should not be mistaken for a complete community inventory. Twiggs County includes places and local references that are not labeled in this simplified city view, and the file does not claim to map every unincorporated community, service district, mailing area, or municipal boundary. Its purpose is narrower: to provide a clean visual relationship between the principal labeled places and the county outline.
Choosing the right map for a specific Twiggs County question
The four files become more useful when each is matched to a question instead of treated as interchangeable artwork. For route and boundary orientation, the general county map gives the most context because roads, the outline, streams, and Jeffersonville appear together. When the question is simply where Jeffersonville and Danville sit relative to one another, the city map is cleaner. A creek name or river-side location is easier to find on the water map, and the elevation map is the best choice when the subject is the low Ocmulgee margin versus the rolling higher interior.
That distinction also prevents common map-reading mistakes. A blue stream line does not identify a regulatory flood zone. A colored elevation surface does not provide a survey elevation for a building lot. A county outline does not replace a deed or parcel layer, and the city view does not show every local place. Each file is intentionally simplified so that its main question can be answered quickly without burying the reader in unrelated detail.
| Question | Best file and the Twiggs County detail it emphasizes |
|---|---|
| Where are the main roads and county boundary? | County map — Jeffersonville, major route numbers, and the irregular western edge |
| Where are Jeffersonville and Danville? | City map — a clean east-central to southeastern settlement relationship |
| Which named waterways cross the county? | Water map — Ocmulgee River plus Dry Branch, Savage, Turvin, Richland, Turkey, and other creeks |
| Where is the county lower or higher? | Elevation map — roughly 65–203 m, with low western river terrain and higher inland ridges |
The WEBP images in the article are lightweight previews intended for on-page viewing. For printing or reuse in a separate document, the downloadable archive is the better choice. It contains the county, city, water, and elevation maps as four original high-resolution A3 JPG files, so you can keep the complete set or use only the file relevant to your project.
Frequently Asked Questions
Why does the western side of Twiggs County look lower on the elevation map?
The broad low area follows the Ocmulgee River side of the county. The elevation map uses green for lower terrain, while higher ridges farther inland shift toward tan and brown. The pattern is a county-scale terrain reference and should not be interpreted as a flood-zone boundary.
Which map is best for locating Jeffersonville and Danville?
Use the city map for the quickest comparison. Jeffersonville is shown east of center and Danville farther southeast near the county edge. If you also need route numbers or through-road context, compare the city view with the general county map.
Can the Twiggs County water map be used as a flood map?
No. It identifies the Ocmulgee River, named creeks, small waterbodies, and surrounding terrain, but it does not show regulatory flood zones, flood frequency, or insurance boundaries. Use the appropriate official flood-hazard resources for those decisions.
Sources and map-use limits
The page combines several kinds of geographic information, so no single source is expected to answer every question. County facts and background can be checked against Census and Georgia reference material, while boundary, hydrography, and elevation details are better matched to the federal mapping sources listed below.
- U.S. Census Bureau QuickFacts for Twiggs County
- New Georgia Encyclopedia entry for Twiggs County
- U.S. Census Bureau TIGER/Line boundary and road data
- USGS National Hydrography
- USGS 3D Elevation Program
These maps work well for general orientation, education, print reference, and presentations. They should not replace current agency records for property boundaries, legal jurisdiction, flood insurance, navigation, emergency response, engineering design, or any decision that depends on site-level precision.
Map File Information
Get the Twiggs County county, city, water, and elevation maps as high-resolution A3 JPG files. All four maps are included in one ZIP archive.
- Included Files: County map, city map, water map, elevation map
- File Type: ZIP containing four high-resolution A3 JPG files
Related Maps
Green Map creates custom-edited map images using open geographic data sources such as geoBoundaries, Natural Earth, OpenStreetMap, and government open data. These maps are edited visual materials, not raw data files, and are provided for education, documents, presentations, and graphic reference.