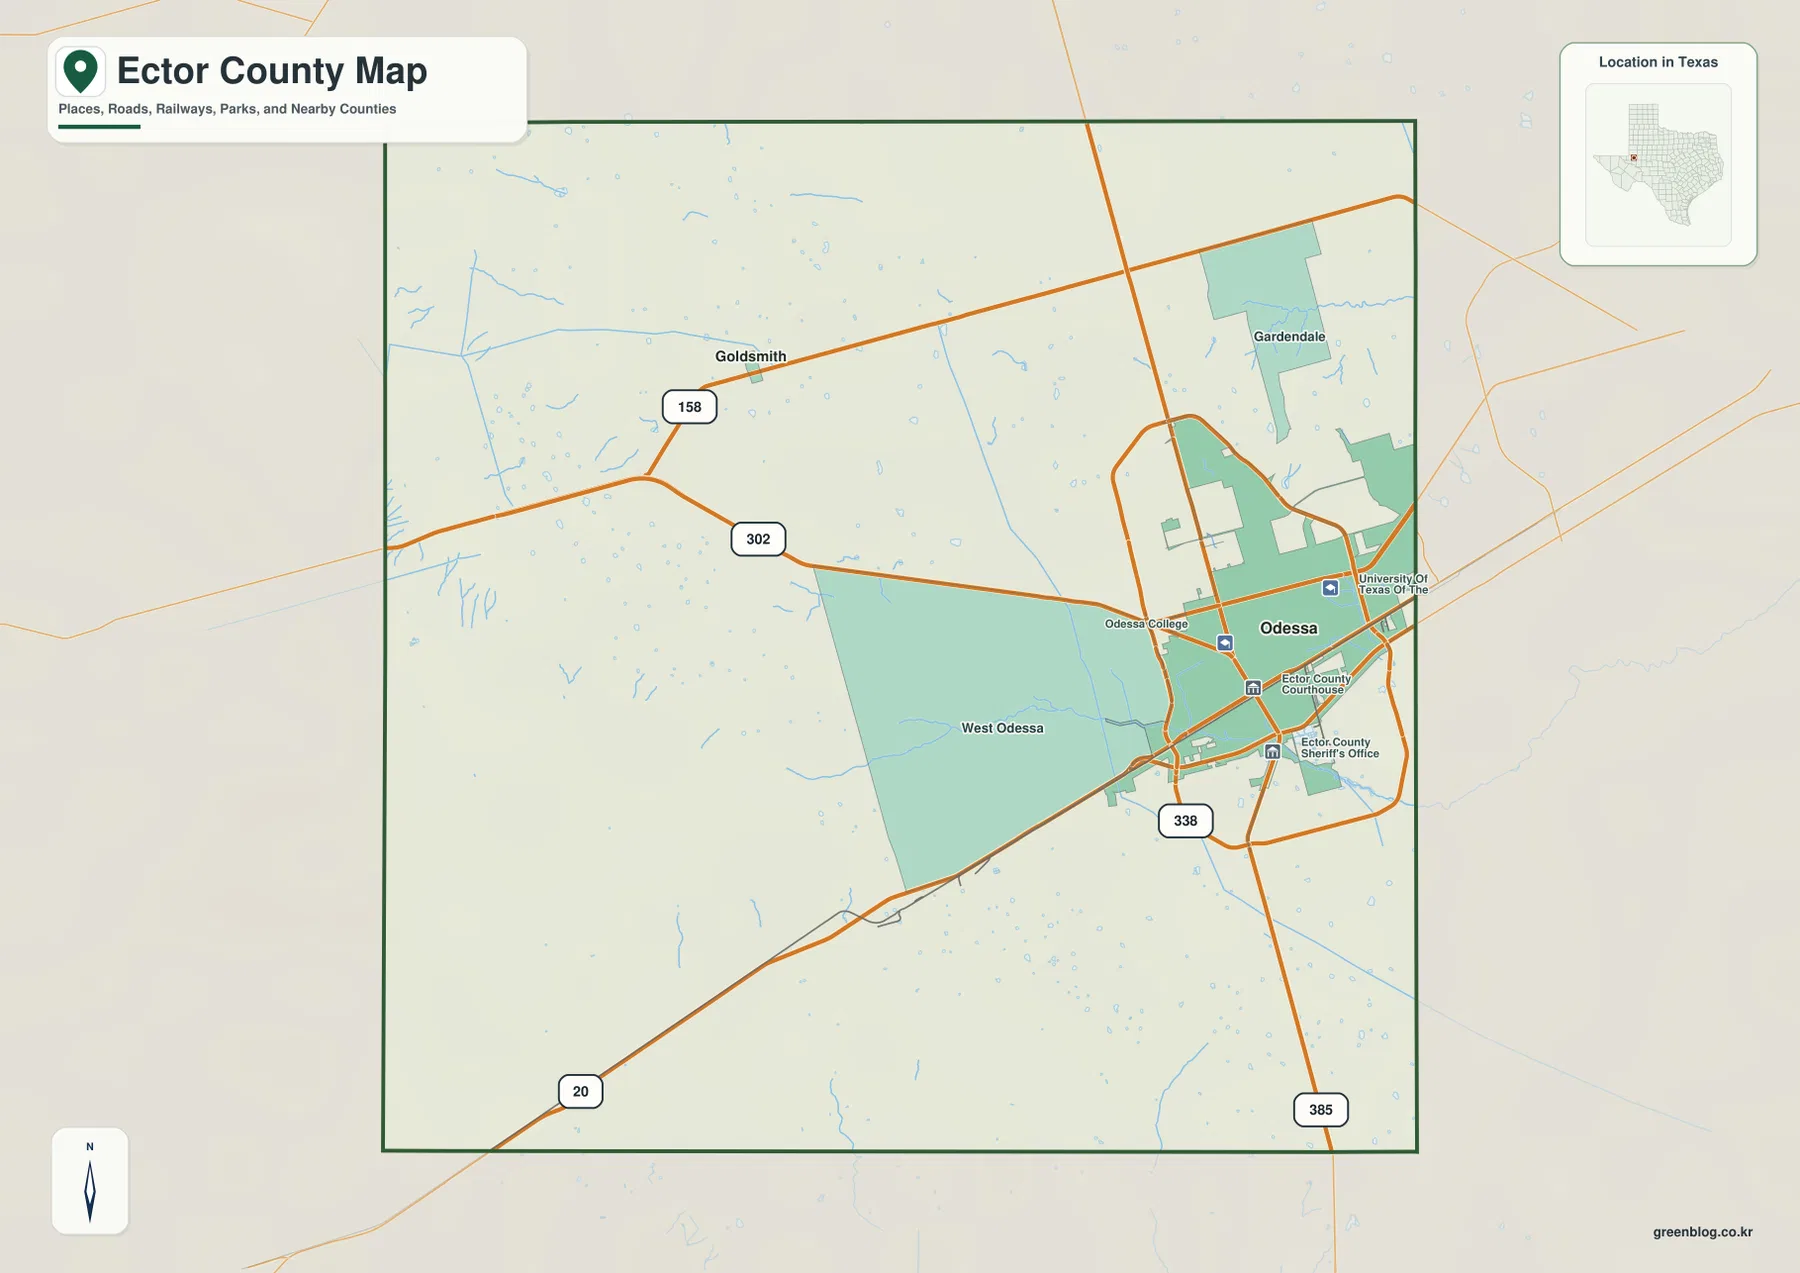
Ector County is organized around one unmistakable urban center. Odessa occupies the southeastern side of the county, West Odessa extends the developed area farther west, Goldsmith sits well to the northwest, and Gardendale appears northeast of Odessa. The road map reinforces that contrast: I-20 crosses the south side of Odessa, US 385 runs north-south, Loop 338 wraps around the city, and SH 302 and SH 158 reach toward the more open western and northwestern parts of the county. The same four map themes shown in this article are also available as high-resolution A3 JPG files in a single downloadable ZIP.
The county becomes more interesting when the road pattern is compared with water and elevation rather than treated as a single flat Permian Basin landscape. The city map reduces the settlement picture to Odessa and Goldsmith, making their huge difference in size easy to see. The water map emphasizes Monahans Draw, several small named lakes, reservoirs, and drainage channels instead of a large river. The elevation map then shows a clear high area in the northwest and lower ground across much of the east and south. Those contrasts give each map a different job without turning the page into a repeated inventory of map types.
Table of Contents
Odessa’s Dense Road Cluster and the Open Northwest
The county map is most detailed around Odessa. Loop 338 forms a broad ring around the urban area, US 385 provides a strong north-south route, and I-20 crosses the southern side of the city before continuing beyond the county. SH 302 approaches Odessa from the west, while SH 158 reaches the Goldsmith area farther north. West Odessa fills a broad developed area west of the main city, so the transition from Odessa to West Odessa is visually gradual compared with the much larger gap between Odessa and Goldsmith.
Several civic and educational labels are concentrated in the Odessa area, including Odessa College, the University of Texas of the Permian Basin, the Ector County Courthouse, and the sheriff’s office. Gardendale is marked northeast of the city, beyond the densest street pattern. Farther west and northwest, roads remain visible but major settlement labels become sparse. That makes the basic county map especially useful for seeing that Ector County is not evenly urbanized: a large eastern-southeastern city zone gives way to much more open country toward Goldsmith.
A Two-Place City Index with a Very Large Size Gap
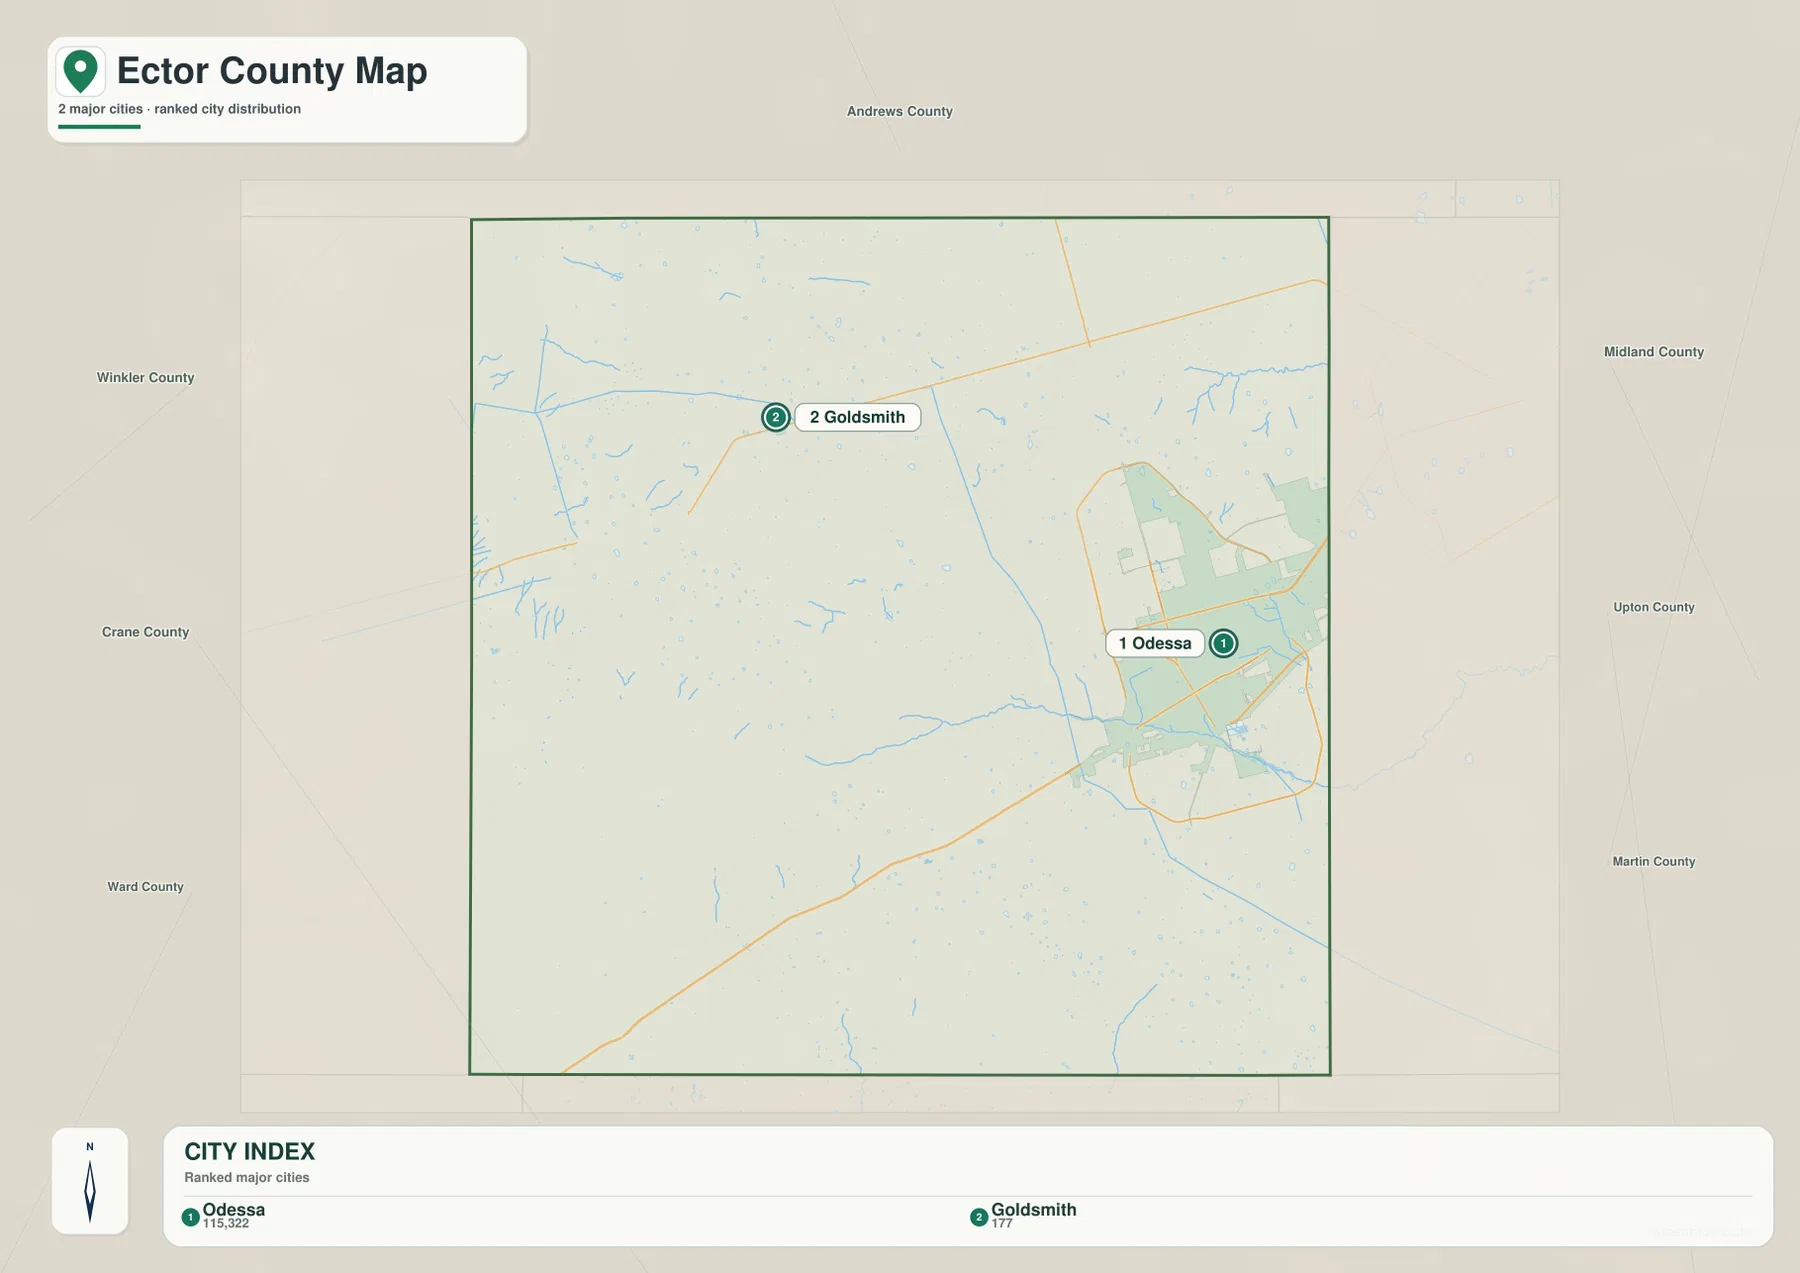
The city-distribution map ranks only two places. Its CITY INDEX lists Odessa first at 115,322 and Goldsmith second at 177, so the difference between the two entries is immediately obvious. Odessa is shown in the southeastern urban area, while Goldsmith is isolated in the northwest. The map therefore works less like a network of several comparable towns and more like a quick picture of one dominant city paired with a very small outlying community.
West Odessa and Gardendale are useful examples of why the city map should be read beside the county map. They are visible on the more detailed county map but are not separate ranked entries in the city index. West Odessa extends the built-up footprint west of Odessa, while Gardendale occupies a smaller area to the northeast. By comparing the two maps, a reader can distinguish the ranked-city summary from the broader pattern of named communities and developed areas that make up the county.
Monahans Draw and the County’s Scattered Small Water Features
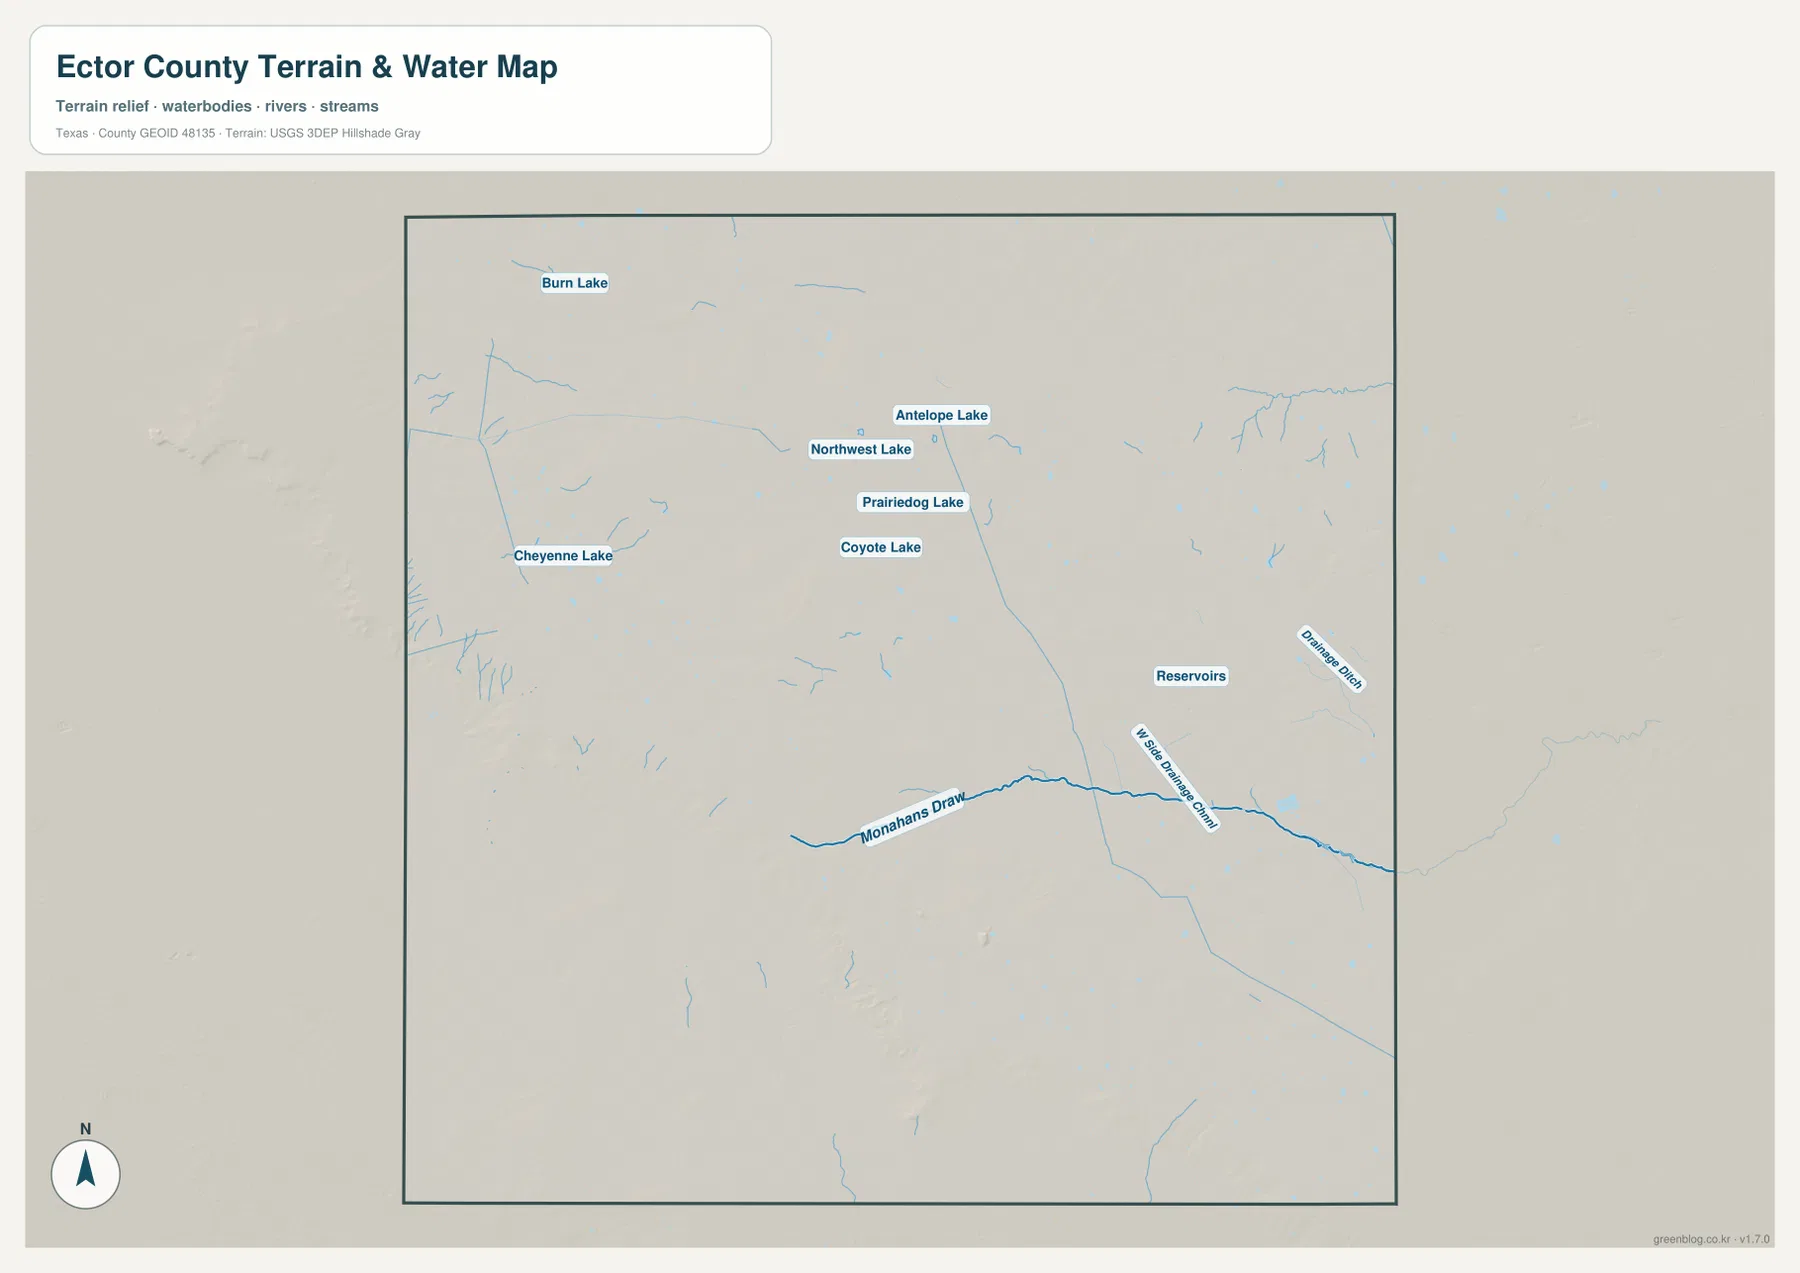
The water map does not show a large river crossing Ector County. Instead, Monahans Draw is the strongest named channel, running generally west to east across the southern-central part of the map. North of it are Burn Lake, Cheyenne Lake, Northwest Lake, Antelope Lake, Prairiedog Lake, and Coyote Lake. A separate “Reservoirs” label appears east of the center, and several smaller blue channels and drainage features are scattered around the county. The result is a water-reference map defined by small features rather than one dominant river or reservoir.
Monahans Draw is especially useful as a reference because it crosses a part of the county that looks comparatively open on the road map. Smaller drainage channels intersect or approach the draw, and a Drainage Ditch label appears farther east. When the Odessa area is located first on the county map and then compared with this water layer, the position of the draw south and west of the main urban concentration becomes easier to understand. This map is intended to show the location of water features; it should not be used as a flood-risk, depth, navigation, or legal shoreline map.
The Northwest Rises Above Odessa and the Lower East
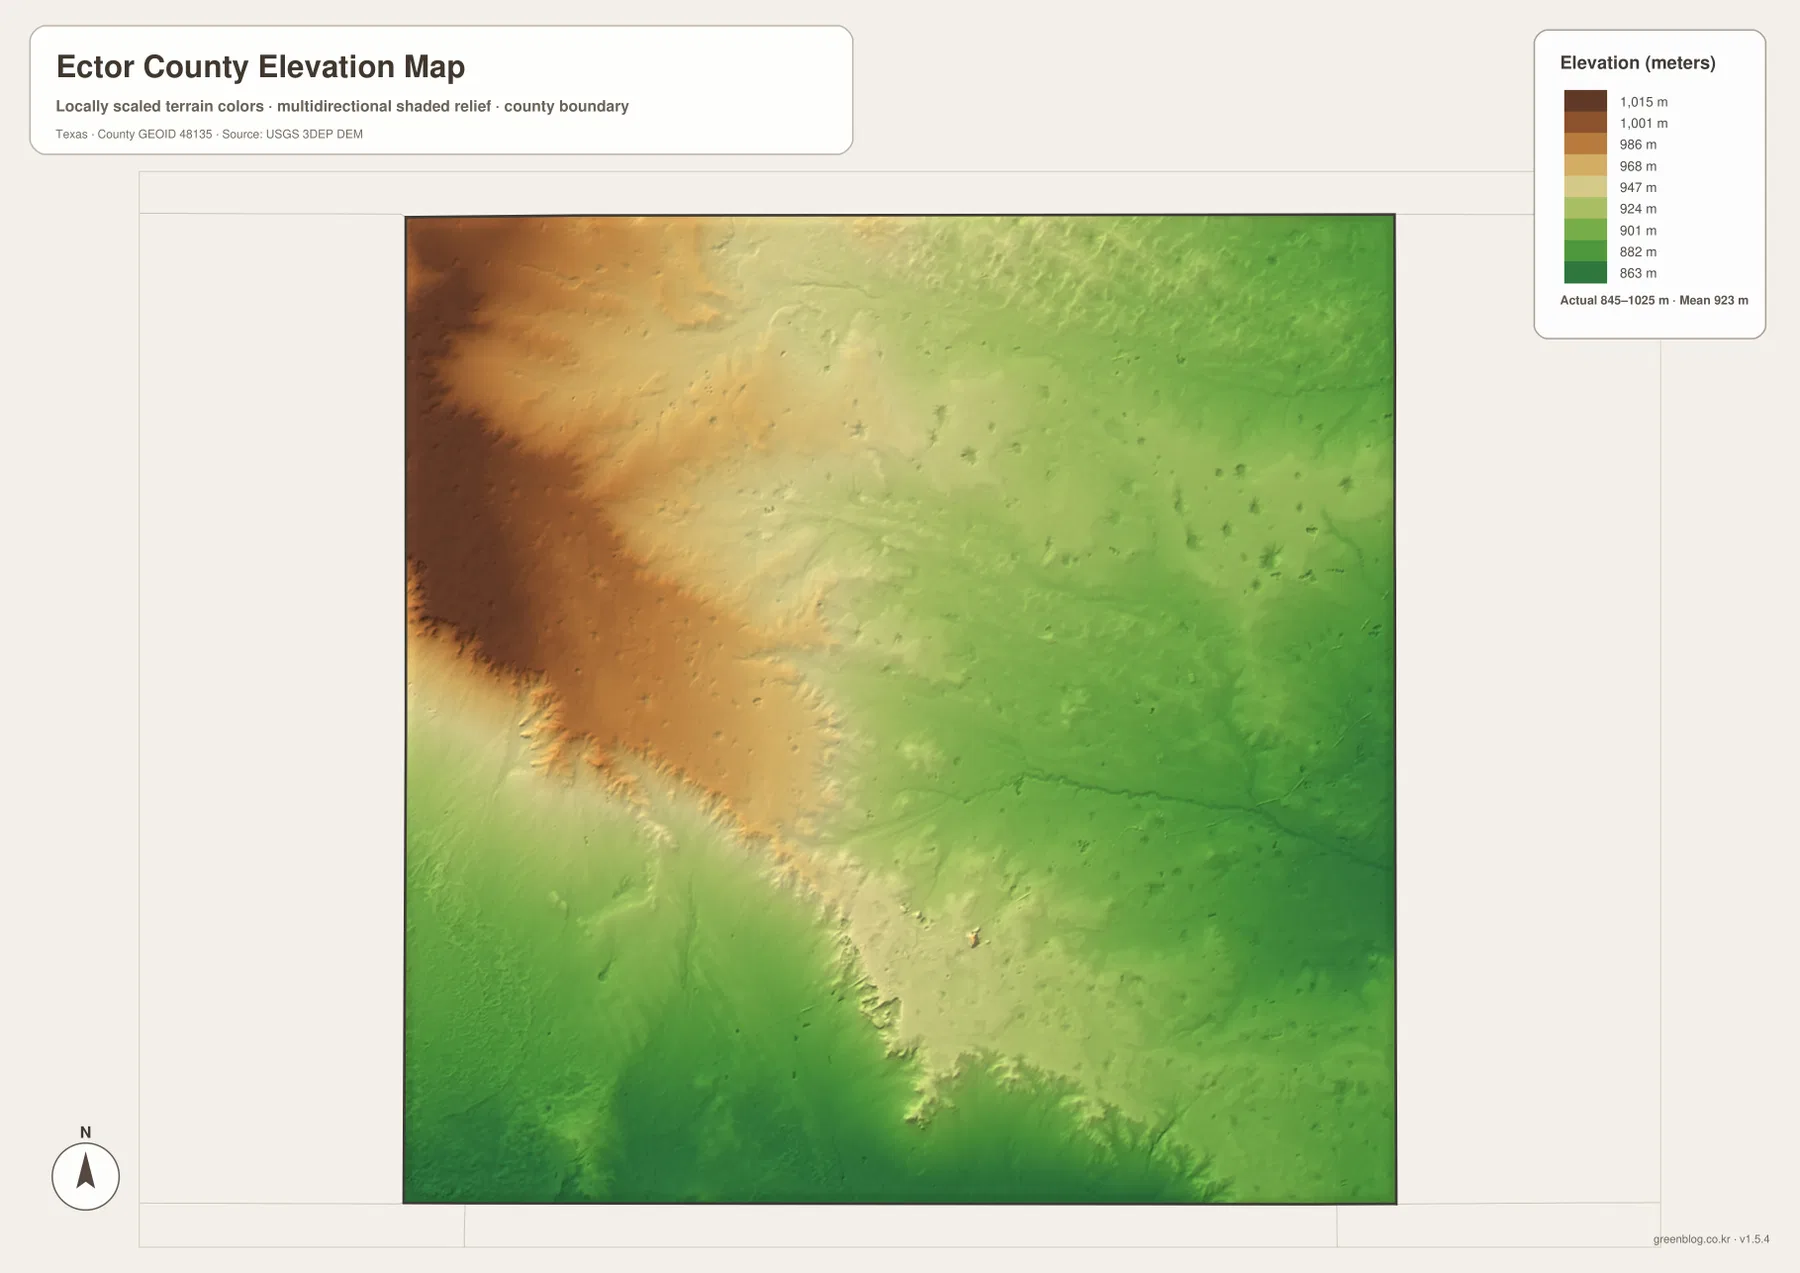
The elevation map gives Ector County a much stronger internal contrast than the road map alone suggests. The legend reports an actual range of about 845 to 1,025 meters, with a mean of about 923 meters. Brown and orange colors cover much of the northwest and western interior, identifying the highest ground on the map. Green shades dominate most of the eastern half and much of the south, including the general Odessa side of the county. That west-to-east change makes Goldsmith’s part of the county visibly higher than the broad area around Odessa.
The terrain is not a smooth ramp. A long band of rapidly changing color crosses the southern-central part of the map, and smaller ridges and shallow valleys break up the surface on both sides. The water map helps give that relief context because Monahans Draw follows the lower southern portion of the county. The elevation surface is useful for county-scale comparison, but it is generalized and should not be treated as a survey-grade source for construction, parcel boundaries, drainage engineering, or exact spot elevations.
Reading the Same Place Across Roads, Water, and Relief
For Odessa, start with the county map because the main routes and developed footprint are easiest to recognize there. The city map then confirms how dominant Odessa is compared with Goldsmith. Moving to the water map adds Monahans Draw and the smaller drainage features south and west of the urban area, while the elevation map shows that the Odessa side lies on lower ground than the county’s northwest. Those four views answer different questions about the same place without requiring the reader to interpret a dense all-in-one GIS display.
Goldsmith can be read in the opposite direction. First locate SH 158 and the broad gap separating Goldsmith from Odessa. The city map shows its isolated northwestern position, the water map places several small named lakes in the northern half of the county, and the elevation map identifies the northwest as the highest broad area. The comparison makes the Goldsmith side of Ector County feel geographically distinct from Odessa even though both lie inside the same administrative boundary.
The maps can also be useful when choosing which file to print. The county map is the best starting point for roads, named communities, and the county outline. The city map is cleaner when the goal is simply to compare Odessa and Goldsmith. The water map is better for locating Monahans Draw and the small lakes, while the elevation map is the clearest choice for the county’s 845–1,025 meter relief. The downloadable JPG files preserve these separate purposes at a larger A3 size.
Frequently Asked Questions
How different are Odessa and Goldsmith on the city map?
The provided city index ranks Odessa first at 115,322 and Goldsmith second at 177. Odessa fills the southeastern urban area, while Goldsmith is a small, isolated point in the northwest, so both size and location differ sharply.
What is the most prominent water feature on the Ector County map?
Monahans Draw is the clearest named channel, crossing the southern-central part of the water map from west toward east. Burn Lake, Cheyenne Lake, Antelope Lake, Prairiedog Lake, Coyote Lake, and several smaller drainage features are also labeled.
Which part of Ector County is highest?
The elevation map places the highest broad terrain in the northwest. Its legend shows an overall range of about 845 to 1,025 meters and a mean near 923 meters, while much of the east and south appears at lower elevations.
Sources and Reference Data
The following official sources provide the boundary, hydrography, and elevation data families used to check the map content.
- USGS The National Map Viewer — A national map viewer for terrain, hydrography, and other geographic layers.
- U.S. Census Bureau TIGER/Line Shapefiles — Official boundary and transportation-related geographic files.
- USGS National Hydrography — National source information for streams, lakes, and other mapped water features.
- USGS 3D Elevation Program — Official U.S. elevation data and 3DEP program information.
Map File Information
Download the same Ector County map set used in this article as high-resolution A3 JPG files in one ZIP archive.
- Included Files: county map, city map, water map, elevation map
- File Type: JPG
Related Maps
- Andrews County Texas map
- Ward County Texas map
- Winkler County Texas map
- Pecos County Texas map
- Upton County Texas map
Green Map creates custom-edited map images using open geographic data sources such as geoBoundaries, Natural Earth, OpenStreetMap, and government open data.
These maps are edited visual materials, not raw data files, and are provided for education, documents, presentations, and graphic reference.