A clear north-south contrast stands out on the Eastland County maps. Cisco, Eastland, and Ranger sit in a compact west-to-east line along I-20, while Carbon, Gorman, and Rising Star are spaced much farther apart in the southern half. The water layer adds the North and South Forks of the Leon River, Lake Leon, and the Sabana River, and the elevation layer shows higher western uplands dropping toward the lower east. The same four map themes are available below as high-resolution A3 JPG files in one ZIP download.
Each map answers a different practical question without requiring the reader to treat the county as a single uniform area. The boundary-and-road map is best for finding I-20 and the numbered highways that connect the towns. The city map shows how closely Cisco, Eastland, and Ranger cluster compared with Gorman, Rising Star, and Carbon. The water map brings the Leon River system, Lake Leon, Lake Cisco, and the Sabana River into focus, while the elevation map shows why the eastern drainage country looks different from the higher west. Moving between the maps at the same location makes the county’s internal contrasts much clearer.
Table of Contents
Cisco, Eastland, and Ranger along the I-20 corridor
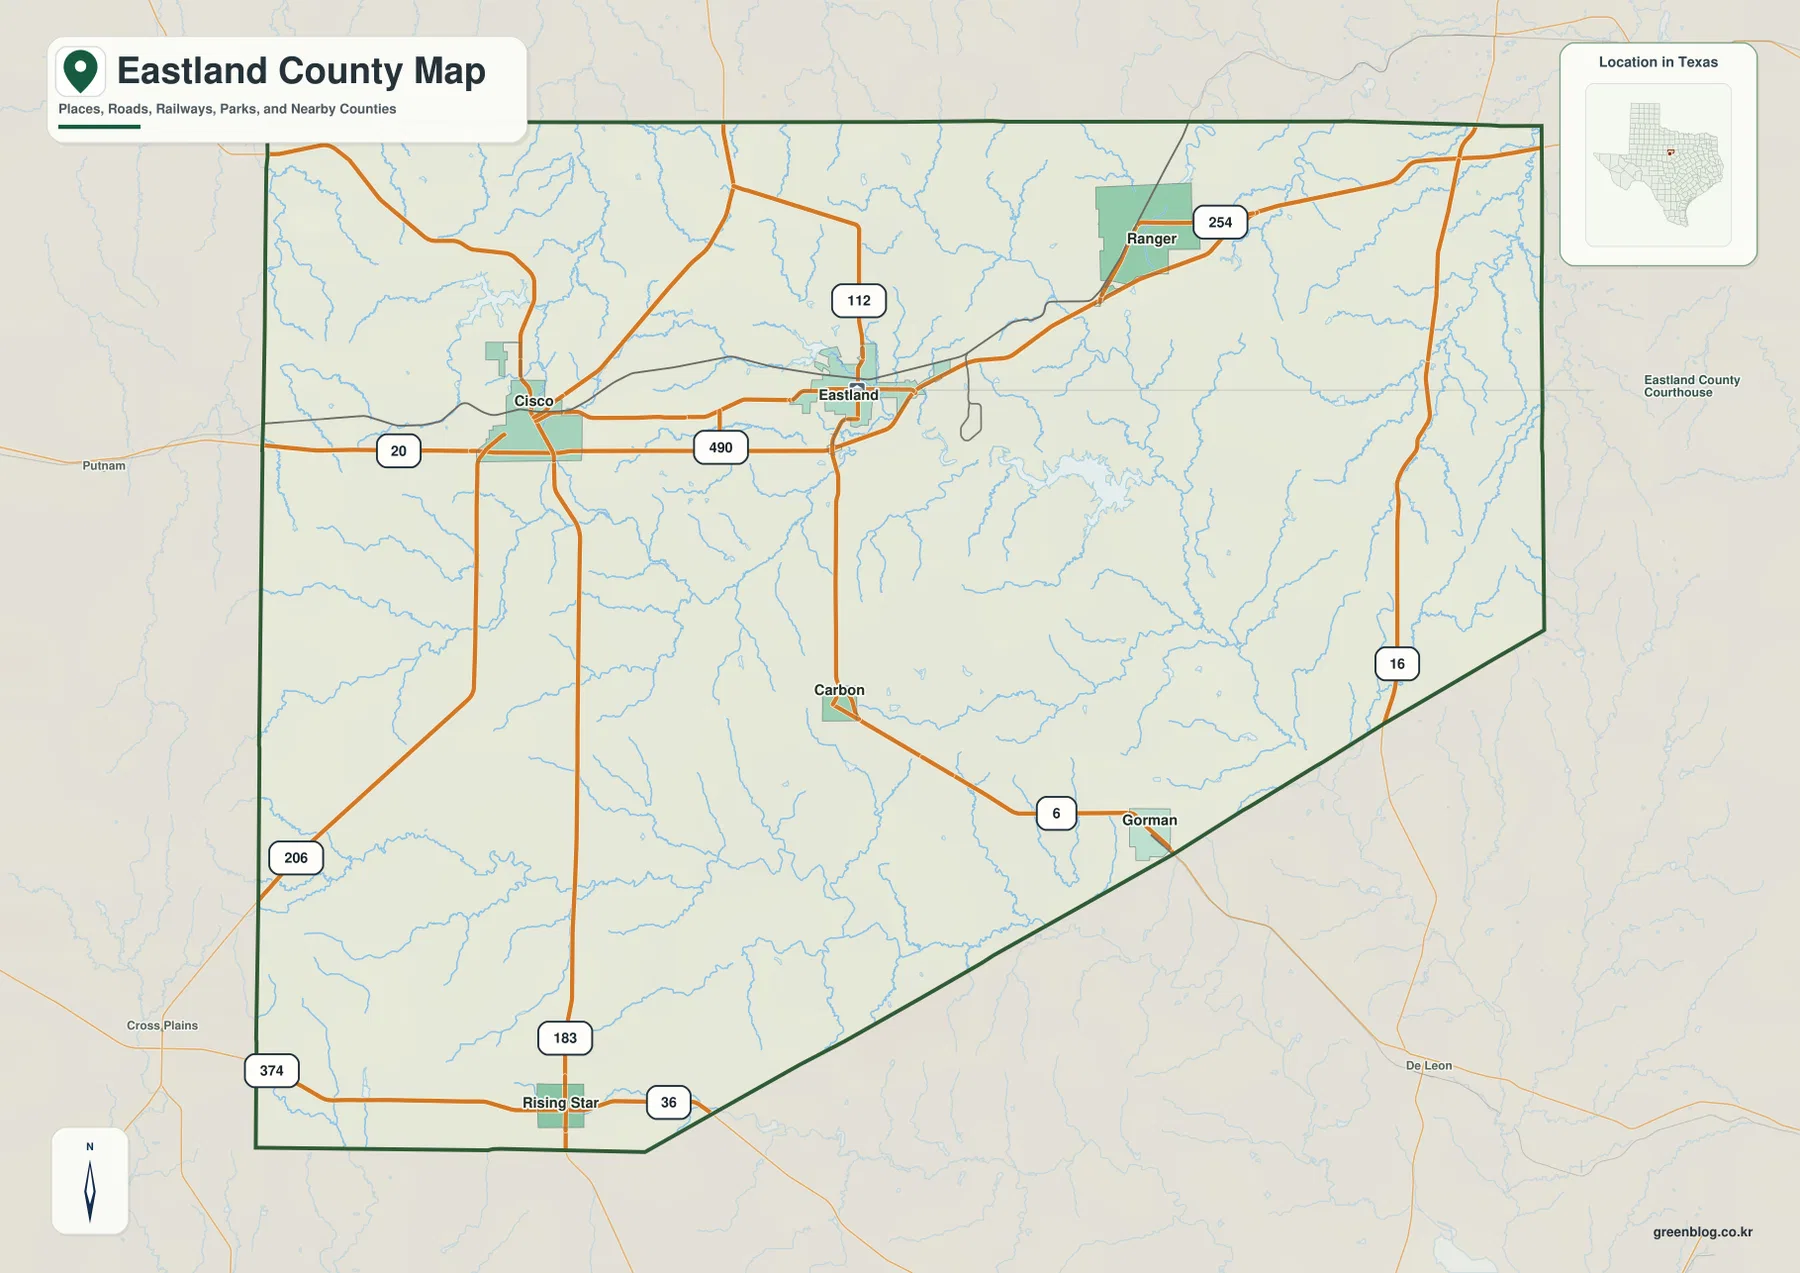
The main county map gives I-20 the clearest organizing role. Cisco sits in the western part of the northern band, Eastland lies farther east near the middle of the county, and Ranger occupies the northeastern side. These three places are much closer to one another than the towns in the south, so the interstate creates a recognizable northern corridor. South of Eastland, a route continues toward Carbon and Gorman, while U.S. 183 runs south from the Cisco area toward Rising Star. Highway 36 crosses the southern edge near Rising Star, and Highway 16 appears along the eastern side.
The county boundary also changes the way those routes appear on the page. The northern and western sides are comparatively straight, but the southeastern boundary cuts diagonally across the map, placing Gorman close to that angled edge. Rising Star is near the southwestern corner, and Carbon occupies a more central southern position between the northern corridor and Gorman. Instead of imagining all roads radiating evenly from Eastland, it is more accurate to first recognize the compact I-20 band and then trace the separate routes that reach the southern communities.
A northern city cluster and widely spaced southern communities
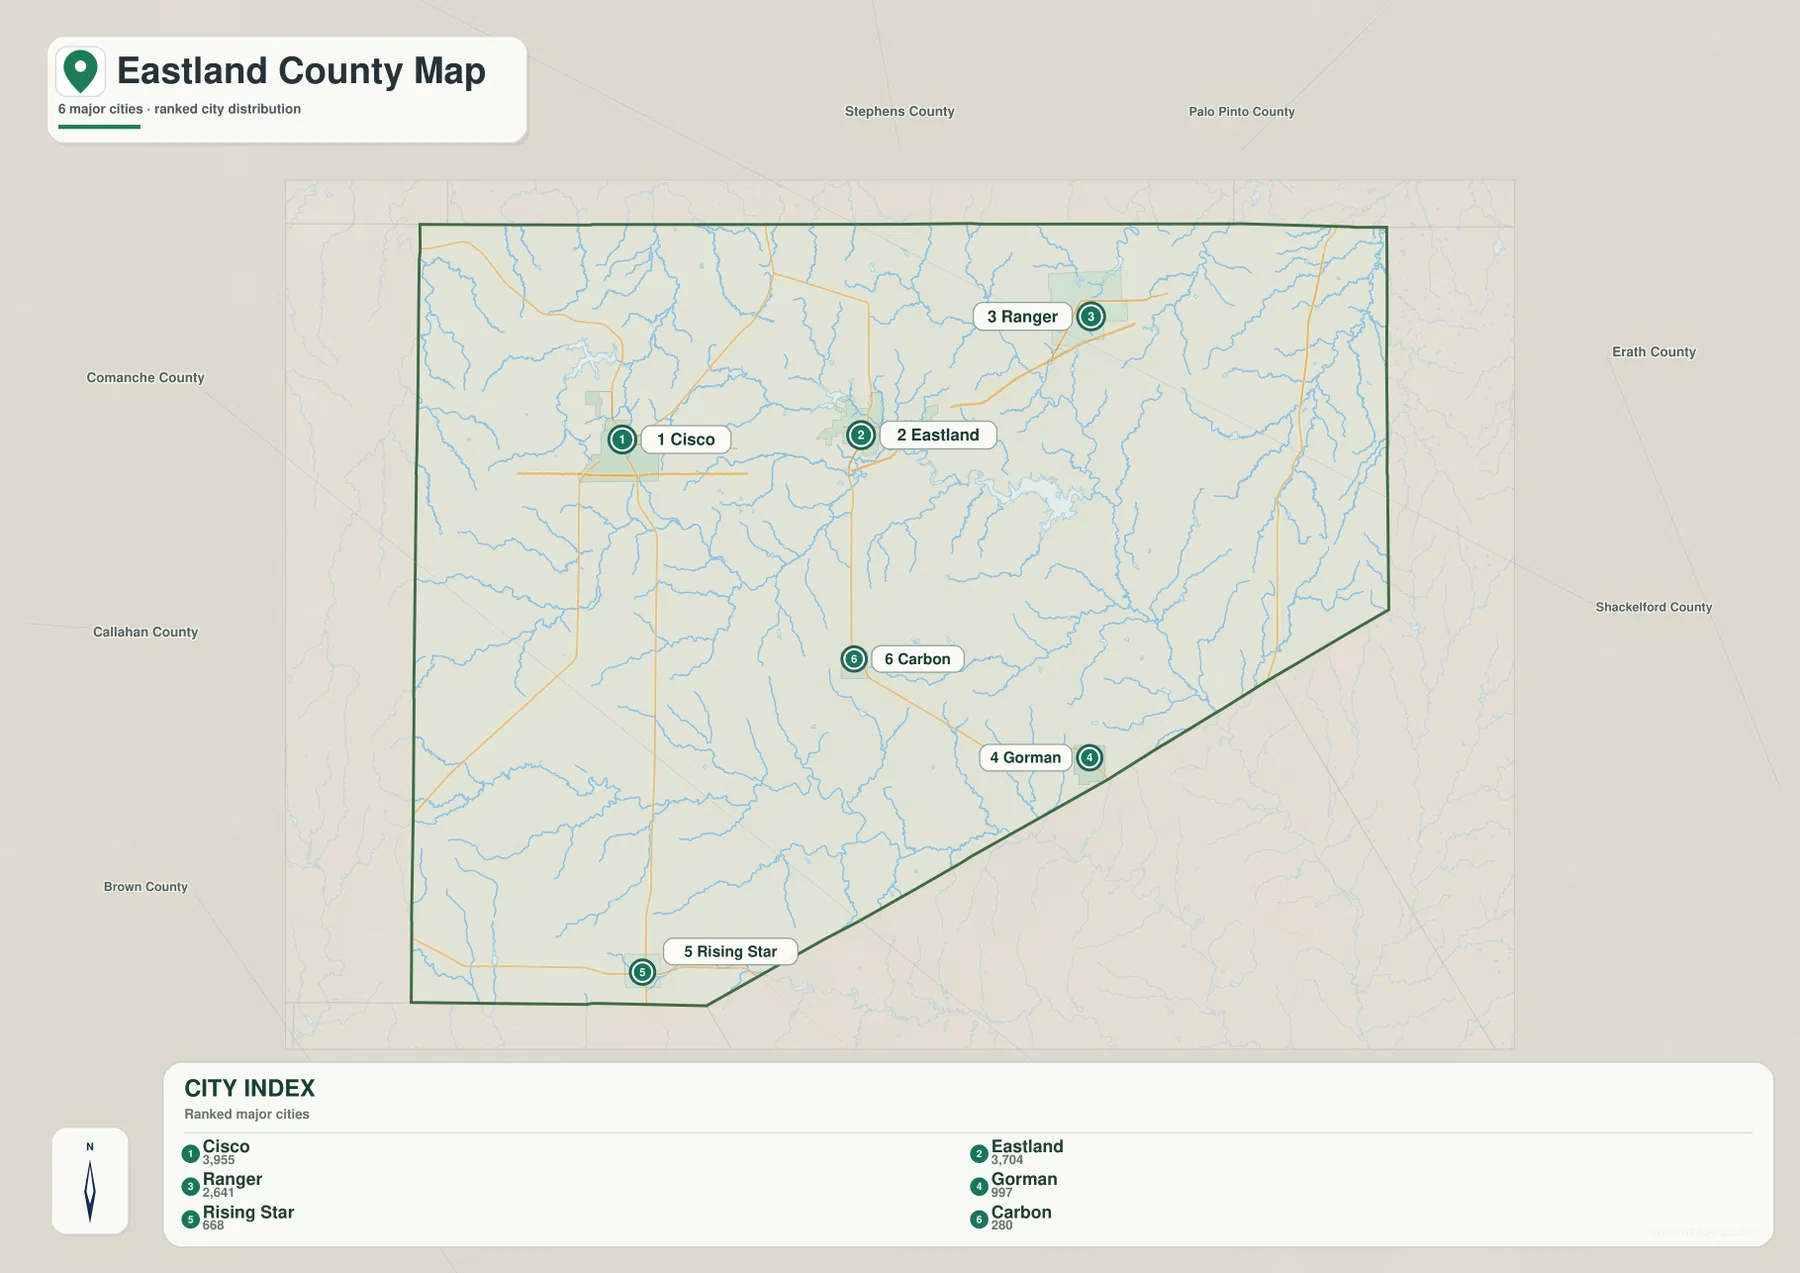
The city-distribution map highlights six named places: Cisco, Eastland, Ranger, Gorman, Rising Star, and Carbon. The first three occupy the northern half in a relatively tight west-to-east arrangement. Carbon lies below Eastland, Gorman is farther southeast near the diagonal county boundary, and Rising Star is isolated toward the southwest. That pattern matters because it shows that Eastland County is not a continuous urban strip. A reader can see a compact northern group and then a much more open southern half with separate community centers.
This map is more useful for position than for travel distance. It does not present a set of connector-mile labels, so the spacing should not be interpreted as a driving-mile calculation. Instead, compare the direction of each town and then return to the road map to see how the numbered highways actually link them. Cisco, Eastland, and Ranger make immediate sense when paired with I-20, while Gorman and Rising Star require different southbound routes. Carbon helps bridge the visual gap between Eastland and the southeastern part of the county.
The Leon River forks, Lake Leon, and the southern Sabana River
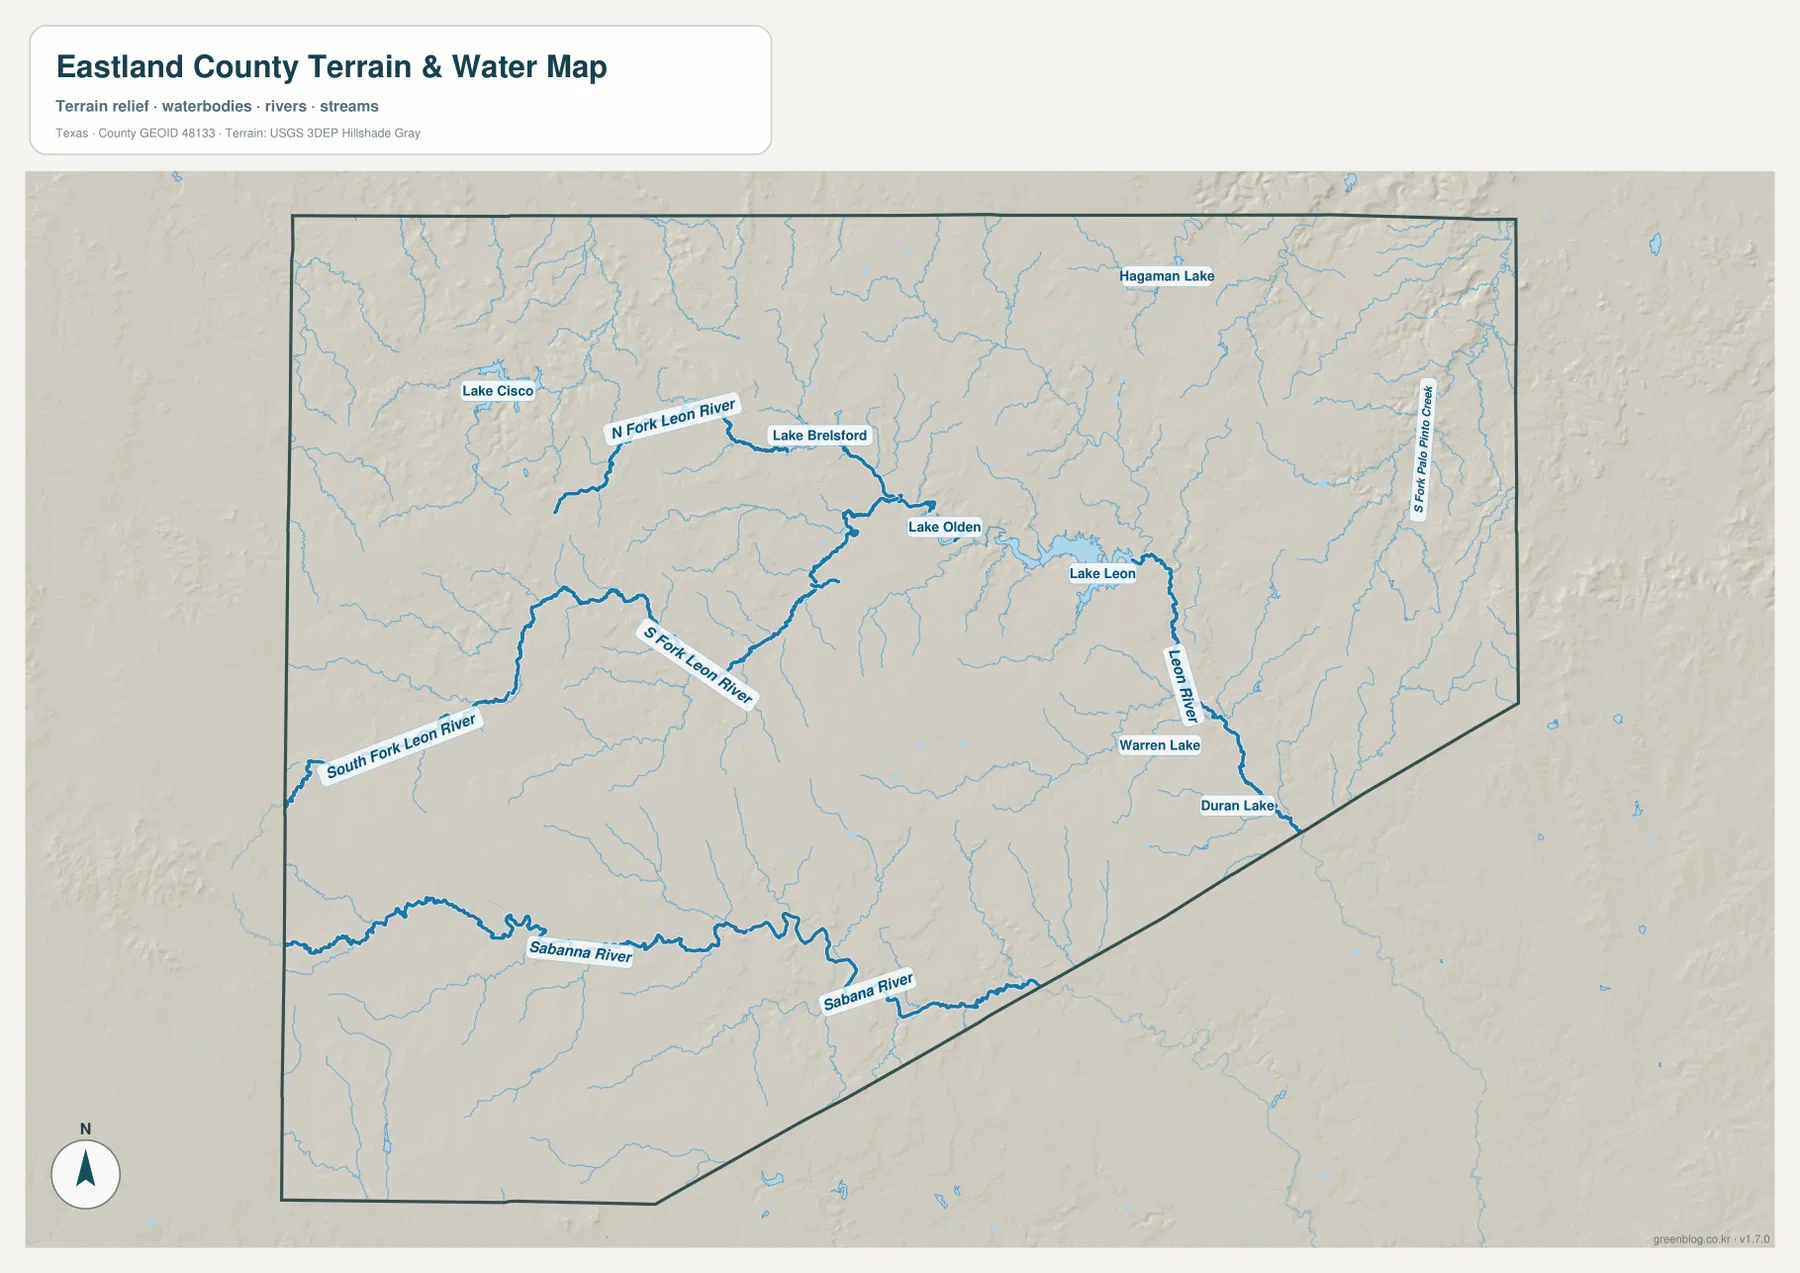
The water map is dominated by the Leon River system rather than by one single channel. North Fork Leon River enters from the west-northwest and runs toward the central part of the county, with Lake Brelsford labeled along that system. South Fork Leon River approaches from farther southwest. Around the middle and eastern half of the county, Lake Olden and Lake Leon appear along or near the connected drainage, and the Leon River continues southeast past Warren Lake and Duran Lake. The sequence of forks, lakes, and the main river makes the eastern half of the county much easier to interpret.
Other water features show that the county is not defined only by the Leon River. Lake Cisco lies in the northwest, Hagaman Lake is labeled near the northern side, and the Sabana River runs across much of the southern part of the county. South Fork Palo Pinto Creek appears near the eastern edge. These names are useful reference points when comparing the water map with the road and city maps, but the map is not a flood-risk, depth, navigation, or legal-water-boundary product. Current specialized sources are needed for those purposes.
Higher western uplands and lower Leon River country in the east
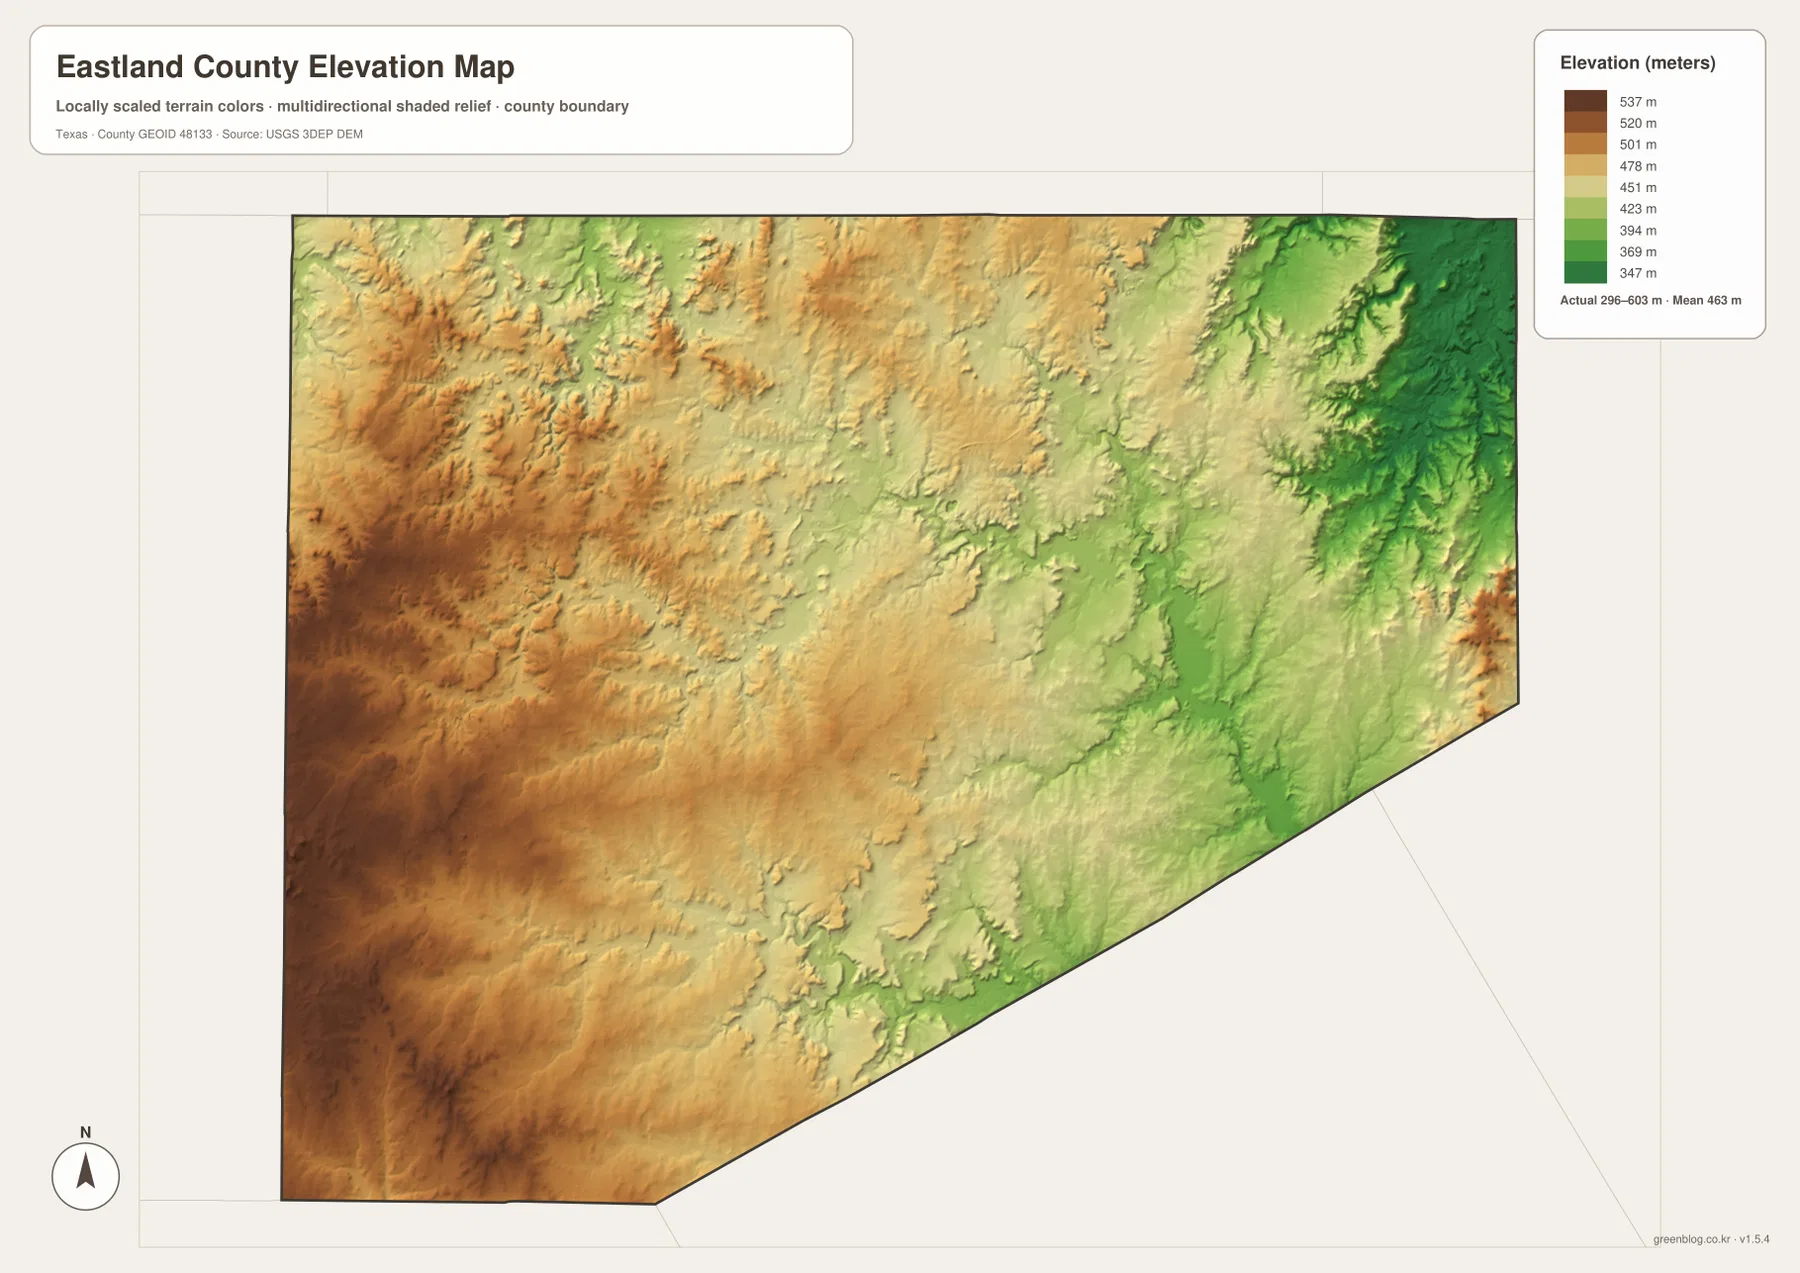
The elevation map makes a strong west-to-east transition visible. Its legend gives an overall mapped range of about 296 to 603 meters, with a mean near 463 meters. Browns and tan colors dominate broad parts of the west and southwest, indicating the higher terrain, while greens become more common toward the east. The lower colors are especially extensive along the eastern side where the Leon River drainage is concentrated. This is not a perfectly smooth slope; ridges, small valleys, and dissected uplands create a textured surface across the county.
Comparing this map with the water layer explains several features that are harder to notice on the road map alone. The Lake Leon and Leon River area sits within the lower eastern terrain, while the Cisco and Rising Star side occupies higher colors across much of the west and southwest. Smaller valleys cut into the uplands, so elevation can change locally even where the broad regional trend is clear. The map is intended to show county-scale relief and should not be treated as a survey-grade elevation source for a parcel, building site, or engineering design.
Reading roads, towns, waterways, and relief together
A useful way to work with the collection is to start with a specific place rather than with a map type. For the Cisco–Eastland–Ranger corridor, locate I-20 on the road map and then use the city map to compare the spacing of the three towns. Next, switch to the water map to see where the Leon River system and Lake Leon lie relative to that corridor, and finish with the elevation map to check whether the same area is on the higher western side or the lower east. This sequence turns four separate graphics into one geographic comparison.
The southern half can be read in the same way. Find Carbon, Gorman, and Rising Star on the county map, note the different highways that reach them, and then compare those positions with the Sabana River and the Leon River tributaries. On the elevation map, Rising Star and much of the southwest stand in higher colors, while Gorman lies closer to the lower eastern side. That contrast helps explain why a single county outline contains noticeably different terrain even though the towns are connected by the same regional road network.
For printing or classroom use, the maps can also be separated by task. The road map works well when the goal is to label towns and major routes. The city map is cleaner for comparing settlement distribution without as many road labels. The water map is best for tracing named rivers, forks, and lakes, and the elevation layer helps relate those channels to valleys and uplands. Because the download archive contains the matching high-resolution JPG files, the images can be used individually without losing the larger page layout shown here.
Frequently Asked Questions
How are Cisco, Eastland, and Ranger arranged on the map?
They form a west-to-east sequence across the northern half of the county and are linked by I-20. Cisco is on the west side, Eastland is farther east near the middle, and Ranger lies toward the northeast, making them the most compact group of major places shown on the city map.
Which waterways and lakes stand out in Eastland County?
North Fork and South Fork Leon River are the main named branches on the water map, with Lake Brelsford, Lake Olden, and Lake Leon associated with the central and eastern drainage. Lake Cisco is separate in the northwest, while the Sabana River crosses the southern part of the county.
Which side of Eastland County is higher?
The supplied elevation map shows the west and southwest as generally higher and the east as lower. Its full mapped range is about 296 to 603 meters, and the lower eastern terrain aligns broadly with the Leon River drainage shown on the water map.
Sources and Reference Data
The following official resources are useful for checking county boundaries, hydrography, and elevation data beyond the map previews provided here.
- USGS The National Map Viewer — official U.S. topographic, hydrographic, and base-map layers.
- U.S. Census Bureau TIGER/Line Shapefiles — county and other geographic boundary data.
- USGS National Hydrography — national river, stream, lake, and hydrography information.
- USGS 3D Elevation Program — authoritative elevation data and 3DEP information.
Map File Information
The same Eastland County map themes shown in the article are available as high-resolution A3 JPG files in one ZIP archive.
- Included Files: county map, city map, water map, elevation map
- File Type: JPG
Related Maps
- Palo Pinto County Texas map
- Shackelford County Texas map
- Stephens County
- San Saba County Texas map
- Taylor County Texas map
Green Map creates custom-edited map images using open geographic data sources such as geoBoundaries, Natural Earth, OpenStreetMap, and government open data.
These maps are edited visual materials, not raw data files, and are provided for education, documents, presentations, and graphic reference.