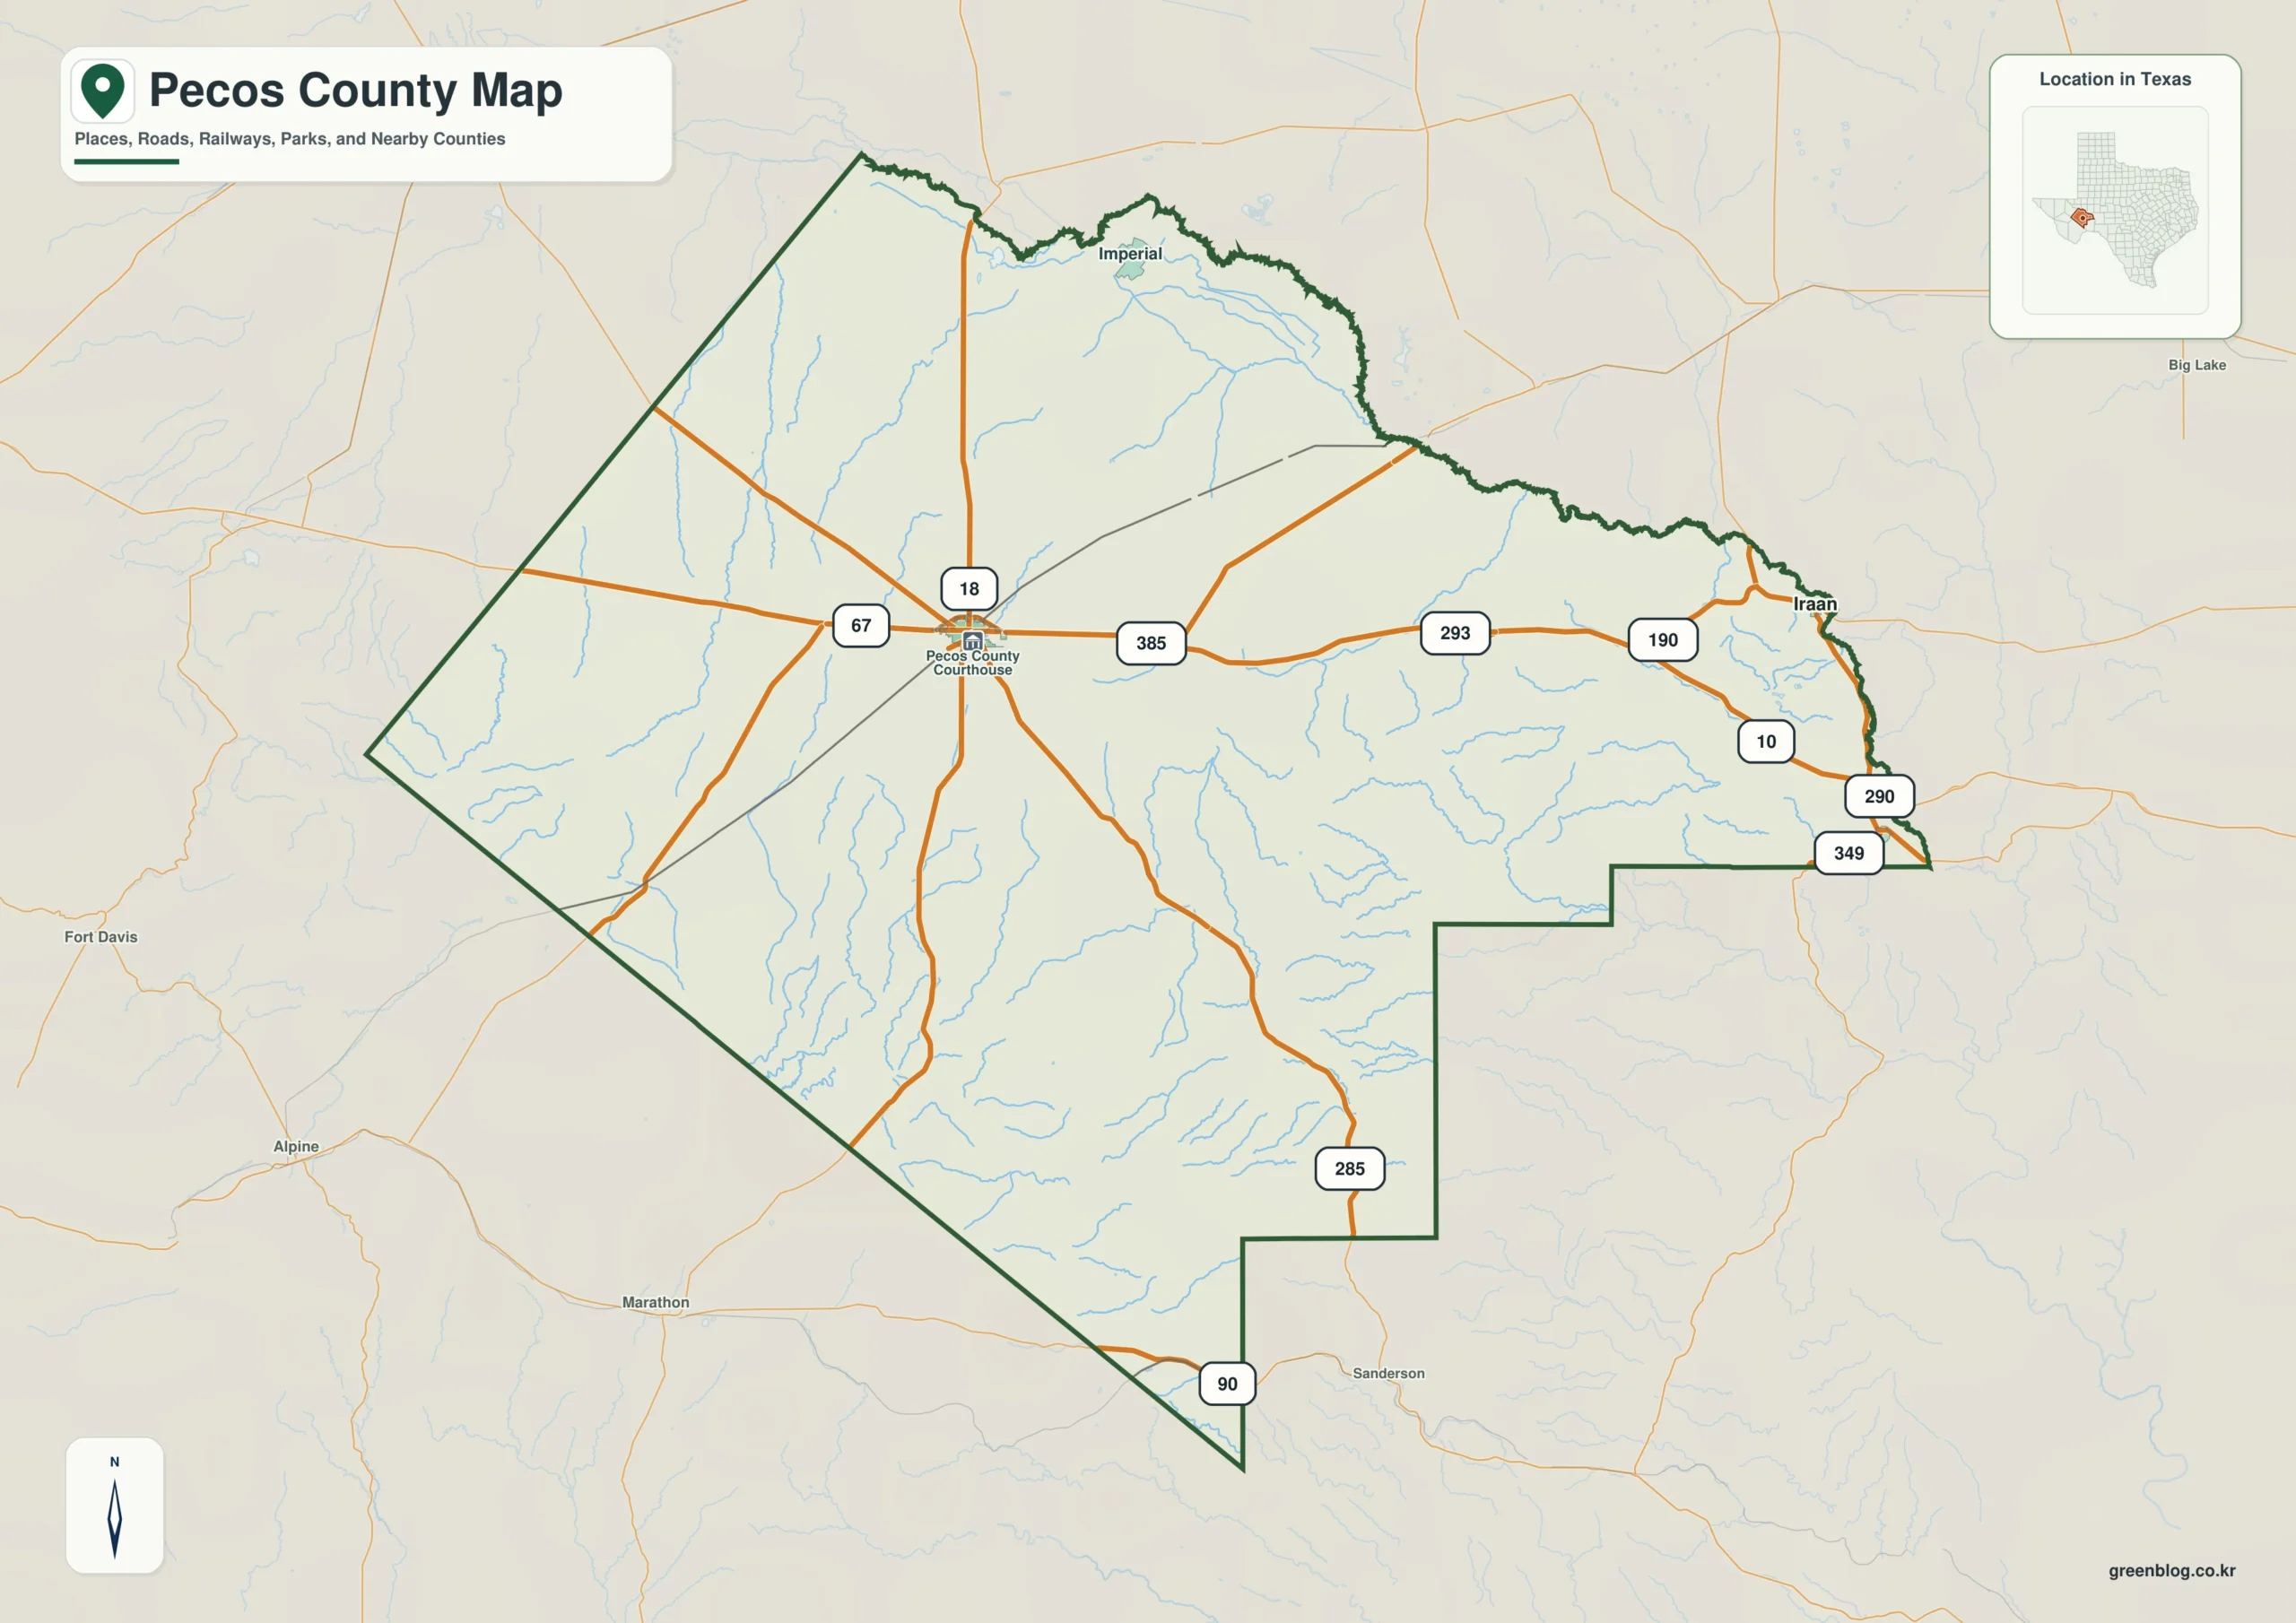
Pecos County Map pages are especially useful when the size of the county matters as much as the individual place names. Fort Stockton sits west of the county’s center, while Iraan is far to the east near the winding county edge. Imperial appears along the northern side, and large stretches of the south and southwest have no major city label at all. That spacing is one of the clearest things the supplied maps reveal: Pecos County is a large West Texas county where roads, communities, creeks, and higher terrain are spread across a broad area rather than packed into one urban corridor.
This page brings those features together through four different map views. The county reference map is best for boundaries, roads, and place names; the city map simplifies the picture to Fort Stockton and Iraan; the terrain and water map brings named creeks and smaller drainage lines forward; and the elevation map shows a strong contrast between the higher southwest and the lower northern and eastern parts of the county. After reviewing the maps, you can download the matching set of four high-resolution A3 JPG files in a single ZIP for printing or offline reference.
Table of Contents
Fort Stockton and the road network across a very large county
The main county map gives Fort Stockton the strongest visual role because the Pecos County Courthouse is marked there and several numbered roads meet around it. Route labels visible on the map include 67, 18, 385, and 285 near the central and western portions of the county. Farther east, 190 and 10 appear on the approach toward Iraan and the southeastern side, while 90 is shown near the southern end. The exact road hierarchy is less important here than the overall pattern: Fort Stockton is a practical reference point for orienting yourself, but the county continues a long distance in every direction beyond the city.
The boundary itself is distinctive. A long diagonal line forms much of the western and southwestern side. The eastern side is more irregular and curves around the Iraan area, and the southeastern boundary includes several sharp step-like turns. Because of that shape, a simple “east-west” description does not explain the county very well. Looking at the roads together with the boundary makes it easier to understand why two places in Pecos County can share the same county government while still occupying very different parts of the landscape.

Place names outside the boundary add useful orientation without crowding the county itself. Fort Davis, Alpine, Marathon, Sanderson, and Big Lake appear around the map, helping place Pecos County within the wider West Texas region. Those labels are useful when comparing counties or preparing a regional presentation, but this is not a turn-by-turn road map. For travel planning, treat the road labels as geographic references and check current routing and road conditions separately.
Why Fort Stockton and Iraan look so far apart on the city map
The city map deliberately removes much of the road detail and ranks only two major cities. Fort Stockton is marked as number 1 in the west-central part of the county, and Iraan is number 2 near the eastern boundary. The city index printed on the supplied map lists 8,278 for Fort Stockton and 1,038 for Iraan. Those figures are presented here only as the values printed on this specific map, but they make the visual difference in city scale easy to understand. More importantly, the map makes the physical separation between the two communities obvious.
The space between the city markers is as informative as the markers themselves. Large areas of southern and southwestern Pecos County do not have a major-city symbol, and even the northern label of Imperial shown on the reference map is absent from this ranked city view. That gives the reader a cleaner picture of where the two principal population centers in this map set sit inside the county. It also helps explain why a county-wide map is necessary: a street or city map of Fort Stockton alone would leave most of Pecos County outside the frame.

Neighboring county names surround the city map as another useful reference layer. Brewster County and Terrell County are labeled to the west and southwest, Reeves County lies to the west, while Jeff Davis, Crane, Crockett, and Ward counties appear around the northern and eastern sides. When those labels are read together with the long diagonal western boundary and the stepped southeastern edge, the unusual footprint of Pecos County becomes easier to recognize at a glance.
Creeks and terrain become the main story away from the cities
The terrain and water map changes the emphasis completely. Instead of highway shields and city rankings, it labels waterways such as Monument Creek, Leon Creek, Comanche Creek, Tunas Creek, North Fork Independence Creek, and Dry Creek. Lake Leon is also labeled in the northwestern part of the county. Smaller blue lines spread through the interior and become especially dense across portions of the south. The result is a much more detailed picture of the shallow valleys and channels that are easy to miss on the road-focused map.
Several named features help divide the county into recognizable water-reference areas. Comanche Creek and Leon Creek are concentrated toward the north, while Tunas Creek extends across the east-central part of the map. North Fork Independence Creek is farther south and east, and Dry Creek appears near the southern edge. The shaded terrain underneath the waterways is important because it shows that these blue lines do not cross a perfectly flat surface. In the southern half, the relief becomes more intricate and the network of small channels follows that changing terrain.

This map should be read as a geographic water-reference map, not as a flood map or a statement that every blue line carries water throughout the year. In a dry region, smaller channels can be intermittent and conditions change. The value of the map is in locating named creeks and seeing how watercourses relate to the shape of the land. It is especially useful next to the elevation map because the two images make the relationship between higher ground, valleys, and branching channels much easier to see.
A strong elevation contrast from the southwest to the north and east
The elevation map provides the clearest explanation for the terrain differences visible in the water map. Its legend states an actual elevation range of 621 to 1,646 meters, with a mean of 954 meters. Browns and tan shades cover much of the southwest and parts of the southern interior, while greens dominate broad areas of the north and east. The county therefore should not be imagined as one uniform desert plain. Within the same boundary, elevation changes by more than a thousand meters between the lowest and highest values represented in the source surface.
The southwestern high ground is also visually rougher. Ridges and valleys are tightly packed near the diagonal county boundary and continue into the south-central area. By comparison, much of the north is smoother and changes color more gradually. The eastern side has lower overall colors but still contains fine valley detail. When the elevation map is placed beside the terrain and water map, the dense southern drainage lines make more sense: the channels follow a landscape with stronger local relief than the broad, smoother areas farther north.

The elevation surface is designed for county-scale comparison, not survey or engineering work. A color band can tell you that one broad area is higher than another, but it should not be used to assign an exact elevation to a building, property corner, or road grade. For those uses, a more detailed elevation source is necessary. For general geography, however, the map does an excellent job of showing why the southwest feels different from the flatter-looking north and why the southern water network appears more dissected.
Reading the four map views together
Each map answers a different practical question about the same county. Start with the county reference map if you need to know where Fort Stockton, Iraan, and Imperial sit relative to the boundary and the numbered roads. Move to the city map when you want a cleaner comparison of Fort Stockton and Iraan without the full road network. Use the terrain and water map when creek names and valley patterns matter, and use the elevation map when the contrast between the southwestern high ground and the lower north and east is the main subject.
The strongest results come from comparing rather than isolating the maps. Fort Stockton appears as a road-centered administrative reference on the county map and as the leading city marker on the city map. Tunas Creek and Comanche Creek are easy to follow on the water map but barely compete for attention on the road map. The high terrain of the southwest stands out immediately on the elevation map and then helps explain why the shaded relief and small waterways are more complicated in the southern half of the water map.
That comparison is useful for several common map tasks. A teacher can use the reference map to discuss county location and then switch to the elevation map to show that West Texas counties are not all physically uniform. Someone comparing neighboring counties can use the city map and outer county labels to establish orientation. A reader interested in natural features can ignore most of the road detail and focus on Leon Creek, Comanche Creek, Tunas Creek, Lake Leon, and the surrounding relief. The maps remain simple enough for ordinary reference while still preserving meaningful county-specific detail.
Choosing the right Pecos County file for your purpose
For a general county overview, the reference map is the best first choice because it combines place names, roads, county limits, and nearby regional labels. The city map is better when the page or slide needs less clutter and the main question is where Fort Stockton and Iraan are located. The water map is the most informative option for named creeks and terrain relief, while the elevation map is the clearest choice for showing that the highest ground is concentrated toward the southwest rather than evenly distributed across the county.
Keep the scale and purpose of each map in mind. The road map is not a live navigation service, the water map is not a flood-hazard product, and the elevation map is not survey-grade data. The city map also simplifies the county by showing only the ranked major cities included in this map set. Used within those limits, the four files provide a concise way to move from human geography—cities and roads—to physical geography—creeks, valleys, and elevation—without mixing all of that information into one crowded image.
Frequently Asked Questions
Where are Fort Stockton and Iraan located within Pecos County?
Fort Stockton is shown west of the county’s center, while Iraan is near the eastern boundary. The city map makes the wide separation particularly clear because it removes most other labels and highlights those two cities. Actual driving distance and travel time depend on the road route, so use a current navigation source for a trip rather than estimating from the county map.
Which part of Pecos County is highest on the elevation map?
The supplied elevation map shows the highest terrain concentrated mainly in the southwest and parts of the south. Its legend gives an actual range of 621 to 1,646 meters and a mean of 954 meters. The north and much of the east are shown in lower green shades, although local ridges and valleys are still visible within those areas.
Which waterways are labeled on the Pecos County water map?
Named features visible on the map include Comanche Creek, Leon Creek, Monument Creek, Tunas Creek, North Fork Independence Creek, Dry Creek, and Lake Leon, along with many smaller channels. The map is intended for geographic reference and terrain comparison; it is not a flood map and does not indicate that every channel contains water year-round.
Map File Information
The downloadable ZIP contains the same Pecos County subjects shown on this page as four high-resolution A3 JPG files: the county reference map, city map, terrain and water map, and elevation map. Use the individual JPG that best fits your print, classroom, presentation, or offline reference needs.
- Included Files: County map, city map, terrain and water map, elevation map
- File Type: One ZIP containing four high-resolution A3 JPG files
Related Maps
Sources and References
For county government and local background, see the official Pecos County website and the Texas State Historical Association entry for Pecos County. Public mapping references include the U.S. Census Bureau TIGER/Line files, USGS National Hydrography, and the USGS 3D Elevation Program.
Green Map creates custom-edited map images using open geographic data sources such as geoBoundaries, Natural Earth, OpenStreetMap, and government open data.
These maps are edited visual materials, not raw data files, and are provided for education, documents, presentations, and graphic reference.