Turner County sits in south-central Georgia, with Ashburn serving as the county seat and the clearest reference point for roads, settlements, and local orientation. On this Turner County Georgia Map page, you can preview the county boundary, Ashburn, Sycamore, Rebecca, named waterways, and the east-west elevation contrast, then download all four maps as high-resolution A3 JPG files in one ZIP. The lighter WEBP versions make each map quick to view in the article before you download the full-size set.
The county becomes easier to understand when the four themes are read together rather than as separate graphics. Ashburn lies slightly west of the county’s center and is where several important roads converge. Sycamore is close to Ashburn on the south side, while Rebecca is much farther to the northeast. The Little River system is prominent in the western half, the Alapaha River follows the eastern side, and the elevation map shows a noticeable contrast between higher ground in the west and lower corridors around streams and the eastern boundary.
Table of Contents
Ashburn as the road and boundary reference point
On the general county map, Ashburn stands out immediately because the county-seat symbol and several numbered highways are concentrated around it. U.S. 41 and the I-75 corridor run generally north to south through the central part of Turner County, while routes labeled 32, 107, 112, 159, and 90 extend toward different sides of the county. The map is not intended to include every local road, but it gives enough detail to see how travel routes meet near Ashburn and then spread toward the county boundary.
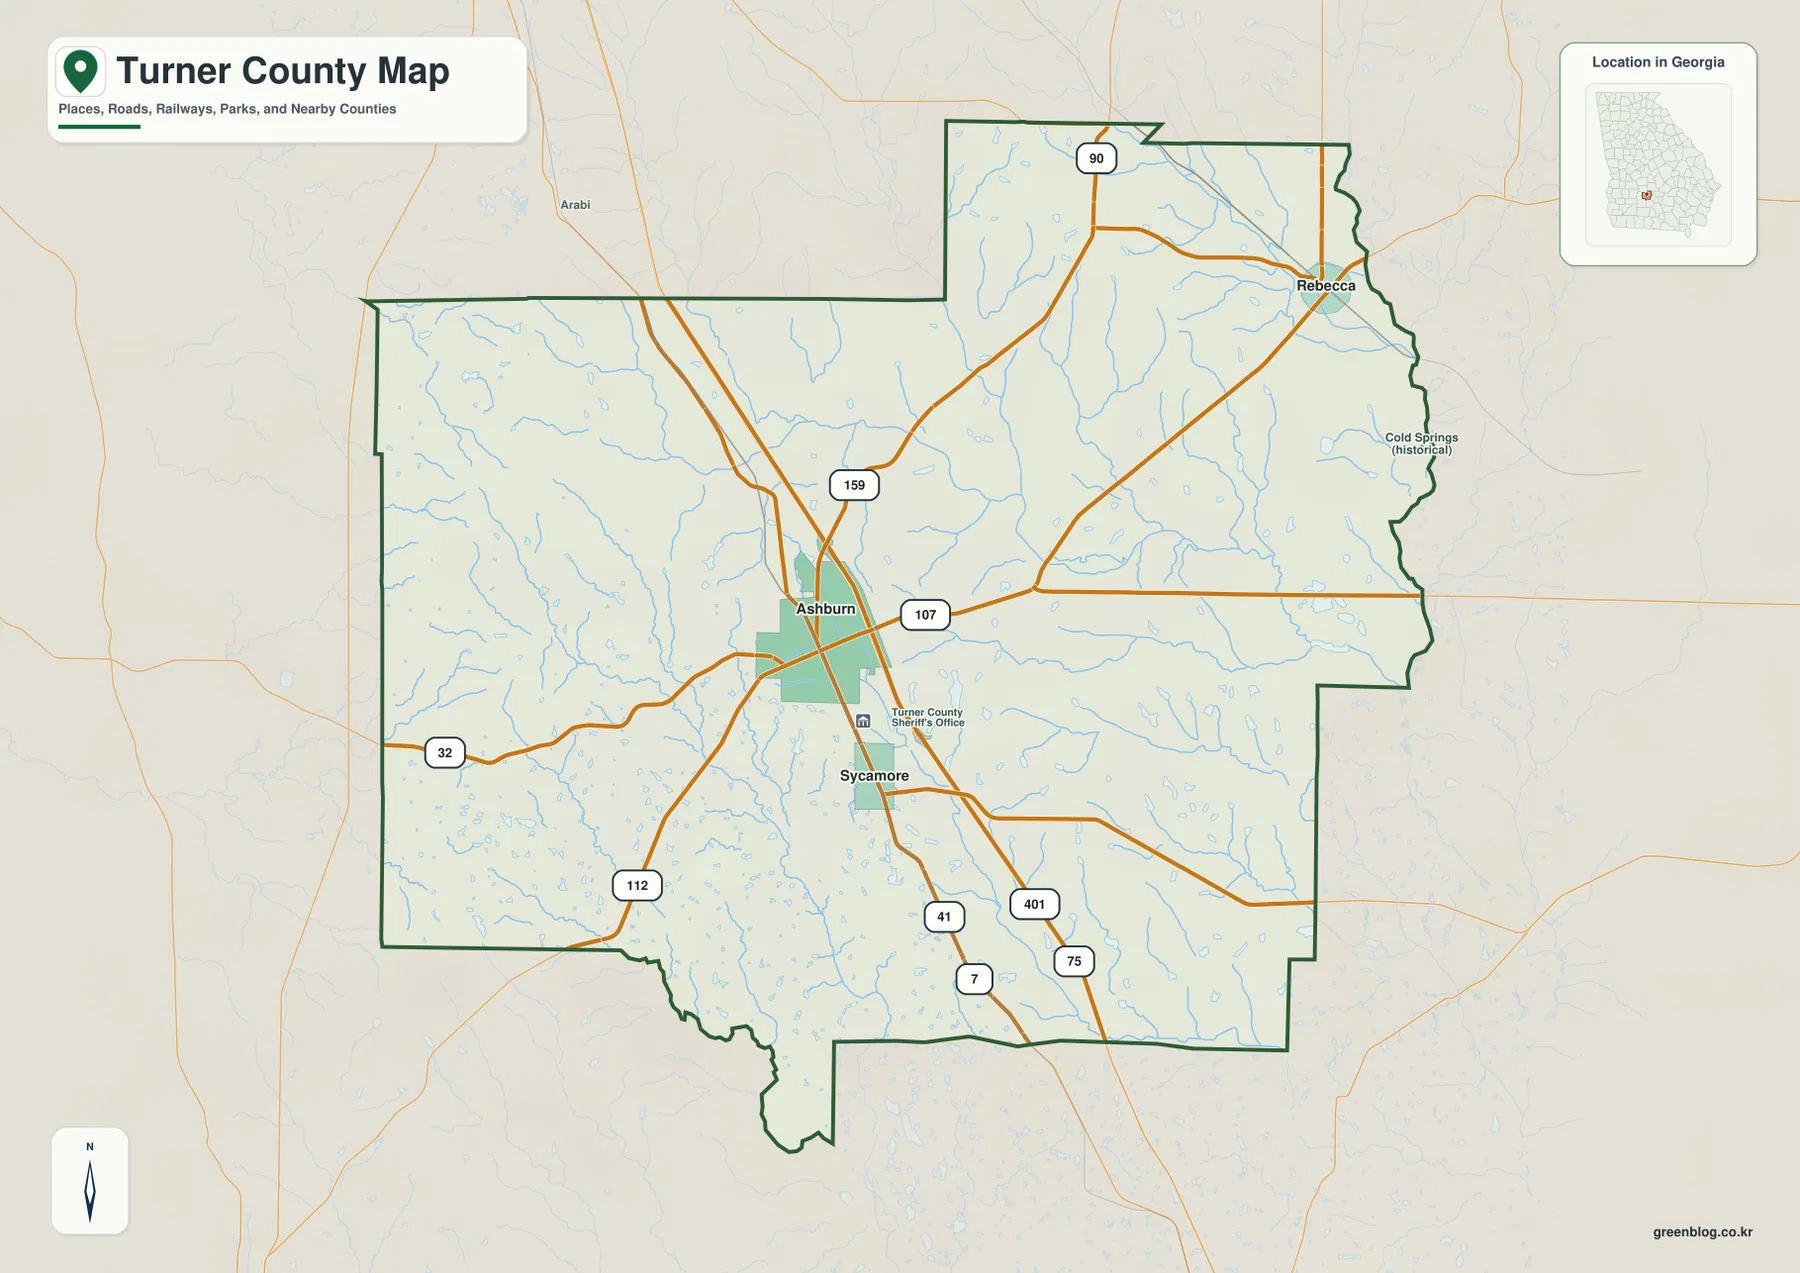
The outline itself is useful because Turner County is not a simple rectangular shape. A northern extension, an irregular eastern side, and stepped sections along the south make the boundary easy to distinguish from nearby county lines. The city map labels Crisp County to the north, Wilcox County toward the northeast, Irwin County and Ben Hill County to the east, Tift County to the west, and Worth County toward the northwest. Those surrounding labels provide useful context when Turner County is being located within the larger south-central Georgia region.
Ashburn also helps separate two different kinds of map questions. If the question is where Turner County is and which roads pass through it, the boundary map is the best starting point. If the question is how far Sycamore or Rebecca lies from the county seat, the city-connections map is clearer. This distinction matters because the main map contains many road and stream lines, while the city map deliberately reduces the amount of detail around the three incorporated places.
Ashburn, Sycamore, and Rebecca are not evenly spaced
The city-connections map makes the settlement pattern simple to see. Ashburn is marked as the hub, Sycamore is immediately to the south, and Rebecca is positioned much farther away near the northeastern side of the county. The distance labels show about 3 miles from Ashburn to Sycamore and about 11 miles from Ashburn to Rebecca. These are straight-line distances between the mapped places, not driving distances, so a road trip may be longer depending on the route used.
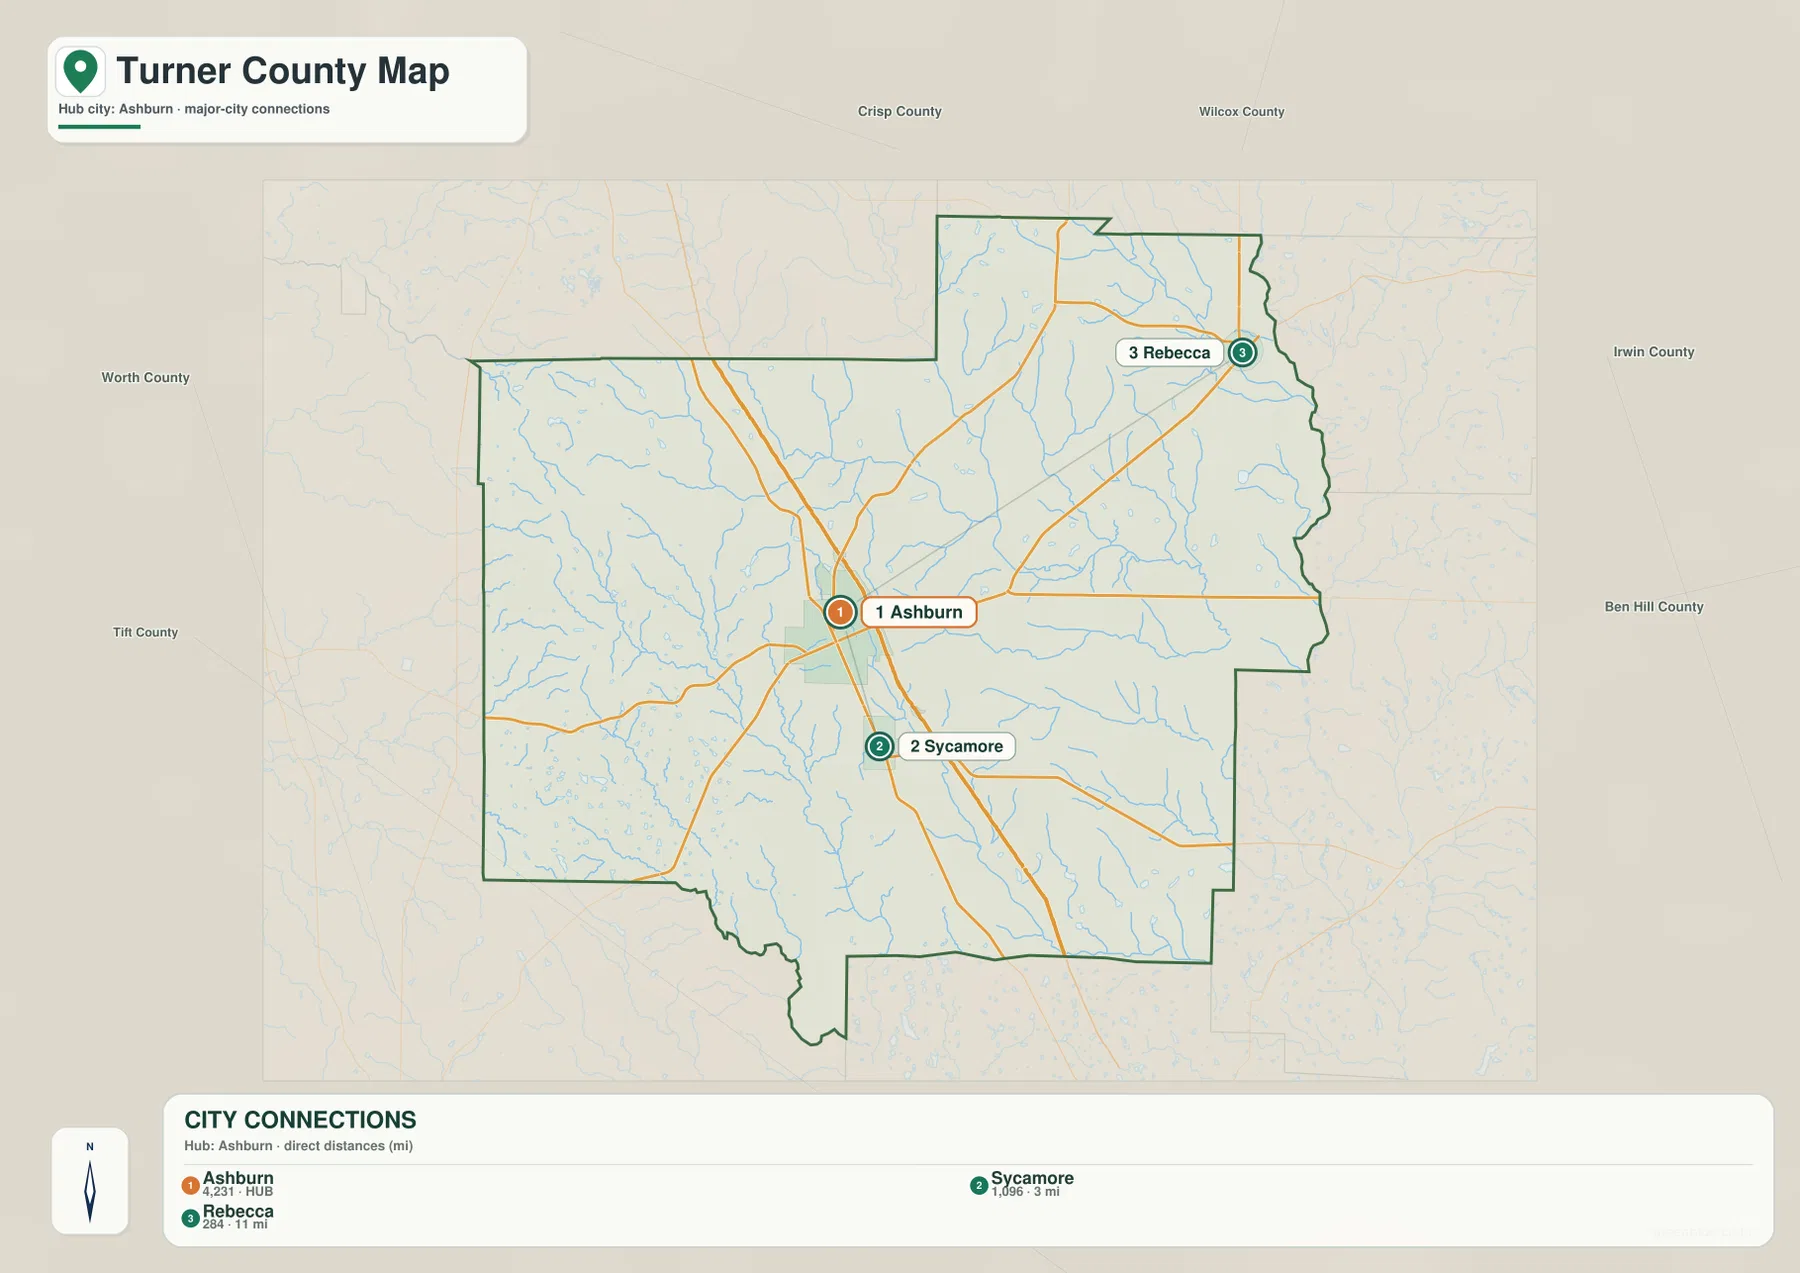
This arrangement gives Turner County a clear internal orientation. Sycamore is close enough to Ashburn that the two places appear along the same central-southern travel area, while Rebecca occupies a more separate northeastern position. The map therefore works well when a reader needs to explain that the county’s incorporated places are not clustered in one corner. It also prevents a common misunderstanding that Rebecca is another community immediately beside Ashburn simply because all three names are often listed together in a county summary.
The existing county background in the supplied material notes that Turner County was established in 1905, and Ashburn has the role of county seat. That historical fact fits the modern map layout: administrative and transportation symbols remain concentrated around Ashburn, while the other two incorporated places are smaller reference points in different parts of the county. For a classroom timeline, local-history note, or county profile, the city map can therefore be paired with the background source without turning the page into a detailed street or parcel map.
From the Little River to the Alapaha River
The water map reveals a different structure from the road network. In the western half of Turner County, the Little River is a major named feature, receiving numerous smaller branches as it continues southward. Along the eastern side, the Alapaha River forms another strong water reference. In the northeast, Double Run Creek reaches toward the Alapaha system, while Deep Creek and West Fork Deep Creek are labeled across the central-eastern portion of the county.
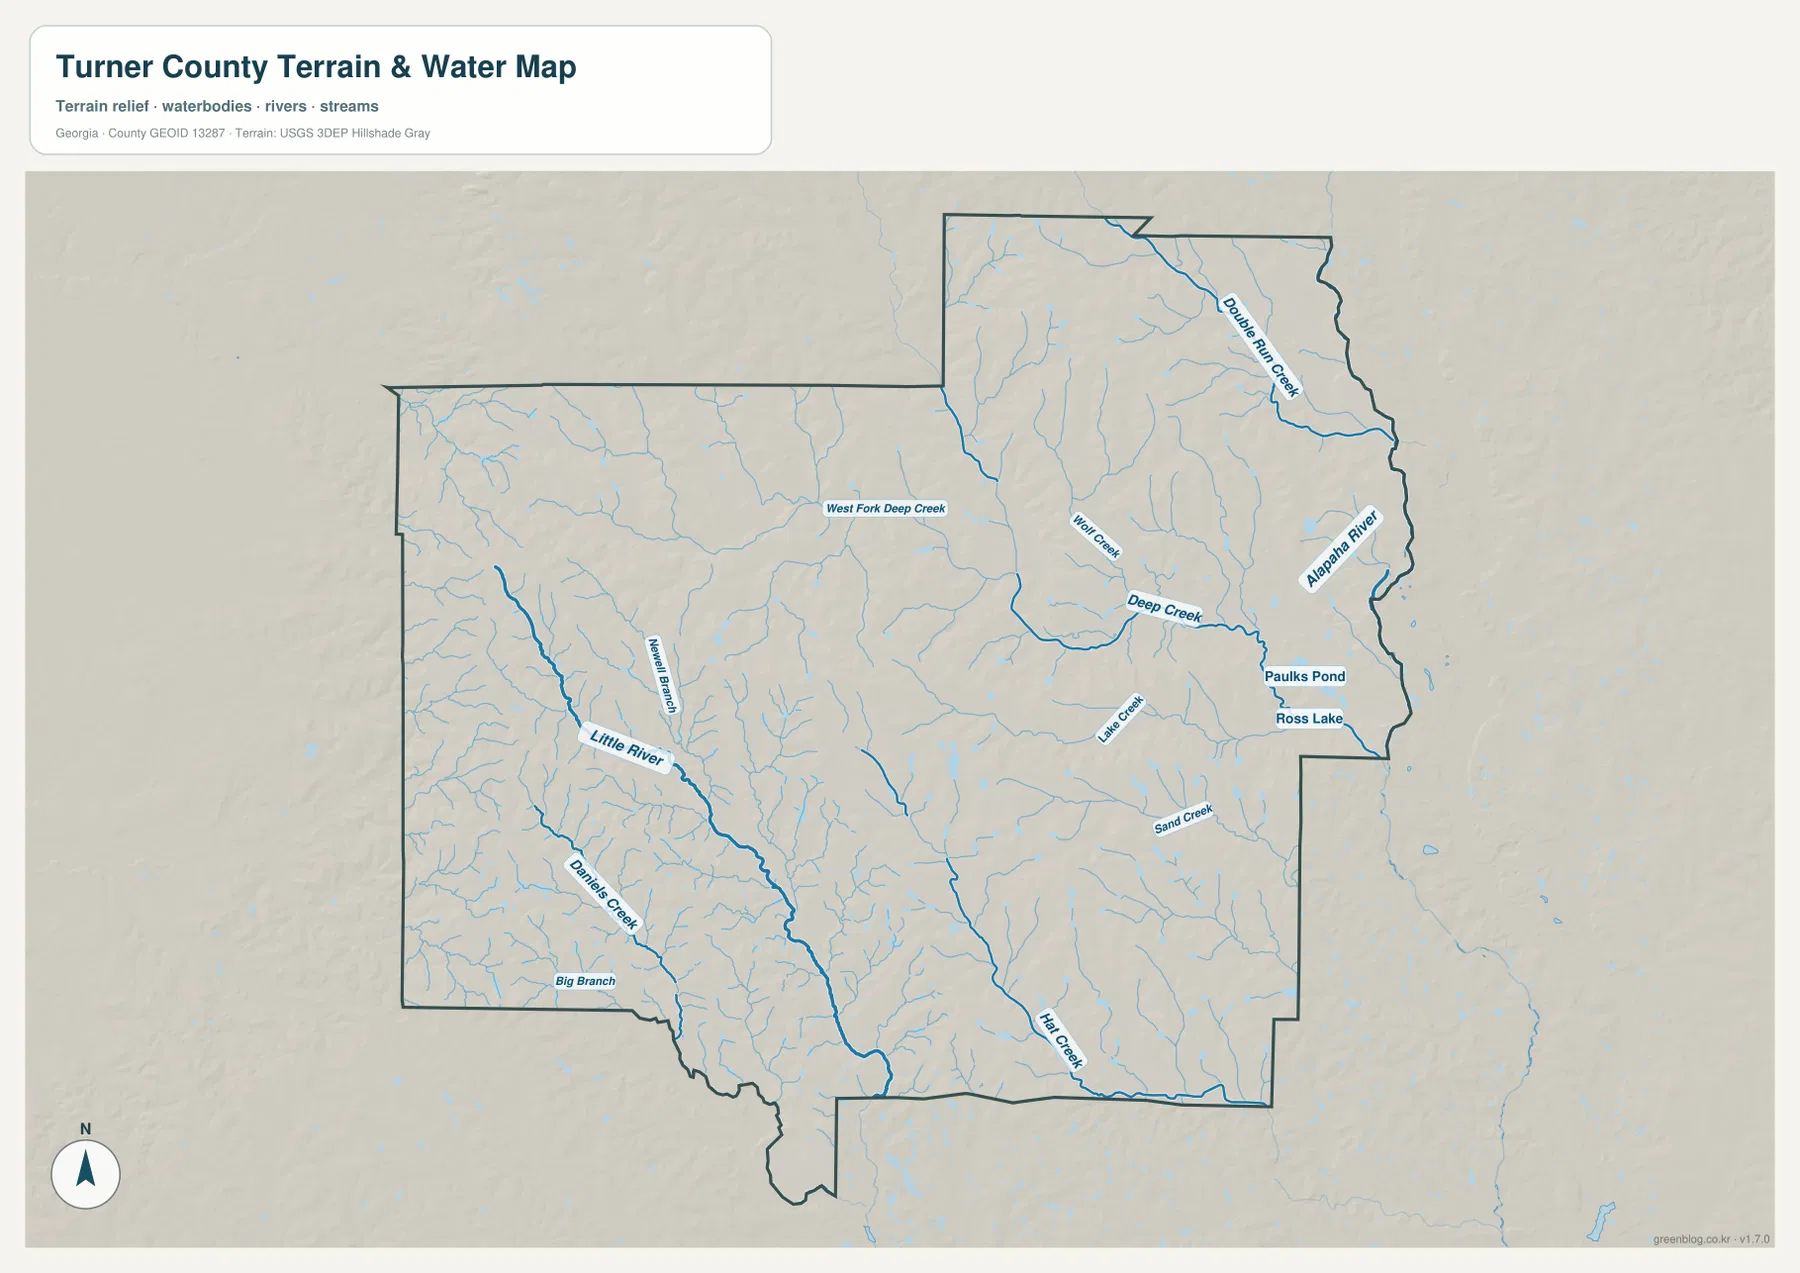
Several smaller features add useful detail without overwhelming the map. Paulks Pond and Ross Lake appear in the eastern interior, and other named creeks such as Sand Creek are shown among a dense network of tributaries. The western and southwestern parts also contain many short branches flowing toward the Little River. When the water map is compared with the general county map, stream positions that were only faint background lines become much easier to separate from highways and local place labels.
This map should be treated as a geographic water reference, not as a flood-hazard, navigation, parcel, or legal-boundary product. It is useful for identifying named rivers and creeks, comparing the western and eastern drainage areas, or adding water context to a county report. A floodplain decision, engineering project, or property question requires the appropriate official data for that specific purpose. Keeping that limitation clear makes the map more useful because it tells the reader exactly what the graphic can and cannot answer.
Higher western ground and lower stream corridors in the east
The elevation map shows that Turner County is not a uniform flat surface. Its legend gives an actual elevation range of roughly 83 to 147 meters, with a mean near 111 meters. Brown and tan areas, representing the higher part of that local range, are most extensive in the west and southwest. Greener lower elevations become more common toward the east and along narrow stream valleys that cut through the county.
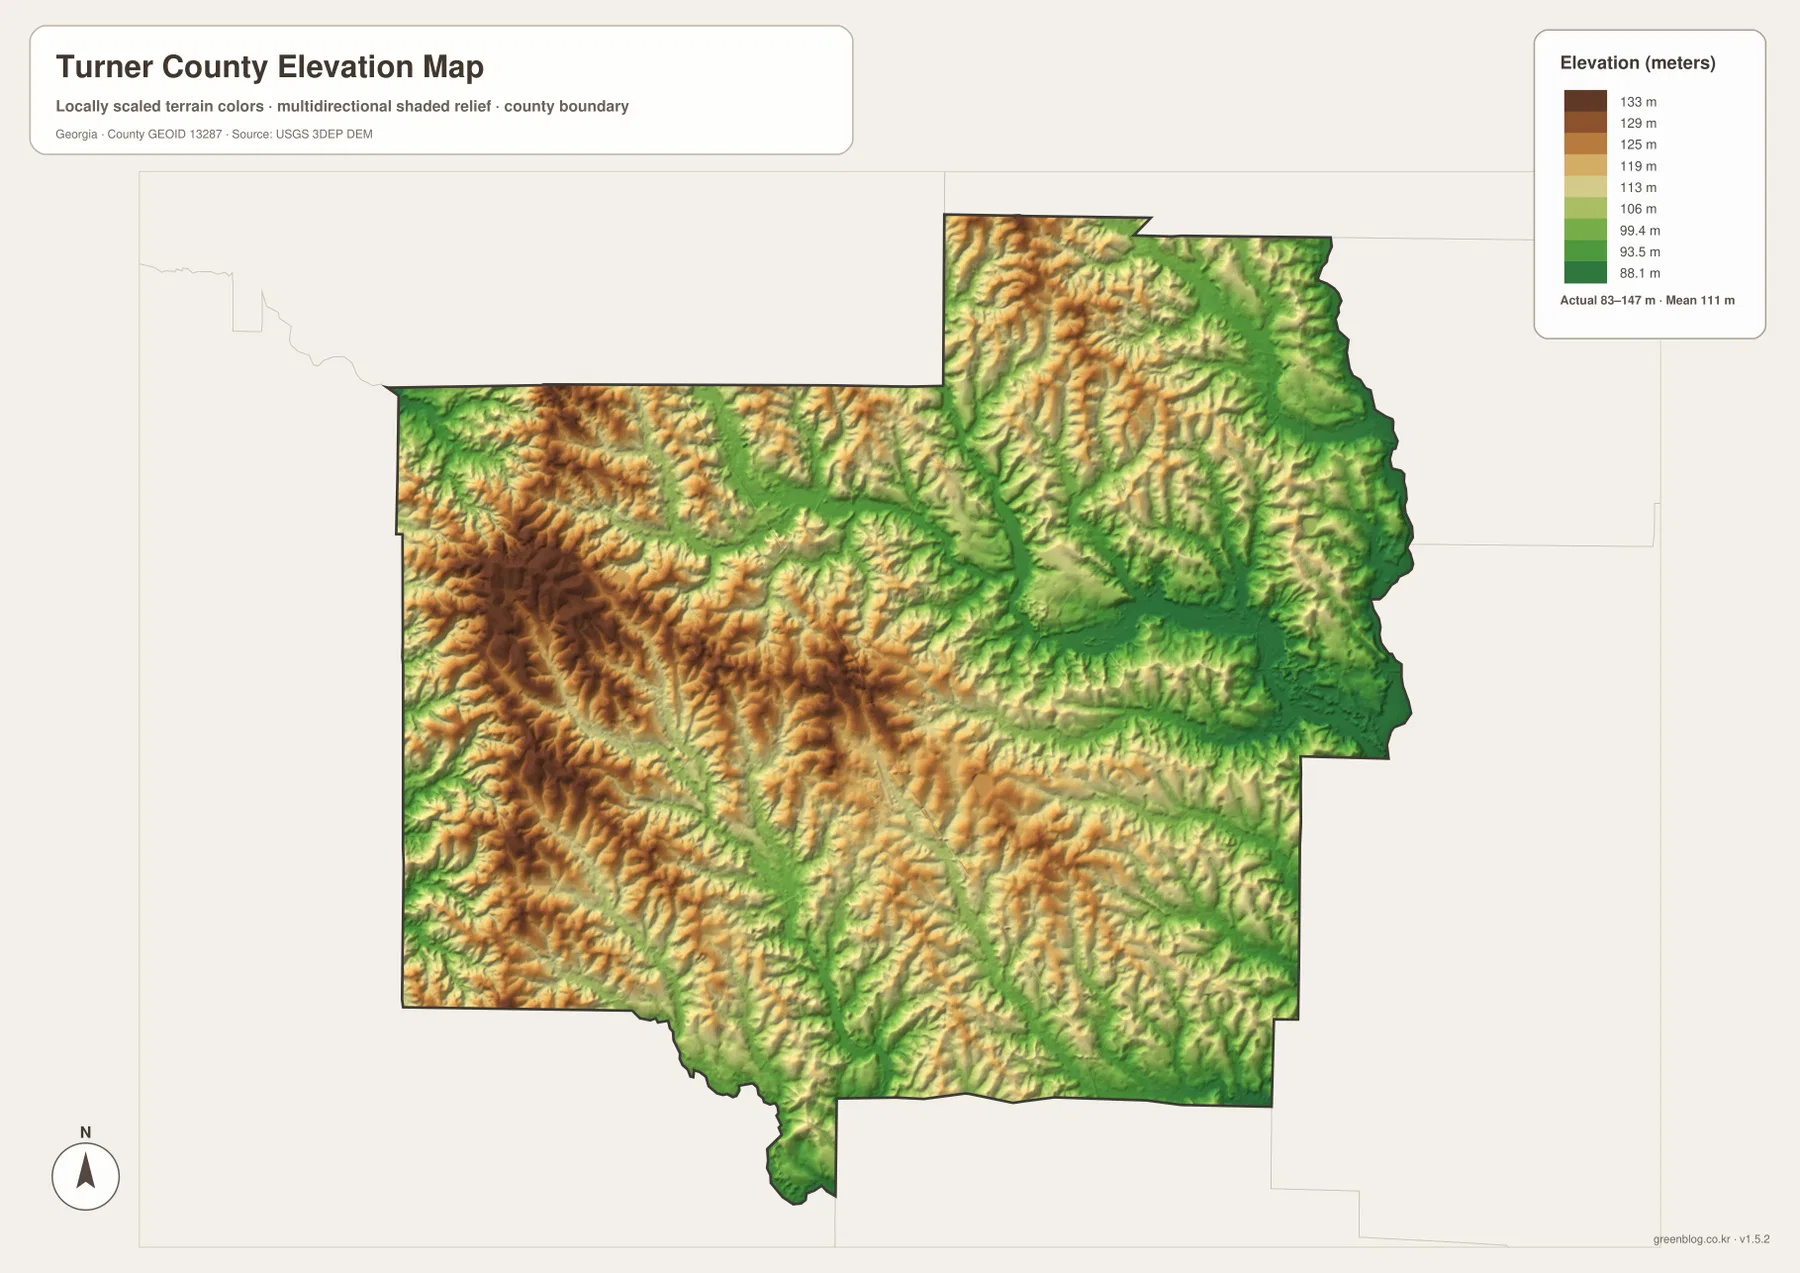
The relationship becomes especially clear when the elevation and water maps are viewed one after the other. Lower green corridors often follow the same parts of the county where streams are concentrated. The Alapaha River side is generally lower than the broad higher areas farther west, and many tributaries occupy narrow low strips within the shaded relief. The map therefore adds a terrain explanation to a place that might look mostly flat on a road-only graphic.
The shaded elevation surface is generalized for county-scale viewing. It is not survey-grade or engineering-grade measurement, and a color at a particular point should not be used as a substitute for a site elevation survey. For readers who need the original elevation source, the USGS 3D Elevation Program is the appropriate place to continue. On this page, the elevation map is best used to compare relative height across the county and to understand why stream corridors form visible low bands.
Which Turner County map fits the question?
For basic orientation, start with the county map. It combines the boundary, Ashburn, Sycamore, Rebecca, major road labels, and background water features in one view. It is the strongest choice for showing where Turner County is, where Ashburn sits inside it, and how the main north-south and east-west routes cross the county. The city map becomes more useful when the main point is the relationship among the three incorporated places rather than the entire road network.
For natural features, the water and elevation maps answer different but complementary questions. The water map is the better choice for naming the Little River, Alapaha River, Deep Creek, Double Run Creek, and smaller water bodies. The elevation map removes most place and road detail so the higher western terrain and lower eastern valleys stand out. In a presentation, using the county map first and then switching to one of these theme maps usually gives a clearer sequence than trying to explain every feature from a single image.
| Question | Best map to start with | Turner County detail to notice |
|---|---|---|
| Where are the boundary and main roads? | County map | Ashburn road concentration, I-75/U.S. 41 corridor, east-west routes |
| How are the incorporated places arranged? | City map | Sycamore south of Ashburn and Rebecca to the northeast |
| Where are the major waterways? | Water map | Little River in the west and Alapaha River on the east side |
| Where is the terrain higher or lower? | Elevation map | Higher west and southwest, lower stream corridors and eastern side |
The downloadable files are intended for readers who want more than the webpage preview. The four original JPG maps are sized for A3 output and can be enlarged or placed into a document without relying on a browser screenshot. Because each file emphasizes a different part of Turner County, the set works particularly well for lessons, local presentations, and reference documents where the road network, settlement pattern, water system, and terrain need to be shown separately.
Frequently Asked Questions
How are Ashburn, Sycamore, and Rebecca positioned within Turner County?
Ashburn is slightly west of the county’s center, Sycamore lies a short distance to the south, and Rebecca is farther away near the northeastern side. The city map labels the straight-line distance from Ashburn at about 3 miles to Sycamore and about 11 miles to Rebecca. Those figures are not road-mileage estimates.
Which map should I use to find the Little River and Alapaha River?
Use the water map. It makes the Little River system in the western half and the Alapaha River along the eastern side much easier to see than the general road map. Deep Creek, West Fork Deep Creek, Double Run Creek, and smaller water features are also labeled, but the map should not be used as a flood or legal water-boundary map.
What is the main elevation difference visible across the county?
The western and southwestern parts are generally higher within the local range, while the east and many stream corridors are lower. The legend shows about 83 to 147 meters with a mean near 111 meters. The map is appropriate for county-scale comparison, not for survey or engineering measurements at an individual site.
Sources and reference data
These links provide county background and the authoritative boundary, hydrography, and elevation sources used for further reference.
- U.S. Census Bureau QuickFacts for Turner County, Georgia
- New Georgia Encyclopedia: Turner County
- U.S. Census Bureau TIGER/Line Shapefiles
- USGS National Hydrography
- USGS 3D Elevation Program
Map File Information
The ZIP contains the Turner County boundary map, city-connections map, water map, and elevation map as four original high-resolution A3 JPG files. Download the set when you need larger originals for printing, classroom use, presentations, or offline reference.
- Included Files: 4 high-resolution A3 JPG maps
Related Maps
Green Map creates custom-edited map images using open geographic data sources such as geoBoundaries, Natural Earth, OpenStreetMap, and government open data. These maps are edited visual materials, not raw data files, and are provided for education, documents, presentations, and graphic reference.