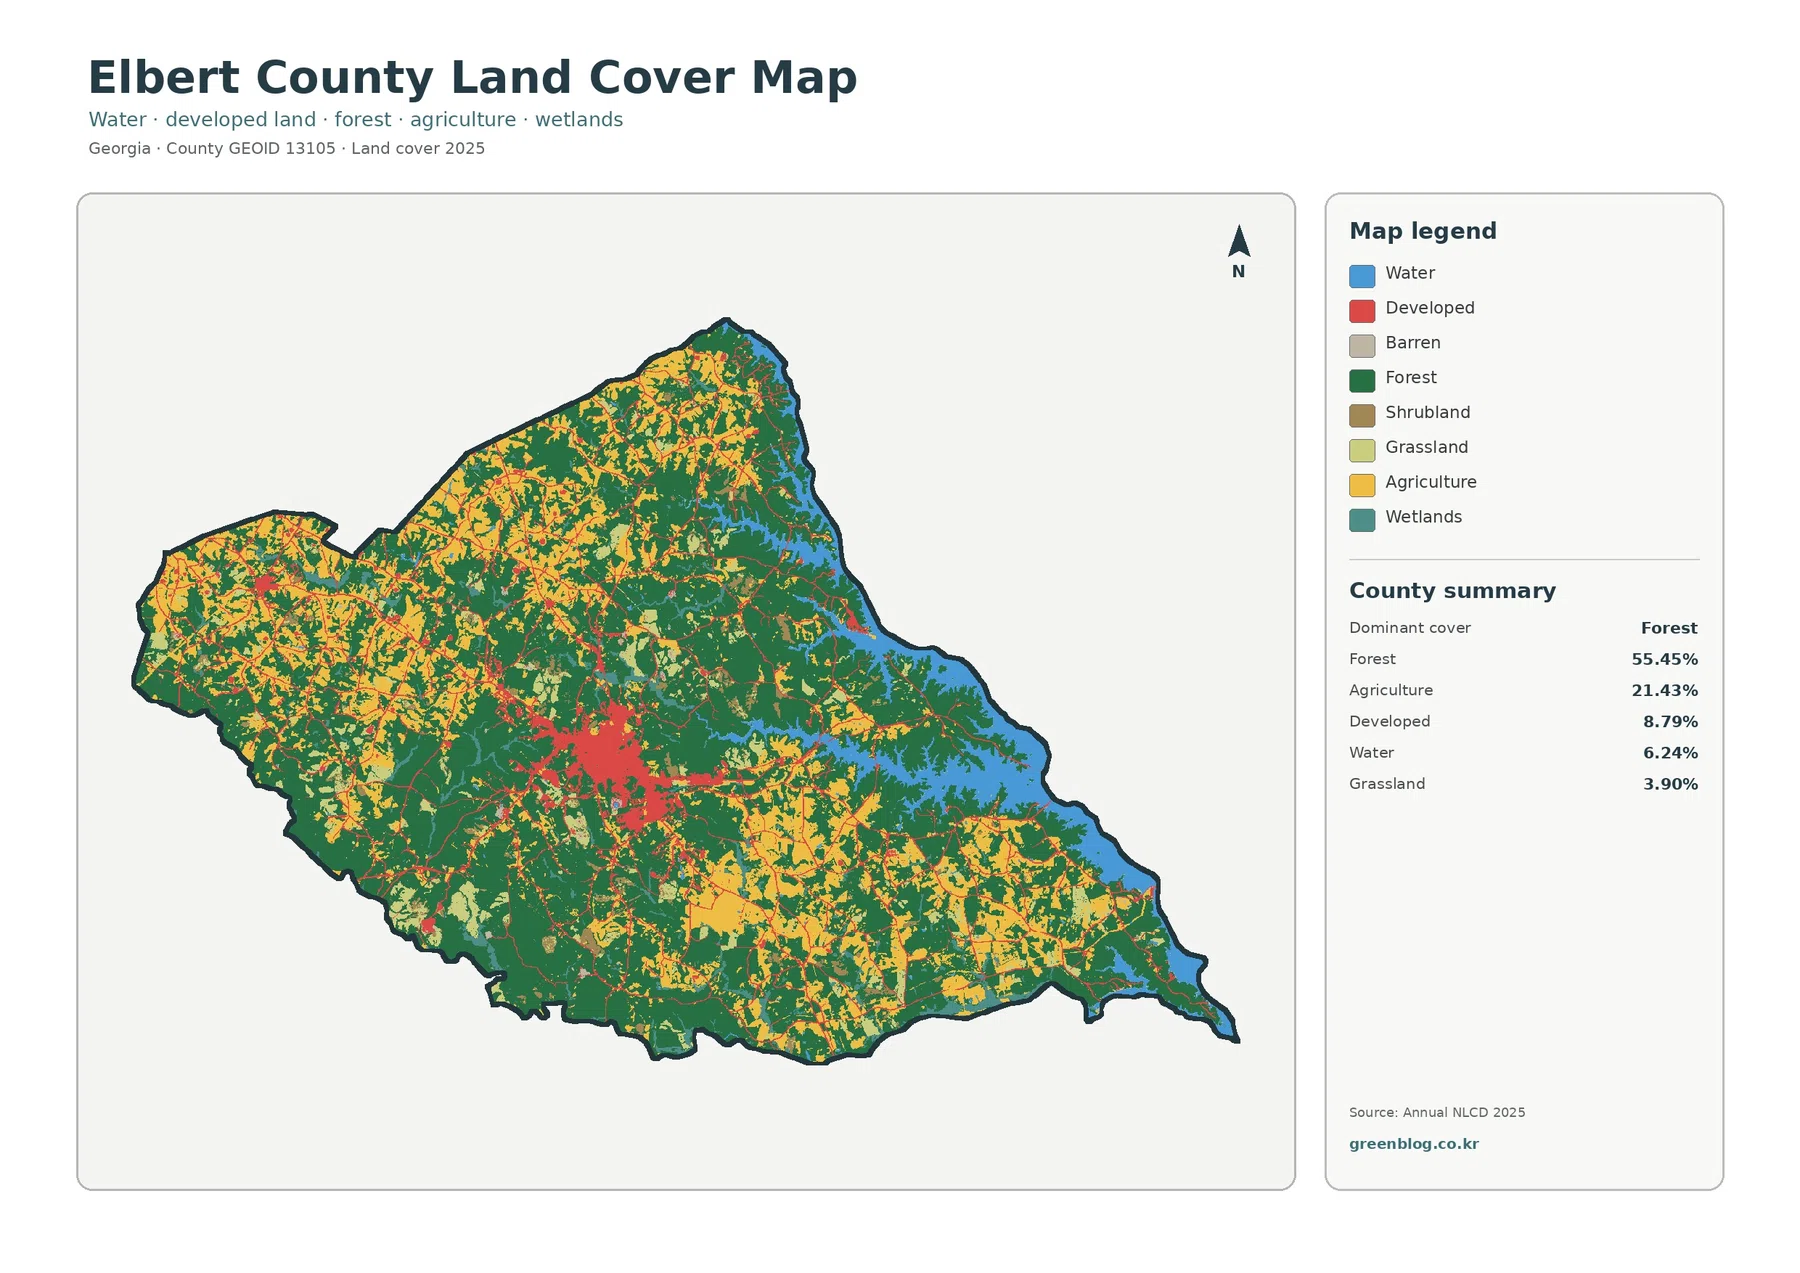
The Elbert County Georgia Land Cover Map set focuses on a county where forest remains the dominant surface while farmland, a compact built-up center, and a broad eastern water edge create clear contrasts. The 2025 summary reports 55.45% forest and 21.43% agriculture, with the strongest developed concentration centered on Elberton.
Four original JPG maps are available together in one download: current land cover, forest and farmland, impervious surface, and the 1985–2025 change comparison. They are useful when you need to compare the county at the same scale without treating a land-cover classification as a zoning or parcel map.
Table of Contents
Forest still defines most of the 2025 county landscape
Forest accounts for 55.45% of Elbert County in the 2025 summary, more than twice the agricultural share of 21.43%. Developed cover reaches 8.79%, water 6.24%, and grassland 3.90%. Those percentages matter because the county is not simply a solid block of woods. Farming breaks up the forest in several parts of the county, while the Elberton area produces a compact patch of developed cover near the middle.
The general map makes the directional contrast easy to see. Large forest areas remain through the central-southern and southwestern portions of the county. Agricultural colors occur more frequently in the northwest and north, then reappear in sizable patches across the southeast. Water is especially conspicuous along the eastern side, where it forms a long boundary rather than a scattering of small isolated ponds.
Land cover describes what physically covers the ground at the observation date. A forest class means the surface was classified as wooded; developed classes represent built surfaces and their surroundings; agriculture identifies crop or pasture-related cover. None of those labels determines ownership, zoning, development rights, or the legal boundary of a parcel.
The eastern water edge changes how the county should be read
Water makes up 6.24% of the mapped county, and much of that blue area follows the eastern side. This is an important local feature rather than a minor background detail. Elbert County reaches the Savannah River system and the Richard B. Russell Lake area, so the eastern edge looks very different from the farm-and-forest pattern that covers most of the interior.
Georgia State Parks describes Richard B. Russell State Park as being located on a 26,650-acre lake along the Savannah River watershed. That official local context helps explain why the water class has a large visual footprint on the county map. Forest also remains common immediately inland from the water, producing long wooded stretches beside the reservoir edge.
For watershed or environmental presentations, this eastern side is a useful reference because the transition from open water to forest can be seen at county scale. The map does not identify shoreline ownership, flood zones, dock rights, wetlands jurisdiction, or water-quality status. Those questions require different source layers even when the same lake appears in the background.
Working land appears in many patches rather than one continuous farm belt
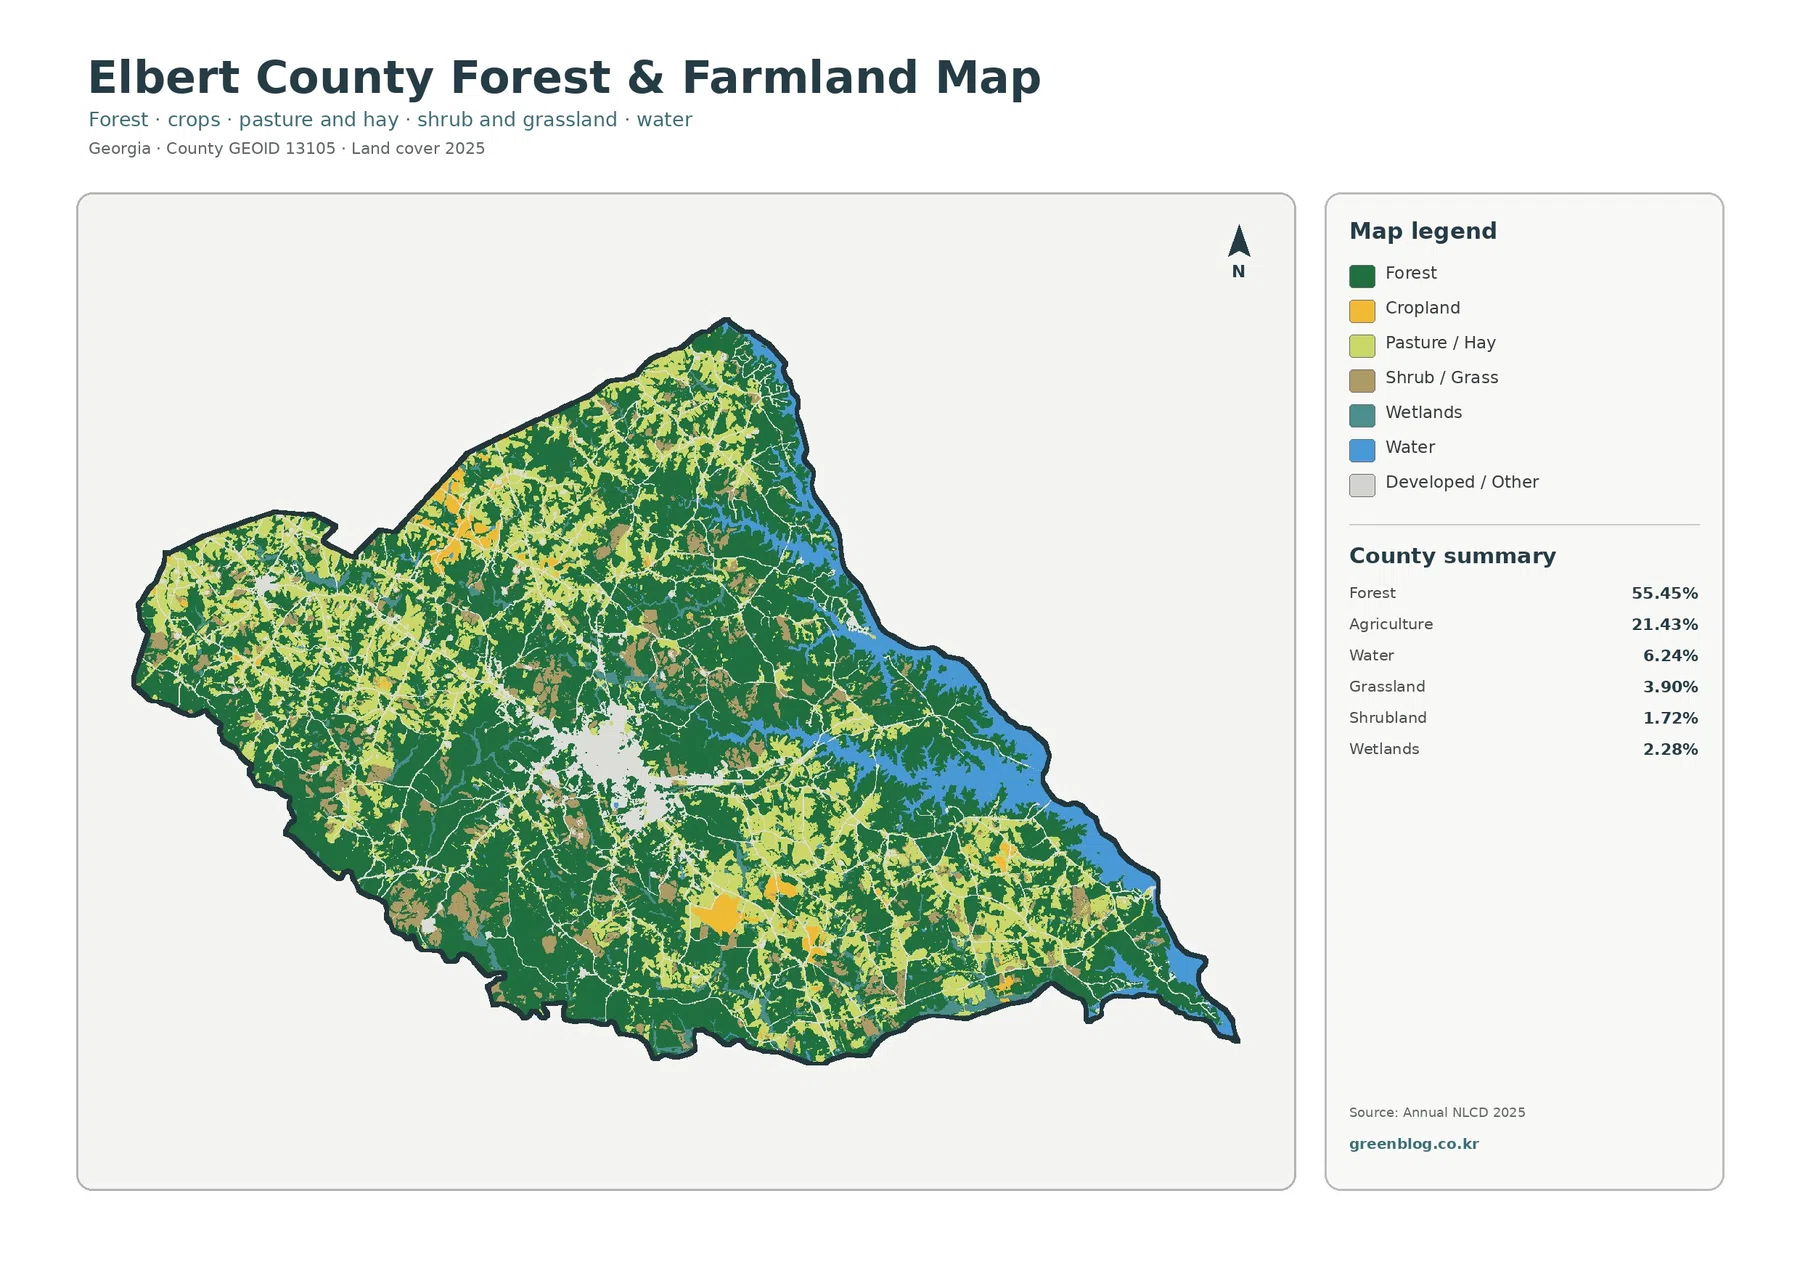
The forest-and-farmland version strips away much of the visual competition from developed classes and makes the working-land pattern easier to compare. Agriculture totals 21.43%, but it is distributed in multiple clusters. The northwest contains a dense mix of agricultural and pasture-like areas among forest. Additional farm blocks appear north of the county center and again across the southeastern half.
Forest is much more continuous in parts of the south-central and southwestern county. It also follows many sections near the eastern water boundary. This arrangement is useful when comparing land that appears relatively open with land that remains wooded, especially because the agricultural share is substantial without becoming the dominant class countywide.
The summary on this map also lists grassland at 3.90%, wetlands at 2.28%, and shrubland at 1.72%. These smaller classes are not concentrated in a single county-sized block. They occur as scattered pieces among forest, farms, and water. That makes the simplified map more helpful than a percentage table alone, because the reader can see where smaller cover types interrupt the two largest classes.
Elberton forms the main concentration of hard surfaces
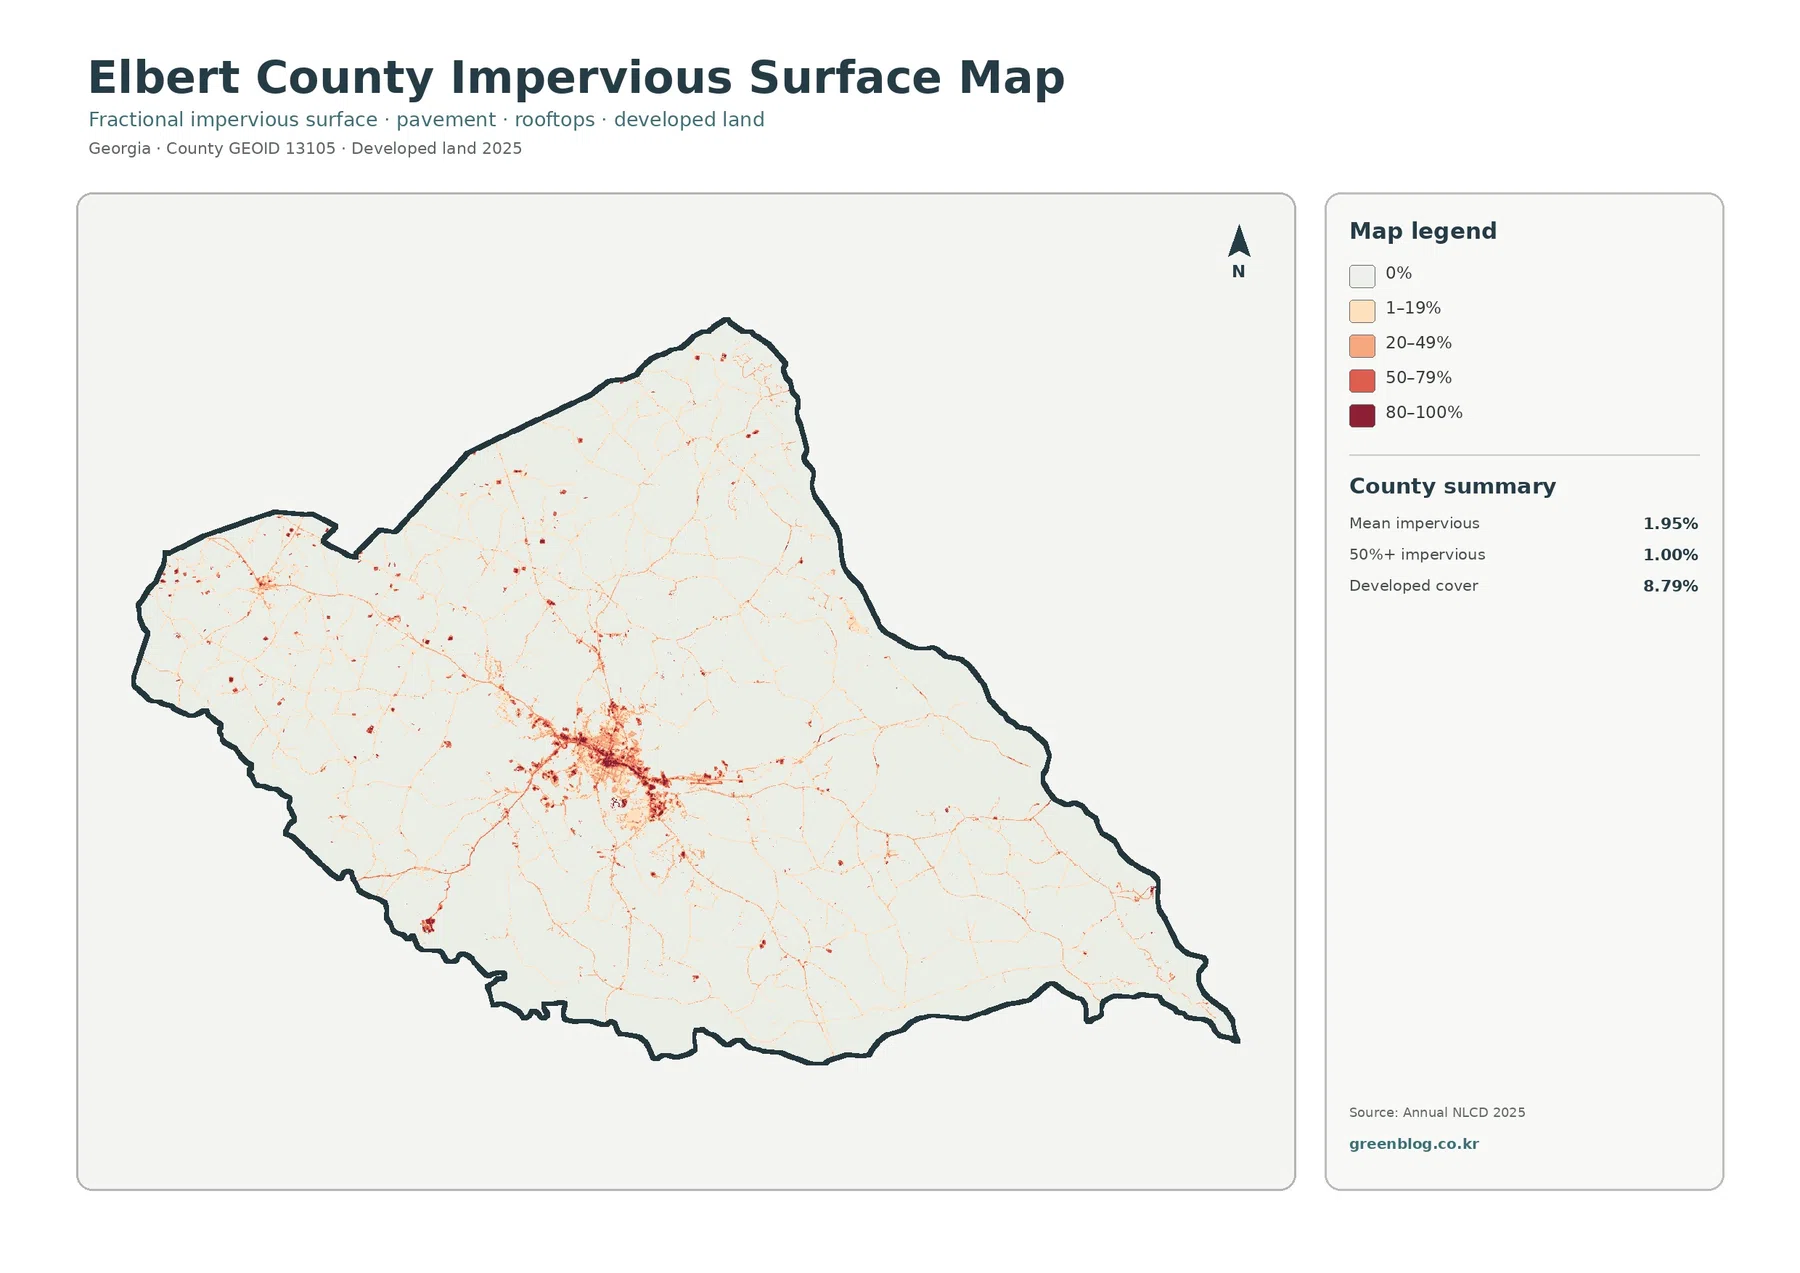
The impervious-surface map tells a different story from the forest and farmland view. Most of the county is very light because roofs, pavement, and other surfaces that resist water infiltration occupy a small fraction of the total area. The mean impervious value is 1.95%, and only 1.00% of the county falls in the 50%-or-more impervious category.
Against that light background, the central Elberton area stands out immediately. It contains the strongest cluster of darker impervious pixels and a network of thinner developed lines extending outward. Smaller concentrations appear elsewhere, including the western and northwestern portions, but they do not approach the density of the central cluster. The overall developed-cover share of 8.79% therefore represents a pattern that is concentrated rather than evenly spread.
Elberton’s official city site identifies it as the Elbert County seat, providing a reliable reference for interpreting that central built-up area. The map can show that development and transportation surfaces occur together in the same corridors, but it cannot prove that a particular road caused nearby development. A land-cover image is best used to describe location and concentration, not to assign a cause without a planning or transportation study.
A 40-year comparison shows widespread class differences, not a single trend
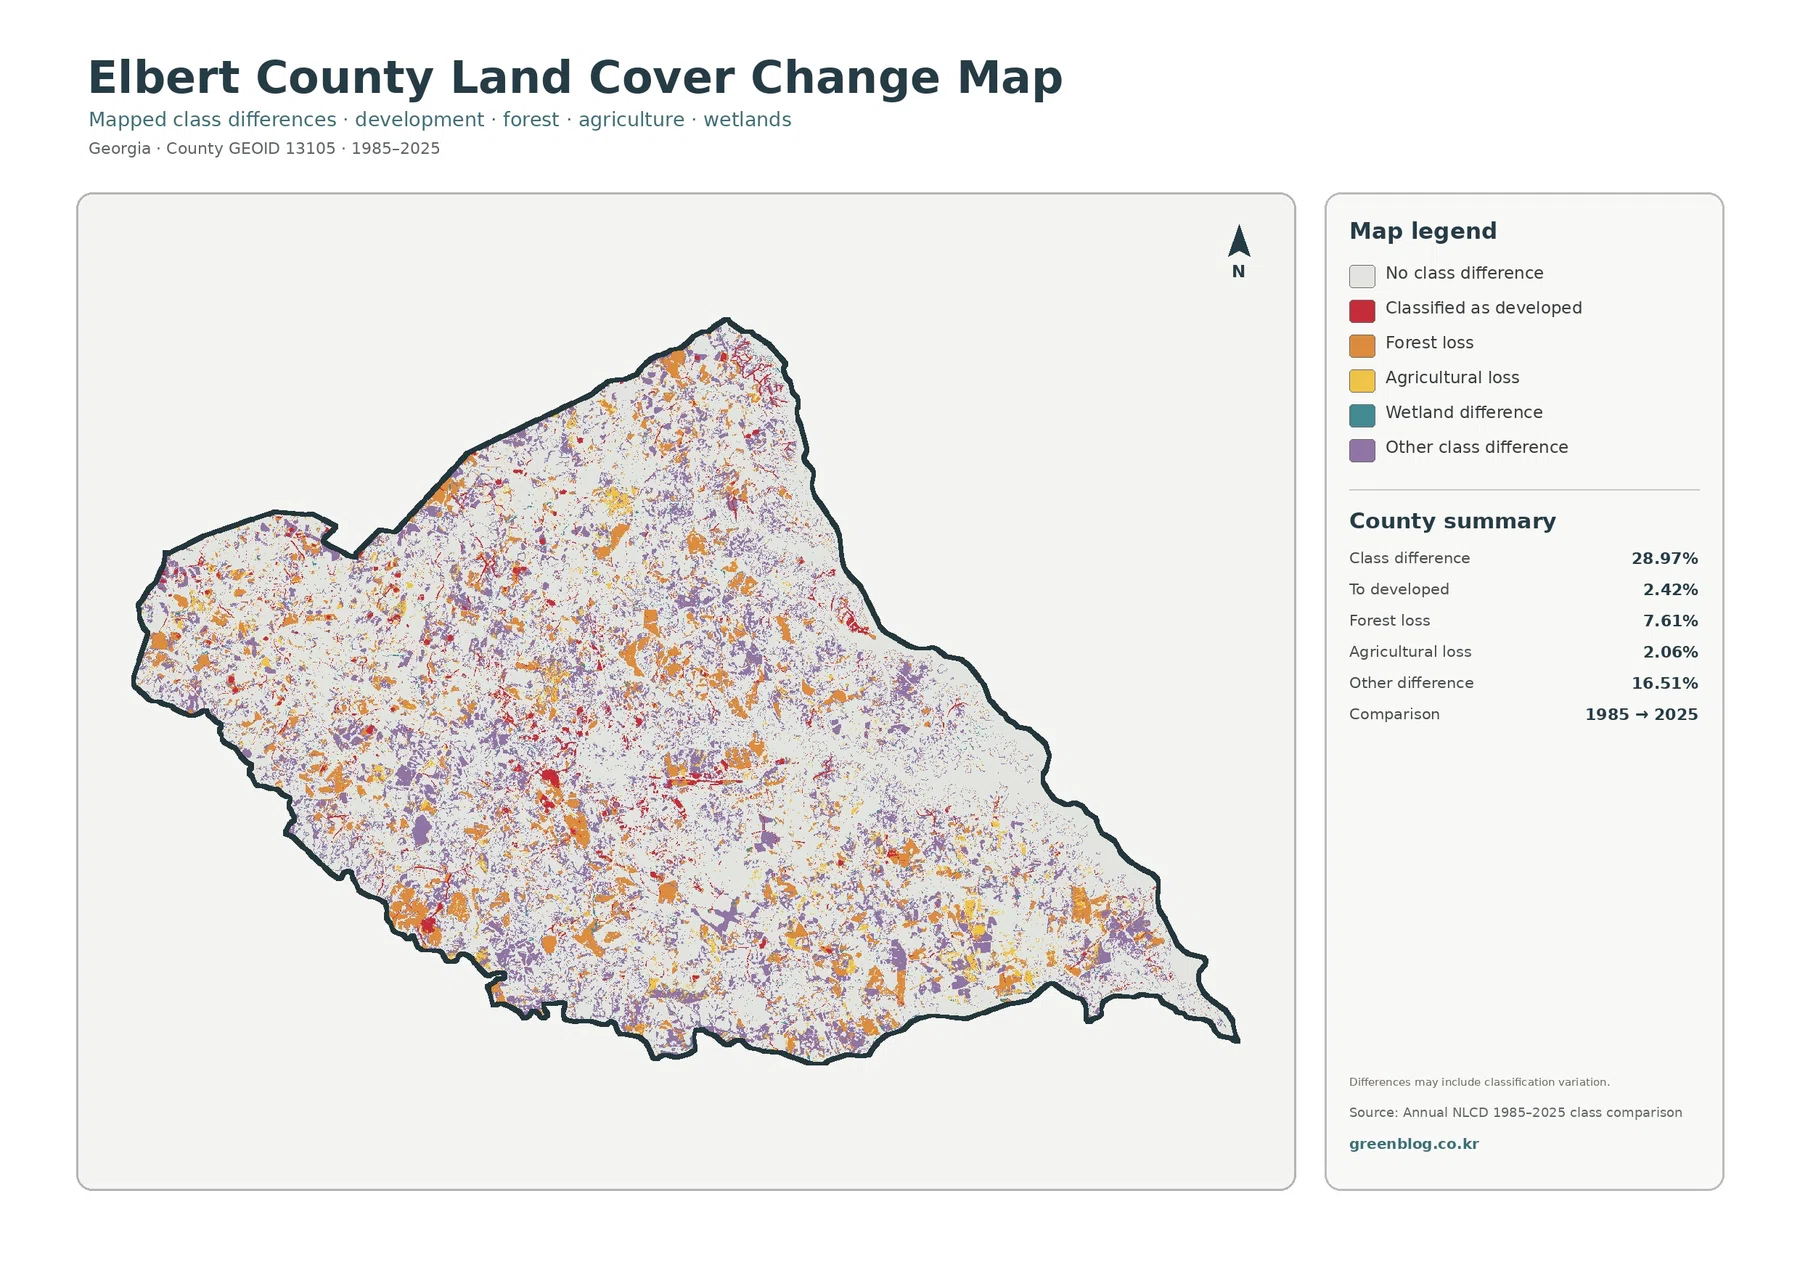
The 1985–2025 comparison marks 28.97% of the county as having a class difference between the two mapped dates. Within that total, 2.42% is identified as change to developed cover, 7.61% as forest loss, and 2.06% as agricultural loss. Another 16.51% falls in the broader “other class difference” category.
Changed pixels occur across much of the county rather than forming one narrow band. Forest-loss colors are visible in numerous patches, while developed-change colors are more noticeable around the central built-up area and along scattered corridors. The map also contains many smaller areas assigned to other differences, which is one reason the total class-difference figure is much larger than the share classified as newly developed.
The distinction matters when reading a long-period change map. A class difference means the mapped category at one date does not match the category at the other date. It does not, by itself, identify the exact year of change or explain whether the difference came from construction, harvesting, agricultural rotation, regrowth, water conditions, or classification variation. The map itself warns that classification variation may contribute to the result.
Planning documents answer different questions from land-cover maps
The Georgia Department of Community Affairs hosts the 2022 comprehensive-plan materials for Elbert County and the cities of Bowman and Elberton. Those documents are useful for understanding planning goals and land-use policy. The four maps on this page instead describe mapped surface cover, so they should not be used as substitutes for zoning, subdivision, parcel, or future-land-use maps.
This distinction is especially important around the Elberton area and the reservoir edge. A wooded pixel does not establish a protected tract, and a developed pixel does not establish a commercial or residential zoning category. Likewise, agriculture in the land-cover legend describes a mapped surface class rather than a legal agricultural designation. Comparing the two types of sources can be informative only if their separate purposes are kept clear.
How to compare the four files without over-reading the detail
Start with the general land-cover map when you need the countywide balance among forest, agriculture, development, water, and smaller classes. Move to the forest-and-farmland version when the main question is how working land is distributed within a mostly wooded county. The impervious map is the better choice for locating the strongest built-surface concentrations, while the change map adds a historical comparison.
For a classroom or presentation, pairing two maps often communicates more than using all four at once. The forest-and-farmland image beside the impervious image shows that the county can have a substantial agricultural presence and still keep its hard-surface footprint concentrated around a relatively small number of places. Pairing the current land-cover map with the change map shifts the discussion from “what is there now?” to “where did the mapped class differ between the two dates?”
Each original JPG in the download is 2480×1754 pixels. The maps are generalized raster classifications, so narrow roads, small ponds, mixed land-cover edges, and individual parcels can look simplified at this scale. Annual NLCD products are designed for broad land-cover analysis rather than parcel surveying. For a property-level question, use current local records and more detailed imagery instead of treating a raster cell as a legal boundary.
The same caution applies to the 2025 date. It describes the mapped reference year, not a guarantee that every surface remains unchanged afterward. Recent construction, clearing, planting, flooding, or vegetation growth may not appear until a newer dataset is available. The four-map set is therefore strongest as a consistent county reference and comparison tool.
Frequently Asked Questions
What is the dominant land-cover class in Elbert County?
Forest is the largest 2025 class at 55.45%. Agriculture is second at 21.43%, followed by developed cover at 8.79%. The map shows that the agricultural share is dispersed through several parts of the county rather than forming one continuous block.
Why is the eastern side of the county so blue on the land-cover map?
The eastern edge includes major water associated with the Savannah River system and Richard B. Russell Lake. Water accounts for 6.24% of the mapped county, and the long reservoir boundary gives that class a much larger visual presence than scattered interior ponds would.
Does the 28.97% change figure mean that nearly one-third of Elbert County was developed?
No. The 28.97% figure is the total share with a different mapped class between 1985 and 2025. Only 2.42% is categorized as change to developed cover. Forest loss, agricultural loss, other class differences, and possible classification variation make up the rest of the comparison.
Sources and Reference Material
MRLC Annual NLCD Data provides access to the national land-cover datasets used for broad surface classification and comparison.
USGS Annual NLCD Land Cover Classification explains the official land-cover classes and how the data products are organized.
Georgia Department of Community Affairs: Elbert County Comprehensive Plan hosts official planning documents for Elbert County, Bowman, and Elberton.
City of Elberton provides official local information identifying Elberton as the county seat.
Georgia State Parks: Richard B. Russell State Park provides official information about the large reservoir setting along the Savannah River watershed.
U.S. Census Bureau TIGER/Line Shapefiles are an official reference source for county boundaries and geographic linework.
Map File Information
The download contains the four original Elbert County JPG maps: 2025 land cover, forest and farmland, impervious/developed land, and the 1985–2025 land-cover change comparison.
- Included Files: Land cover, forest & farmland, impervious/developed land, land-cover change
- Printable Size: 2480×1754 pixels each
- File Type: ZIP containing four JPG images
- Intended Use: County comparison, classroom work, presentations, documents, and land-cover reference
Related Maps
- Appling County Georgia Land Cover Map
- Atkinson County Georgia Land Cover Map
- Bacon County Georgia Land Cover Map
Green Map creates custom-edited map images using open geographic data sources such as geoBoundaries, Natural Earth, OpenStreetMap, and government open data. These maps are edited visual materials, not raw data files, and are provided for education, documents, presentations, and graphic reference.