The Wakulla County Florida Land Cover Map is dominated by wet and wooded surfaces. Wetlands account for 49.27% of the supplied 2025 summary and forest adds another 35.44%. Developed land is only 6.92%, while water is 2.88%, agriculture 2.04%, grassland 1.63%, and shrubland 1.63%. A compact developed concentration appears near the middle of the county, but most of the map is still made up of wetlands and forest.
Four related map views are provided on this page: 2025 land cover, forest and farmland, impervious surface and developed land, and a 1985–2025 class-difference map. The WebP images make it easy to compare them in the article, and the four original JPG files are available together in one ZIP download below. The set works well for county profiles, classroom lessons, environmental presentations, and comparisons with other Florida counties.
Table of Contents
A low impervious share helps explain why the developed footprint remains visually compact
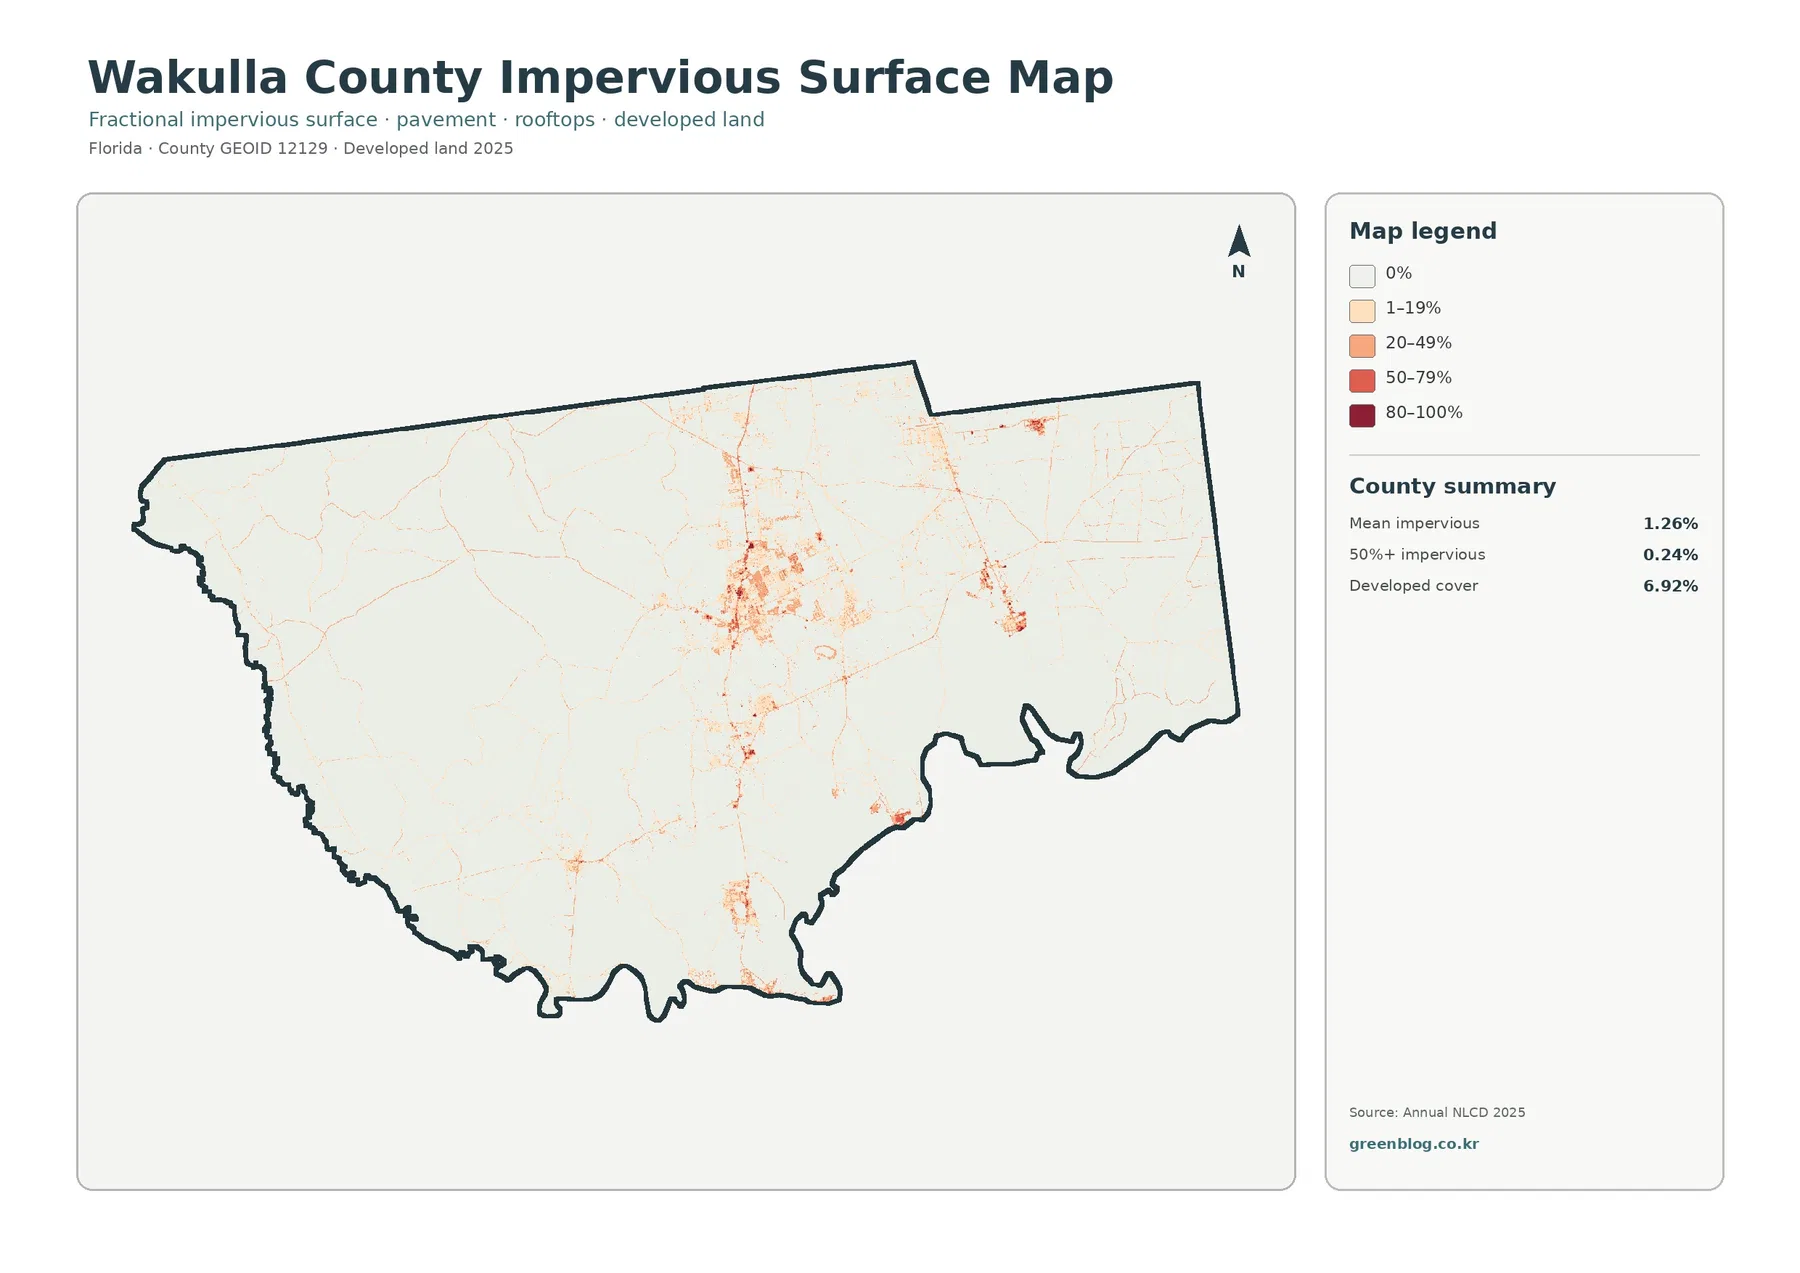
Wakulla County has a mean impervious cover of only 1.26%, and just 0.24% of the county is mapped at 50% or greater impervious surface. Those figures are much lower than the 6.92% developed-land share. The difference matters because developed land is a broad class that can include yards, trees, grass, and other permeable ground along with roads and buildings. Impervious cover isolates hard surfaces such as rooftops, pavement, and parking areas.
The strongest impervious values sit near the central developed concentration. Thin orange and red traces extend outward, with smaller concentrations farther east and south. Most of the western, southern, and eastern portions of the county remain very pale. The map therefore shows recognizable built-up places without suggesting that hard surface is widespread across the county.
Narrow colored traces can resemble roads, but the map is not a transportation layer. It does not provide route names, traffic volume, lane counts, or road condition. Impervious percentage only describes surface hardness. It also should not be used as a flood-risk map because rainfall, soils, elevation, wetlands, tidal influence, and drainage infrastructure are separate factors.
The 2025 overview is dominated by wetlands and forest
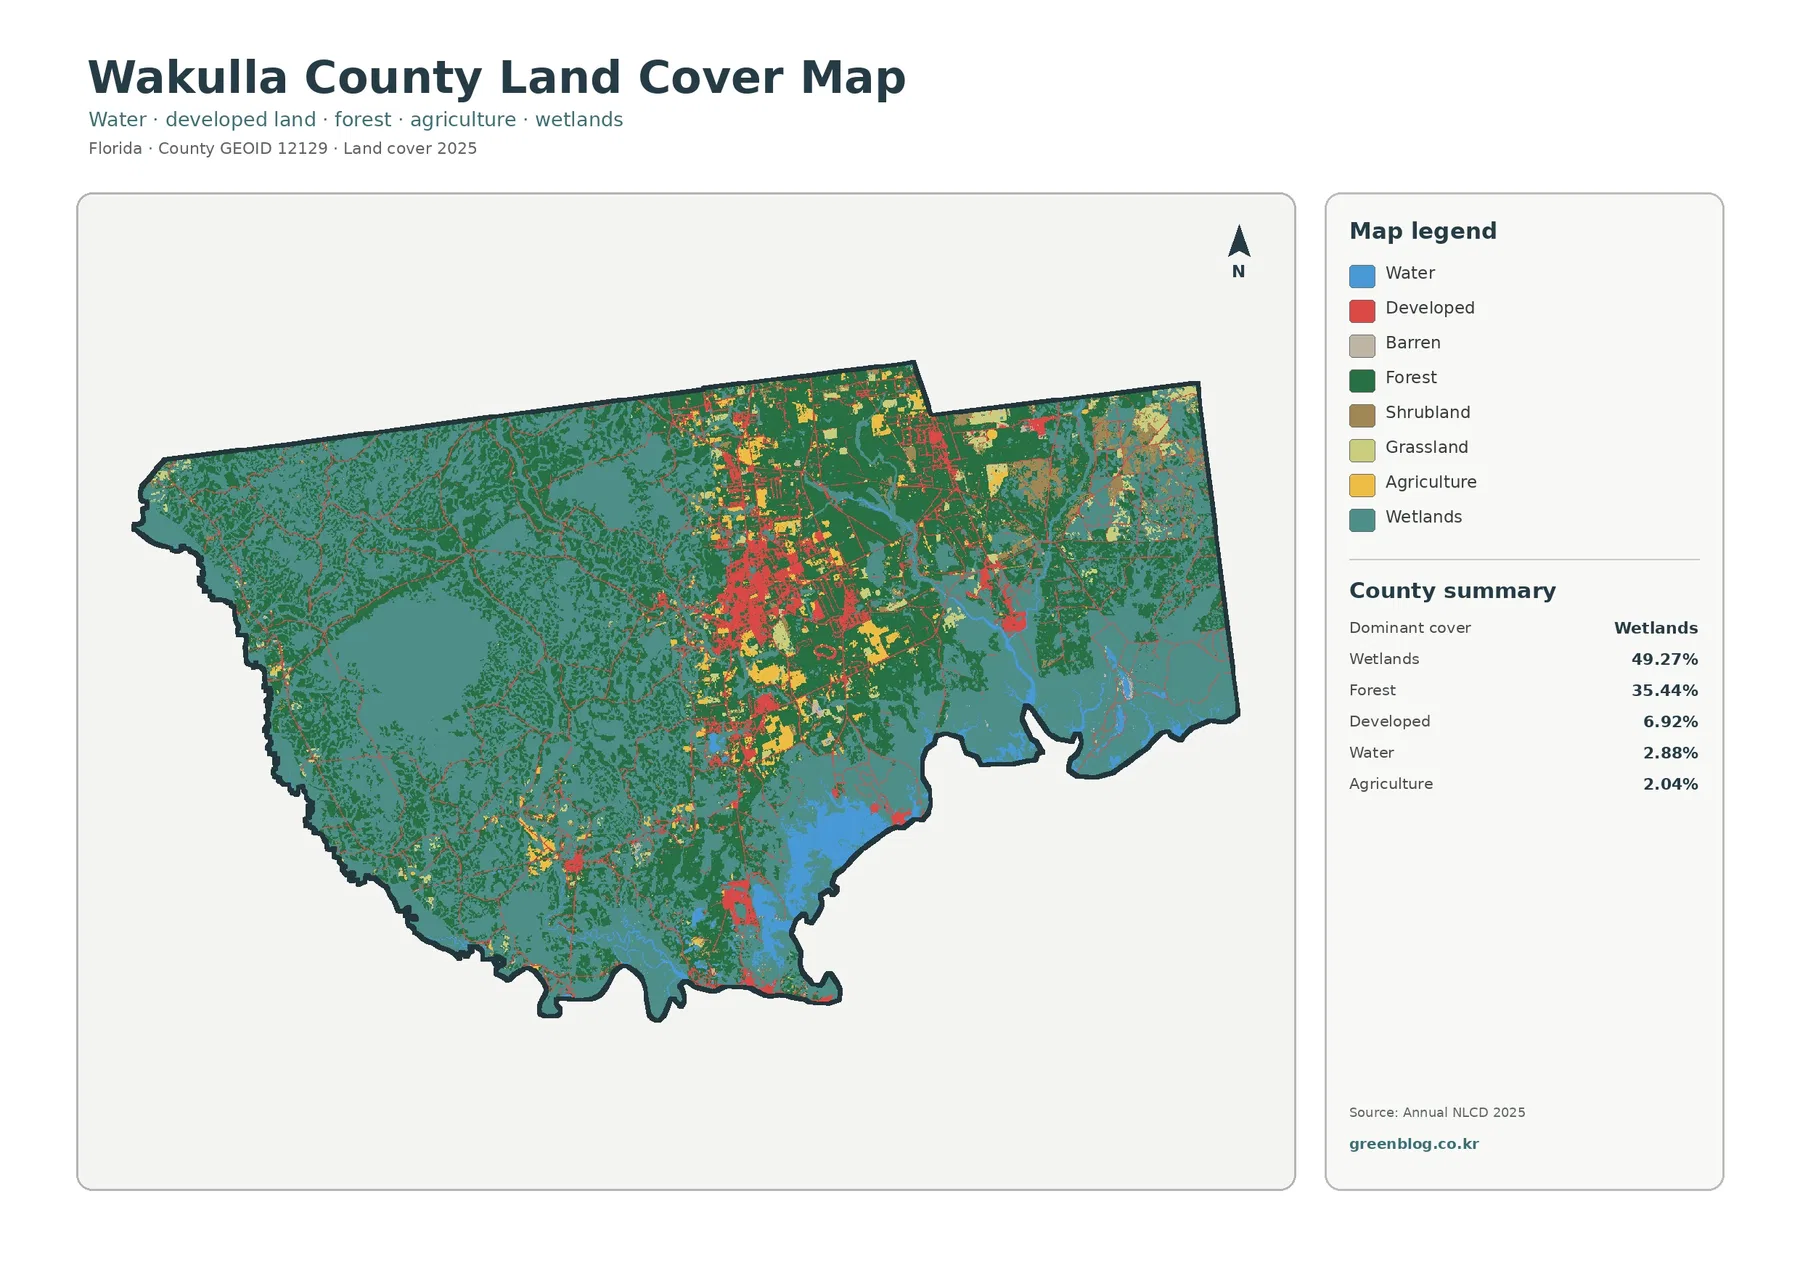
Wetlands are the largest class at 49.27%. Teal cover spreads across broad western and southern areas and continues through substantial portions of the east. Wetland cells also occur close to the central developed area, so the class is not limited to one edge of the county. Its nearly one-half share matches the visual impression of a county where wet ground is a major part of the landscape.
Forest is the second-largest class at 35.44%. Dark green is widespread across the north and center and also appears in smaller pieces within wetland-dominated areas. Wetlands and forest repeatedly meet rather than forming two cleanly separated districts. Together they account for more than 84% of the supplied summary, which explains why the overall map looks overwhelmingly natural even with a visible developed core.
Developed land covers 6.92%. Red areas are most obvious in the central portion of the county, with thinner traces extending north and south and smaller developed areas elsewhere. Agriculture is only 2.04%, and its yellow areas are concentrated mainly near the center and northeast. Grassland and shrubland are each 1.63%, adding smaller open-vegetation areas among the larger forest and wetland classes.
Open water is 2.88%, far below the wetland share. That distinction is useful because water-related landscapes are not represented only by blue cells. Wetlands can contain saturated soil and wetland vegetation without appearing as open water. In Wakulla County, the difference between 49.27% wetlands and 2.88% water is one of the clearest lessons in the map set.
St. Marks provides useful coastal context without defining every wetland cell
The U.S. Fish and Wildlife Service describes St. Marks National Wildlife Refuge as spanning Wakulla, Jefferson, and Taylor counties and including coastal marshes, islands, tidal creeks, and estuaries along the north Florida Gulf coast. That official description provides useful local context for a county where wetland cover is so extensive. It does not mean every teal cell in the land-cover map lies inside the refuge.
Management boundaries and land-cover classes answer different questions. A refuge map identifies a protected area and its administrative boundary, while this article classifies what covers the ground. A wetland cell may be public or private, protected or unprotected, and a forest cell does not automatically identify a national forest or conservation tract. Ownership and regulatory status require separate official sources.
This distinction also helps when comparing wetlands with open water. The county can have a strong coastal and aquatic setting even though the mapped open-water share is only 2.88%. Marshes and other wetlands may be visibly connected to water but remain land-cover classes of their own. For teaching, the county is a useful example of why “wet” does not always mean “open blue water.”
The vegetation-focused map makes the small agricultural areas easier to find
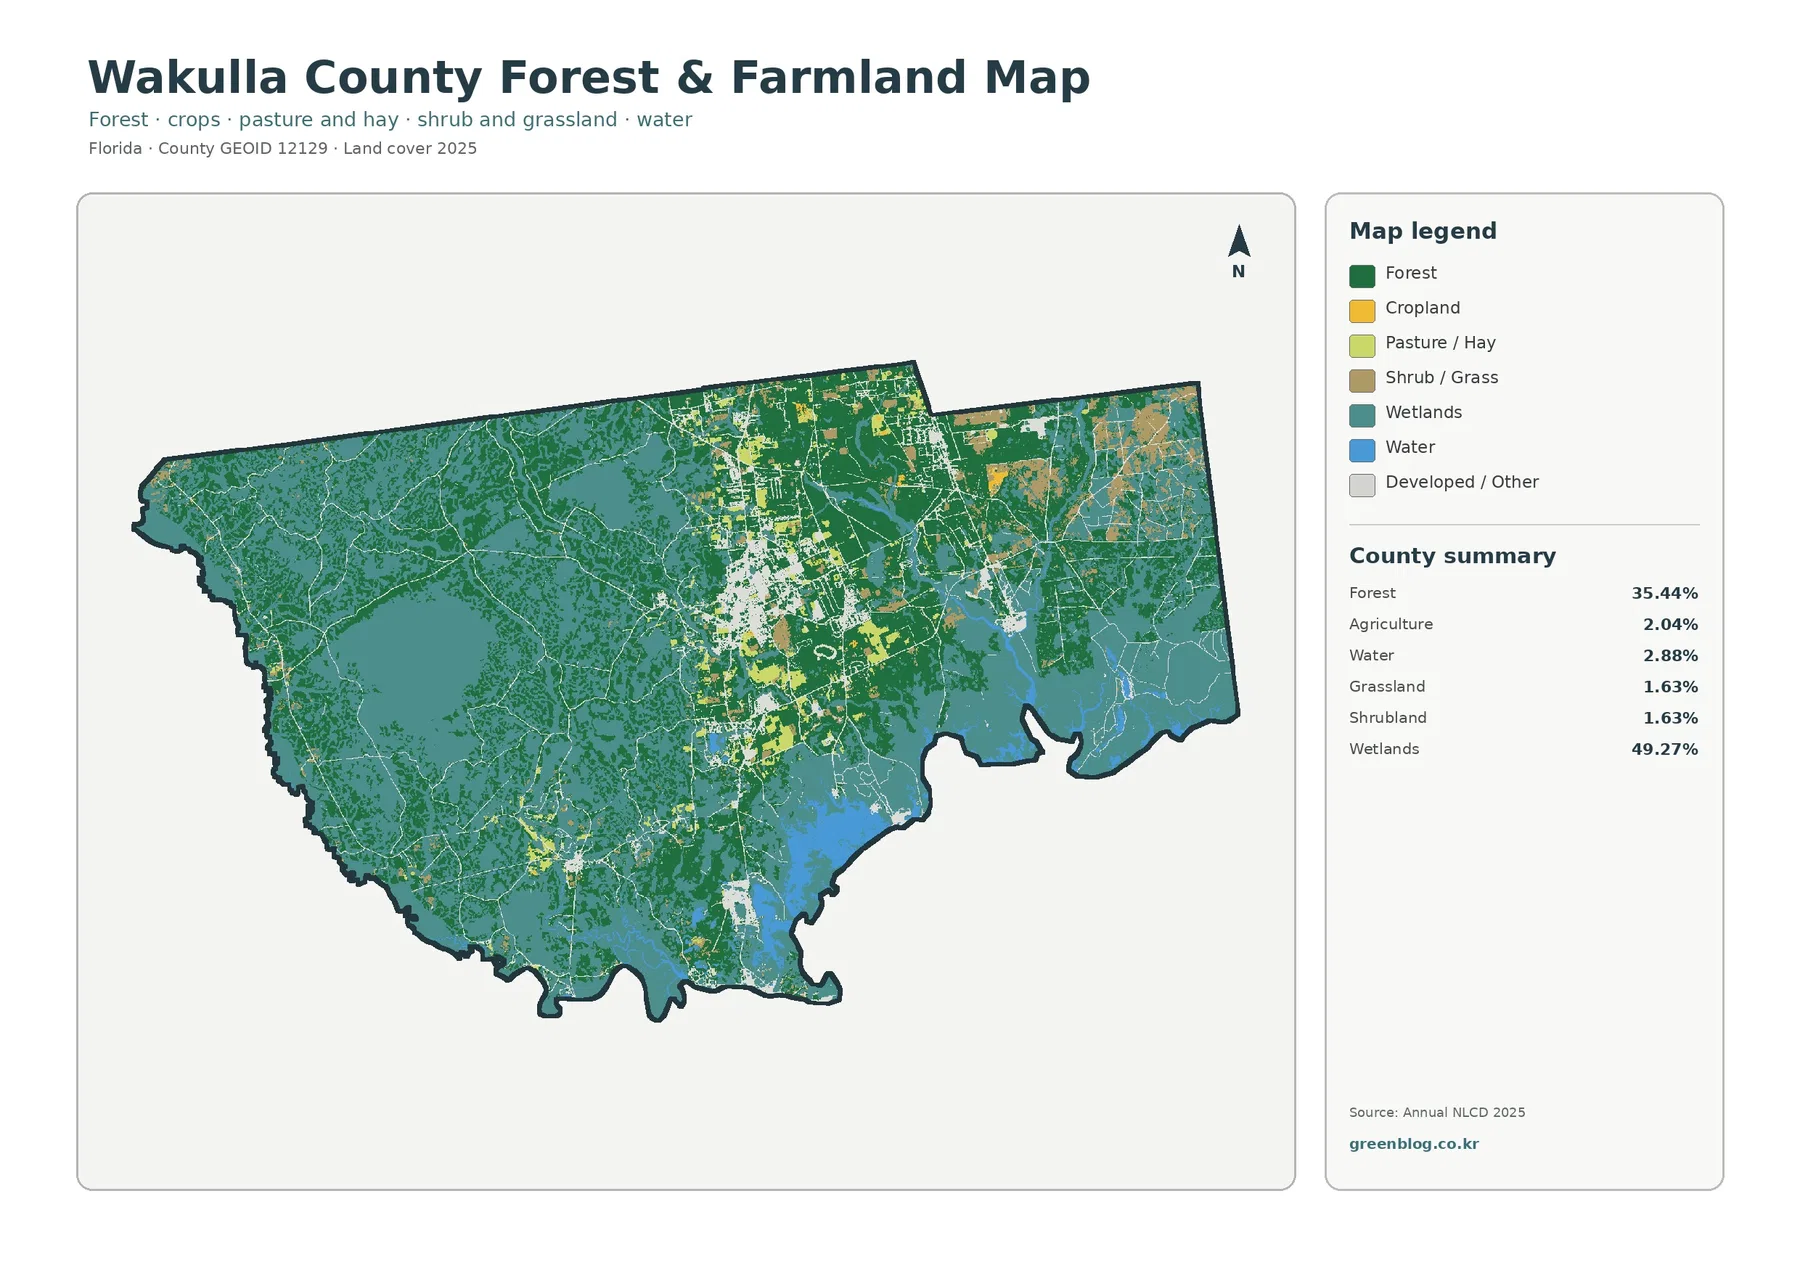
Once most developed land is faded into the background, the extent of forest and wetlands becomes even clearer. Cropland and pasture or hay appear in small blocks near the central and northeastern portions of the county. Agriculture totals only 2.04%, so working land is a minor countywide class. Its value in this map is not its size but its location within a much larger wet and forested landscape.
The legend separates cropland from pasture or hay, but the supplied summary provides a single verified agriculture value. The map can show where the two agricultural colors occur, yet it does not support inventing exact percentages for each subtype by counting pixels. The correct use is to compare their positions and relative visual presence while retaining 2.04% as the verified agriculture total.
UF/IFAS Extension Wakulla County identifies agriculture and natural resources among its local program areas and provides research-based information for residents. That context fits a county where small agricultural areas exist within extensive natural cover. The Extension material does not identify the crop, owner, or management practice associated with an individual land-cover cell, so those details require separate local records.
The same caution applies to forest. A dark green cell means tree cover is the representative mapped surface at that location. It does not identify public ownership, a protected forest, a timber operation, or a management designation. The 35.44% forest share is useful for county-scale comparison, while ownership and forestry management belong to different maps and records.
The 1985–2025 comparison shows a relatively limited 12.86% class difference
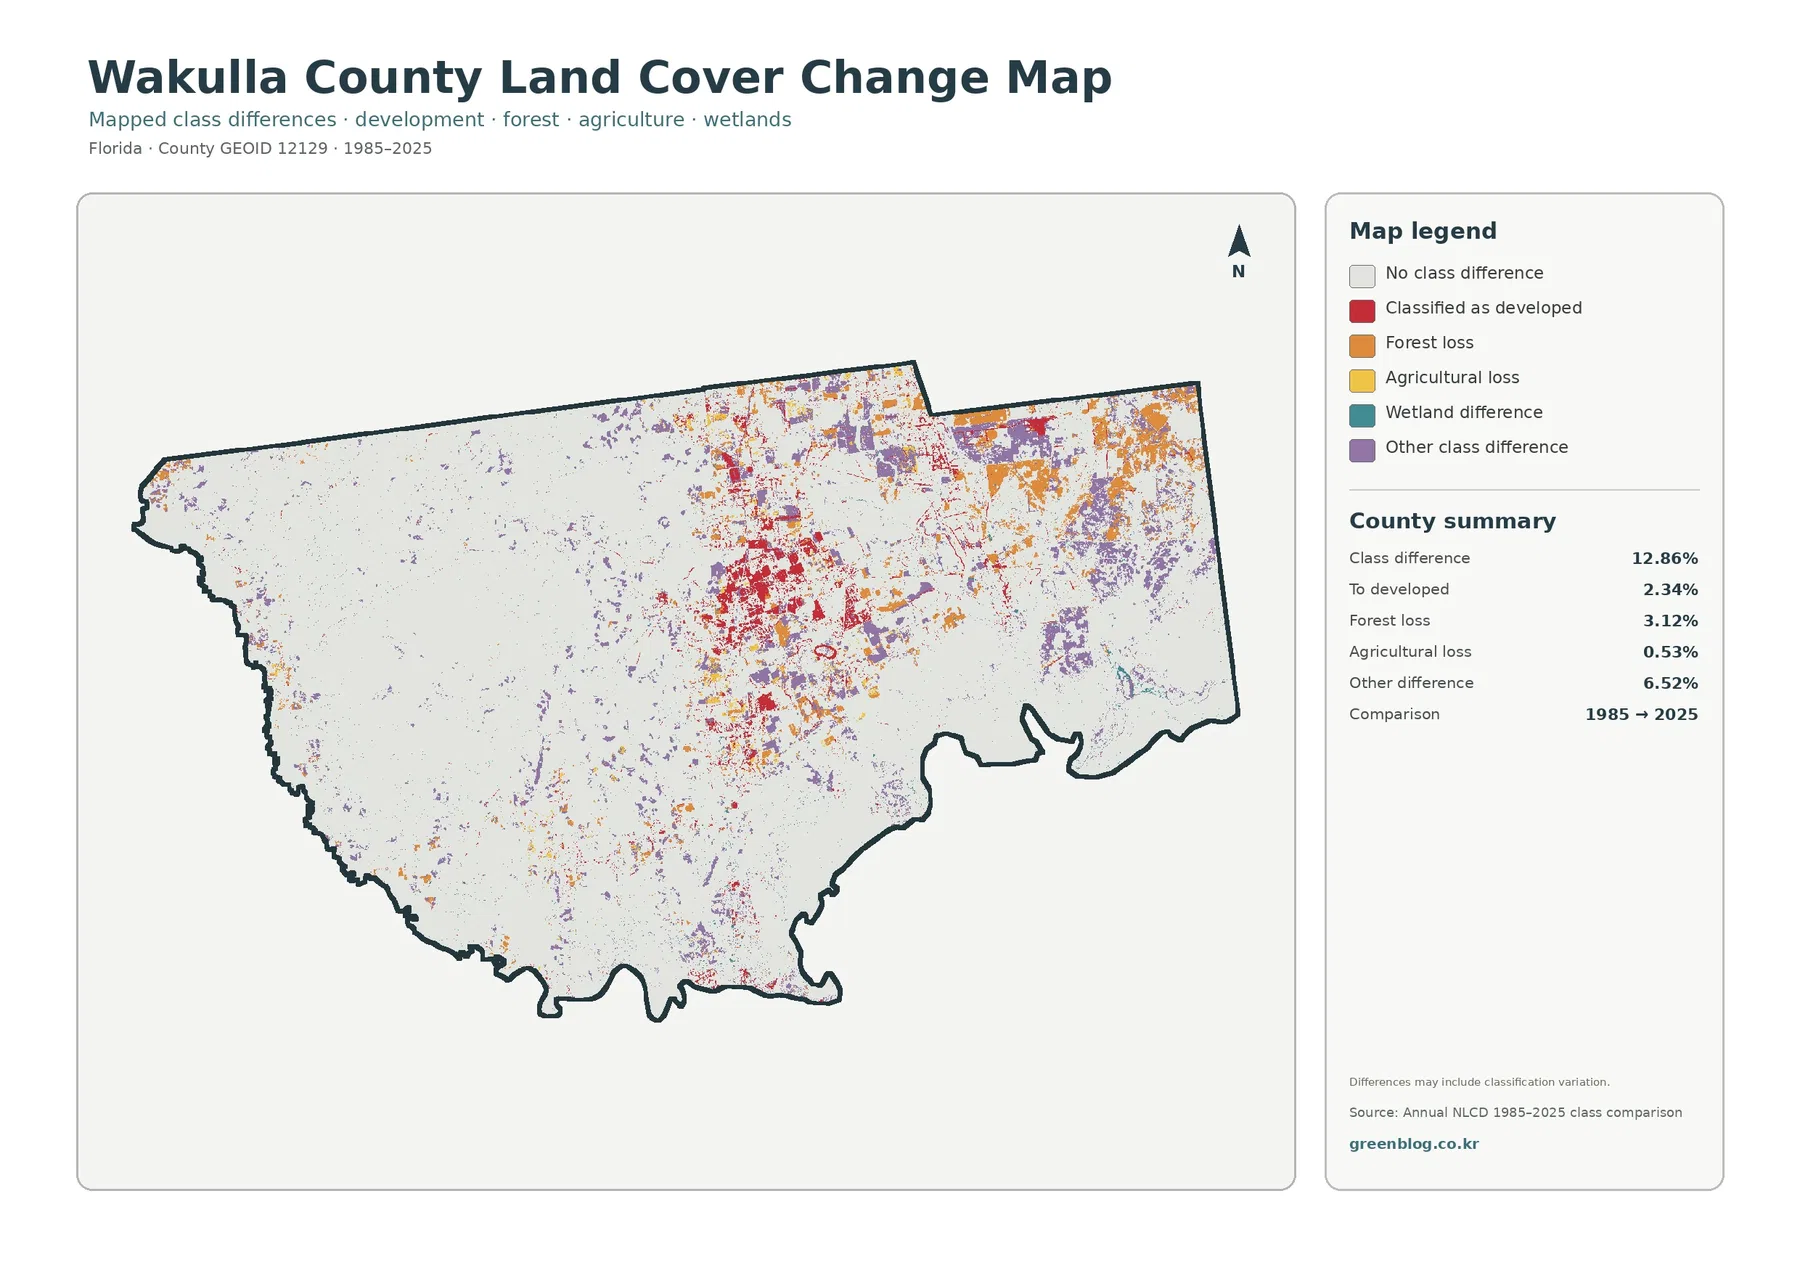
The total class difference between 1985 and 2025 is 12.86%. That value should not be rewritten as “12.86% of Wakulla County was physically transformed.” The map compares the class assigned to each raster cell at two endpoints. Real land-cover change can contribute, but imagery conditions, season, classification rules, and mixed cells may also affect whether a location receives the same label in both years.
Cells classified as developed account for 2.34% of the comparison. Red difference areas are most noticeable around the central developed zone, with additional marks in the northeast and south. That value is not the same as the current 6.92% developed cover. The current map answers where developed land is mapped in 2025; the change map answers where the two-date comparison falls into a developed-difference category.
Forest loss is listed at 3.12%, agricultural loss at 0.53%, and other class difference at 6.52%. Orange and purple cells are most visible through central and northeastern portions of the county, while the west shows fewer difference marks. Wetland difference is included in the legend but does not have a separate verified percentage in the summary. Its visible locations can be discussed, but an exact rate should not be estimated from the image.
Change colors that appear next to one another do not establish cause. A forest-loss cell beside a developed-category cell does not prove that development caused the forest difference. Land conversion, vegetation recovery, forestry activity, hydrologic conditions, storms, or classification variation may all contribute. Detailed cause-and-effect analysis requires intermediate imagery or additional local planning and land-use records.
Three comparisons help turn the legends into useful county information
The first comparison is wetland versus open water. Wetlands cover 49.27%, while water covers 2.88%. Blue open water is easy to recognize, but teal wetlands extend much farther across the county. Looking at both prevents the common mistake of assuming that only visible water bodies represent the county’s wet environment.
The second comparison is developed cover versus impervious surface. Developed land is 6.92%, but mean impervious cover is only 1.26% and the area at 50% or greater impervious cover is 0.24%. The difference shows that the developed class includes many permeable surfaces and that the hardest built surfaces are highly concentrated.
The third comparison is current forest versus forest-loss difference. Forest remains extensive at 35.44% in 2025, while 3.12% of the two-date comparison is classified as forest loss. Those values are not contradictory because they describe different questions. Current cover measures the 2025 surface, while the change category identifies cells whose classifications differ between the two dates.
Choose one map for the main question and add a second only when comparison helps
The 2025 overview is the strongest starting point for a county profile. It places wetlands, forest, development, water, and the small agricultural areas in one frame. A presentation can begin with the fact that wetlands and forest together exceed 84% of the county, then use the map to show where the compact developed core sits inside that much larger natural landscape.
For vegetation or working-land topics, the forest-and-farmland view is easier to read because it reduces the visual weight of developed land. The impervious map is the better choice for development intensity. The change map should usually come after the current maps, because its symbols mean “different between two dates” rather than “current land-cover class.”
When comparing Wakulla County with another Florida county, keep the observation year and classification system consistent. A 2025 value should not be compared casually with an older map without noting the date. The 1985–2025 comparison is also a two-date snapshot rather than an annual history, so intermediate changes are not shown.
Raster classification and JPG size limit parcel-level interpretation
Annual NLCD is raster data. The landscape is divided into grid cells, and each cell receives one representative class even though the real ground may contain trees, water, pavement, grass, buildings, and bare soil at the same time. The county map simplifies that mixture so broad patterns are easier to compare. Small wetland edges, forest boundaries, farm margins, roads, and drainage features should therefore be treated as generalized.
The original JPG files in this package are 2480×1754 pixels each. Enlarging them can make small patterns easier to see, but it does not create new source detail. The asset manifest does not mark the files as meeting the package’s A3 high-resolution reference. They remain useful for screens, presentations, ordinary handouts, and county-scale comparisons, while very large printing should be checked at the intended output size.
Frequently Asked Questions
What is the largest 2025 land-cover class in Wakulla County?
Wetlands are the largest class at 49.27%, followed by forest at 35.44%. Developed land is 6.92%, water 2.88%, agriculture 2.04%, grassland 1.63%, and shrubland 1.63%. Wetlands and forest together account for more than 84% of the supplied county summary.
Why is developed land 6.92% while mean impervious cover is only 1.26%?
Developed land can include yards, trees, grass, and other permeable ground together with roads and buildings. Impervious cover isolates hard surfaces such as rooftops, pavement, and parking areas. Only 0.24% of the county is mapped at 50% or greater impervious surface, showing that very hard surfaces are highly concentrated.
Does the 12.86% class difference equal the area that physically changed?
No. The 12.86% value is the share of cells classified differently in the 1985 and 2025 comparison. Listed components include 2.34% to developed, 3.12% forest loss, 0.53% agricultural loss, and 6.52% other difference. Classification variation may be included, so specific causes require additional evidence.
Sources and Reference Data
- MRLC Annual NLCD Data – annual land-cover data used for the 2025 and two-date comparison views.
- USGS Annual NLCD Land Cover Classification – definitions for wetland, forest, developed, agricultural, and other mapped classes.
- U.S. Census Bureau TIGER/Line Shapefiles – official county-boundary reference for Wakulla County.
- UF/IFAS Extension Wakulla County – official local agriculture and natural-resource education.
- U.S. Fish & Wildlife Service – St. Marks National Wildlife Refuge – official coastal-marsh, tidal-creek, and estuary context for a refuge that includes Wakulla County.
Map File Information
This ZIP contains the four original JPG maps used to compare 2025 land cover and related themes across Wakulla County.
- Included Files: Use only the versions confirmed in the article and supplied images
- File Type: Use the confirmed download contents
- Intended Use: Printing, education, presentations, and map-based projects
Related Maps
- Alachua County Florida Land Cover Map
- Baker County Florida Land Cover Map
- Bay County Florida Land Cover Map
Green Map creates custom-edited map images using open geographic data sources such as geoBoundaries, Natural Earth, OpenStreetMap, and government open data.
These maps are edited visual materials, not raw data files, and are provided for education, documents, presentations, and graphic reference.