The Walton County Florida Land Cover Map shows a county with several distinct landscapes rather than one uniform surface. Forest is the largest 2025 class at 38.19%, followed by wetlands at 22.68%. Other major classes include developed land at 8.86%, grassland at 8.53%, water at 7.83%, agriculture at 7.42%, and shrubland at 5.31%. The northern interior contains a dense mixture of forest, farms, grass, and wetlands, while the southern part of the county is shaped by a large bay, coastal water, and a much stronger developed strip.
This page includes four related views: the 2025 land-cover overview, a forest-and-farmland map, an impervious-surface map, and a 1985–2025 class-difference map. The WebP images are used for on-page comparison, and the four original JPG files are available together in one ZIP download below. The set is useful for classroom lessons, county profiles, presentations, and comparisons of inland forest and farming with the more developed southern coast.
Table of Contents
The southern bay and coastal strip make Walton County different from its northern interior
One of the clearest county-specific features is the large body of water in the south. Walton County’s official Coastal Dune Lakes map identifies Choctawhatchee Bay in this part of the county, with the Gulf coast and the narrow South Walton area farther south. On the land-cover map, that southern strip contains much more red developed cover than most of the northern interior, while wetlands and water remain close by.
County guidance notes 15 named coastal dune lakes along 26 miles of coastline. These lakes have intermittent connections with the Gulf of Mexico, and their water conditions can vary with rainfall, tides, groundwater, and outfall openings. That official local information helps explain why the southern coast is environmentally distinctive. The land-cover map itself does not label individual dune lakes, so a blue or teal cell should not be assigned to a named lake without a separate reference map.
Open water accounts for 7.83% of the county summary, while wetlands make up 22.68%. Those values should remain separate. Blue cells show open water, including the large southern water area and smaller inland features. Teal cells represent wetland cover, which can include saturated ground and wetland vegetation without appearing as open water. The difference is especially useful in a coastal county where water and wet ground are both important but are not the same class.
The 2025 overview is led by forest but broken up by farms, grassland, and wetlands
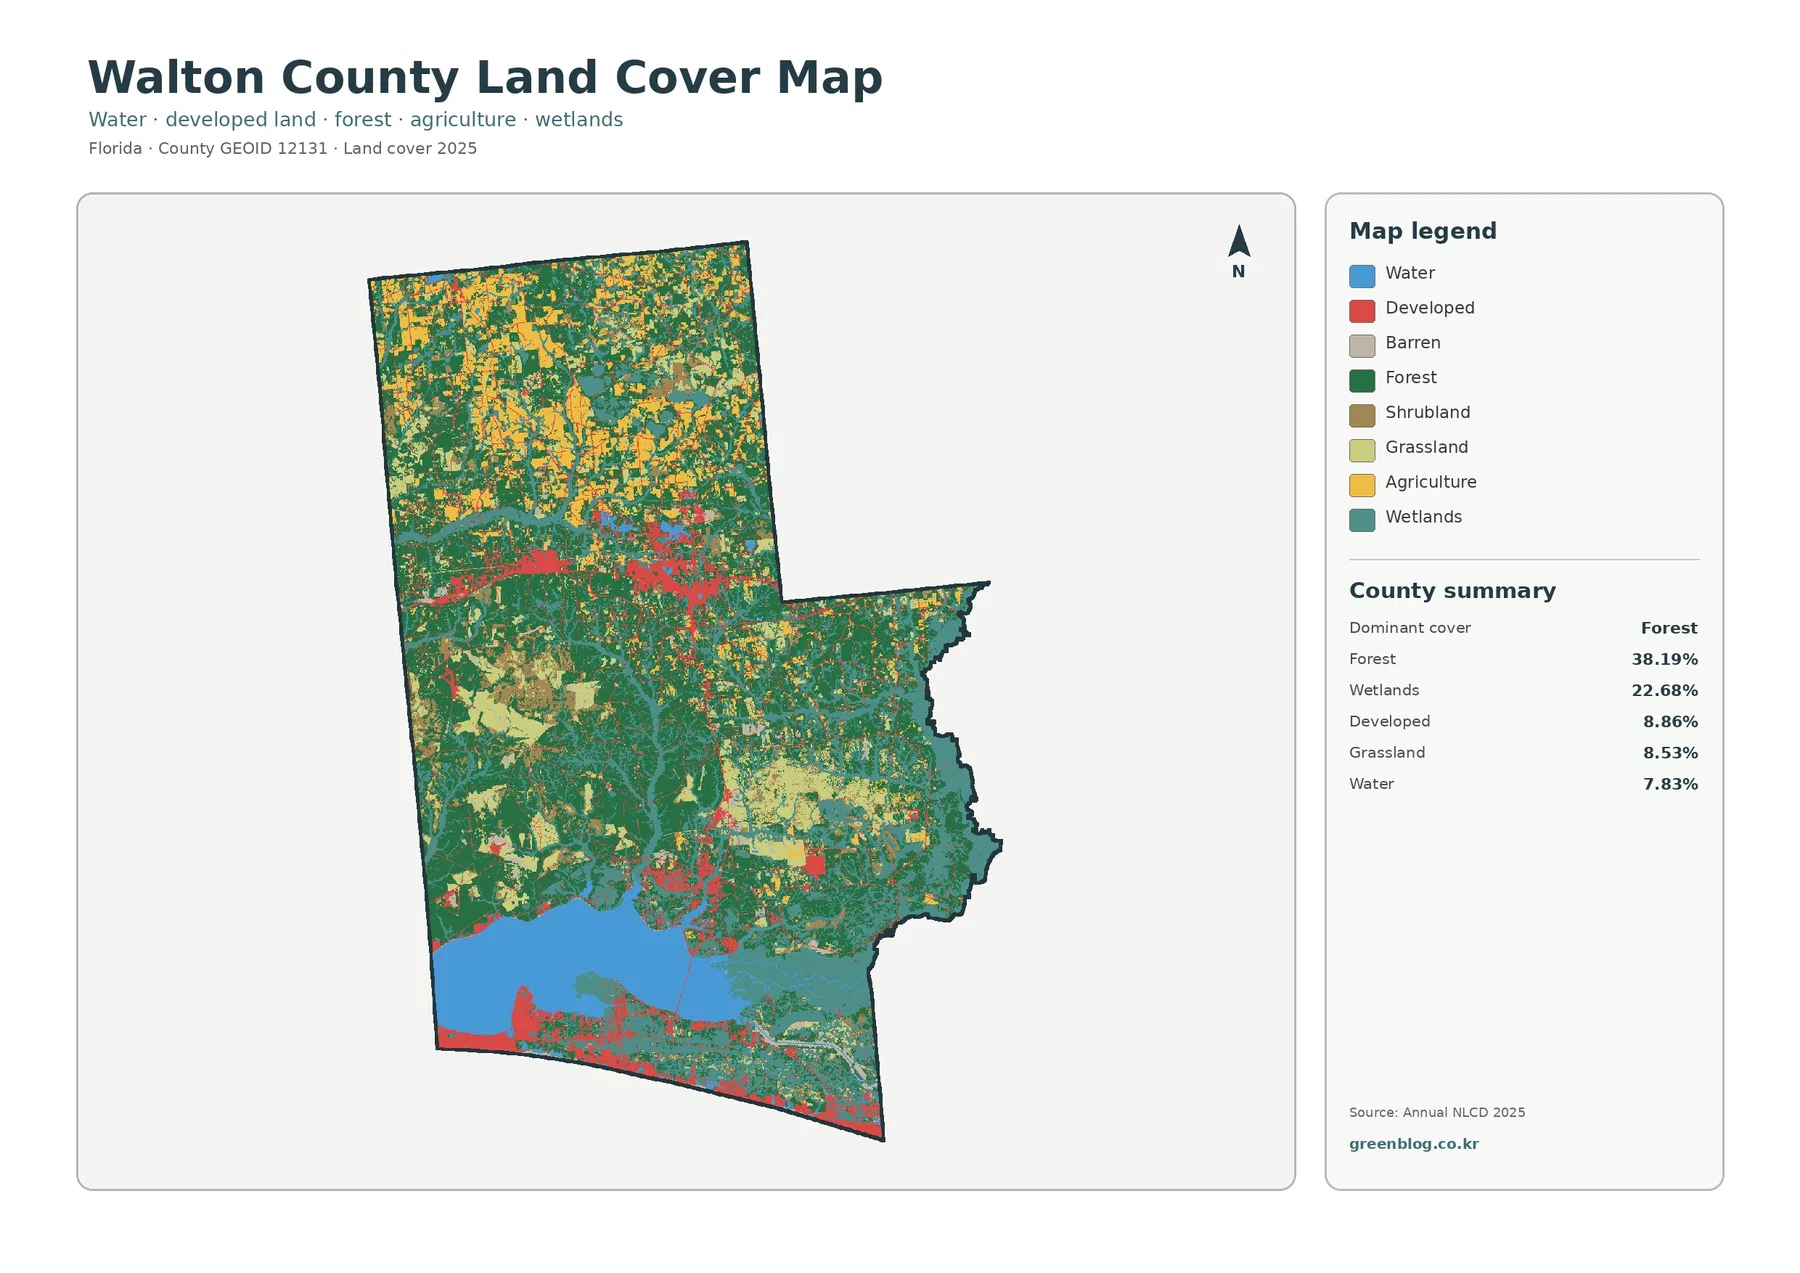
At 38.19%, forest is the dominant class. Dark green covers large portions of the north, center, and east, but the forest is not one continuous block. Yellow agricultural areas, light green grassland, shrubland, wetlands, and smaller developed places interrupt it throughout the northern interior. Taken together, those colors show a mixed working and wooded landscape rather than a county divided into one forest region and one farm region.
Accounting for 22.68%, wetlands are the second-largest class. They appear among northern forest blocks, through the central part of the county, and around the southern bay and coastal landscape. Their widespread distribution matters more than any single large wetland area. A reader looking only at the coast would miss how often wetland cover also appears inland between forest, grassland, and farm areas.
At 8.86%, the developed class is smaller than forest or wetlands. A noticeable developed band appears across the central-western part of the map, with additional clusters farther south and a much more continuous developed strip near the coast. Small developed areas also occur in the north. These red cells are a land-cover classification, not municipal boundaries or zoning. They identify places where developed surfaces are the representative mapped cover.
Grassland at 8.53% is almost as large as developed land. Agriculture adds 7.42% and shrubland 5.31%. All three are most useful when viewed as part of the northern interior mixture. Their colors recur among forest and wetlands, so even the more rural portion of Walton County does not reduce to one simple land-cover type.
The forest-and-farmland view reveals a northern patchwork of working land and woodland
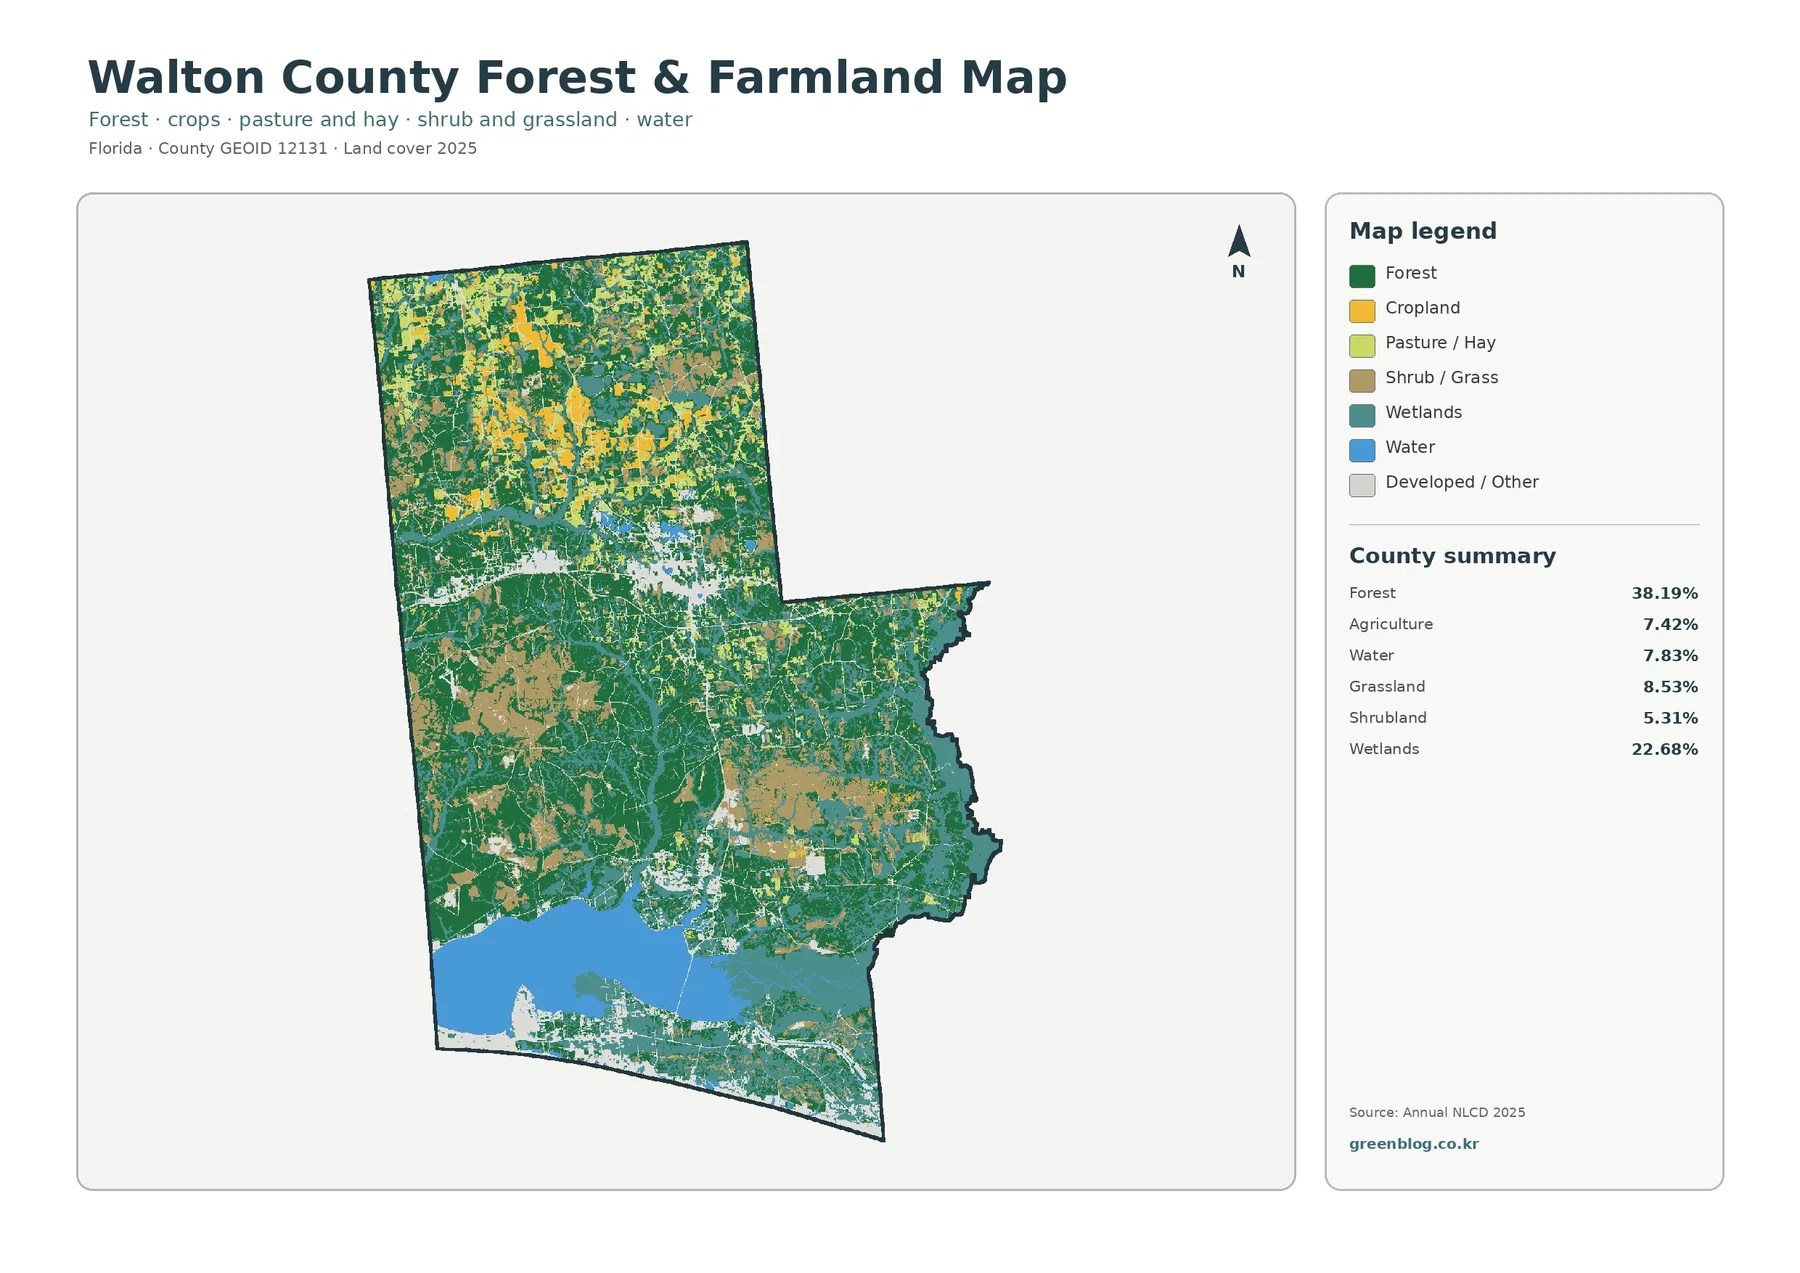
With most developed land faded into the background, the agricultural structure becomes much easier to see. Cropland and pasture or hay appear repeatedly across the north, often surrounded by forest. Some agricultural areas are relatively large, while many are smaller and separated by wooded or wet surfaces. Farther south, agricultural colors are less common and water, wetlands, forest, and developed or other surfaces take a larger role.
The map summary gives an agriculture total of 7.42%. The focused map separates cropland from pasture or hay visually, but it does not provide a verified percentage for each subtype. The image is therefore best used to compare locations and shapes rather than to estimate a new cropland or pasture share from the pixels.
Local UF/IFAS Extension guidance describes most Walton County farms as small farms and provides support for crop production, farm ponds, pastures, and livestock. That county-specific source gives useful context to the agricultural colors visible across the northern interior. It does not identify what is grown in an individual land-cover cell, who owns a farm, or how a particular field is managed.
Its forestry program also focuses on private forest management, agroforestry, and tree care in Walton County. That local program is relevant in a county where forest is the largest mapped class. Still, a dark green cell does not identify ownership, a conservation designation, or a specific forestry practice. It only indicates that forest is the representative land-cover class at that location.
Hard surfaces are concentrated in the central developed areas and along the coast
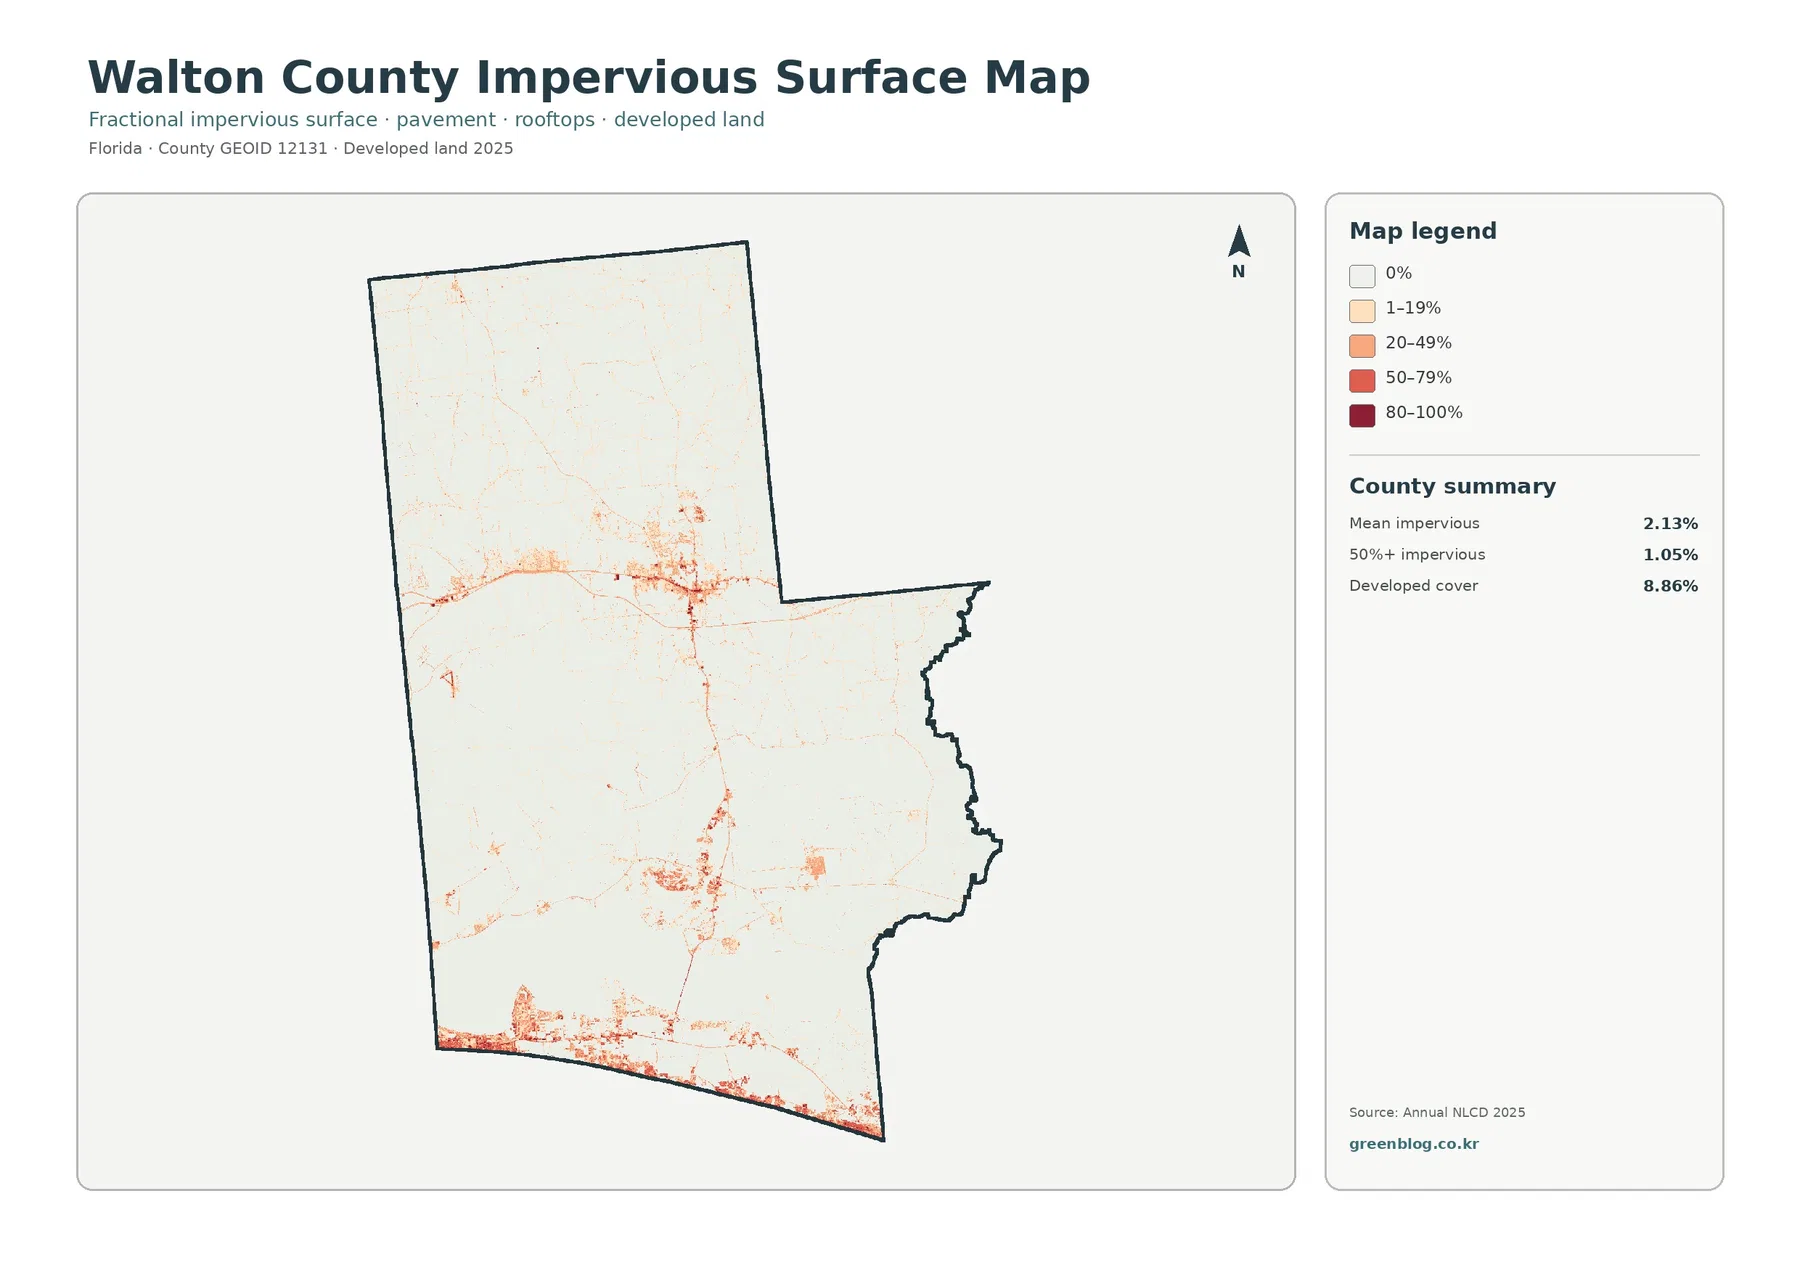
Across the county, mean impervious cover is 2.13%, and 1.05% of the area is mapped at 50% or greater impervious surface. Both figures are much lower than the 8.86% developed-land share. That broader developed category can contain yards, trees, bare ground, and landscaped areas together with roads and buildings. Impervious cover isolates the fraction occupied by hard surfaces such as rooftops, pavement, and parking areas.
The strongest orange and red values appear along the southern coastal strip and in several central developed locations. Thin linear traces connect smaller clusters, while most of the northern forest-and-farm landscape remains pale. This contrast shows that Walton County has important developed areas while hard surfaces occupy a much smaller share than the broader developed classification might suggest.
Narrow high-impervious lines may resemble roads, but this layer is not a transportation map. It does not provide route names, traffic volumes, lane counts, or pavement condition. A low impervious value also should not be used as a flood-risk indicator. Wetlands, soil, terrain, drainage, bay and coastal conditions, rainfall, and other factors affect water movement independently of the impervious percentage.
Using the developed and impervious maps together is especially helpful in the south. The general map shows a long developed coastal footprint, while the impervious map reveals where the hardest surfaces are actually concentrated within that footprint. This prevents every developed cell from being described as fully paved or densely urbanized.
The 1985–2025 comparison reports a 31.15% class difference
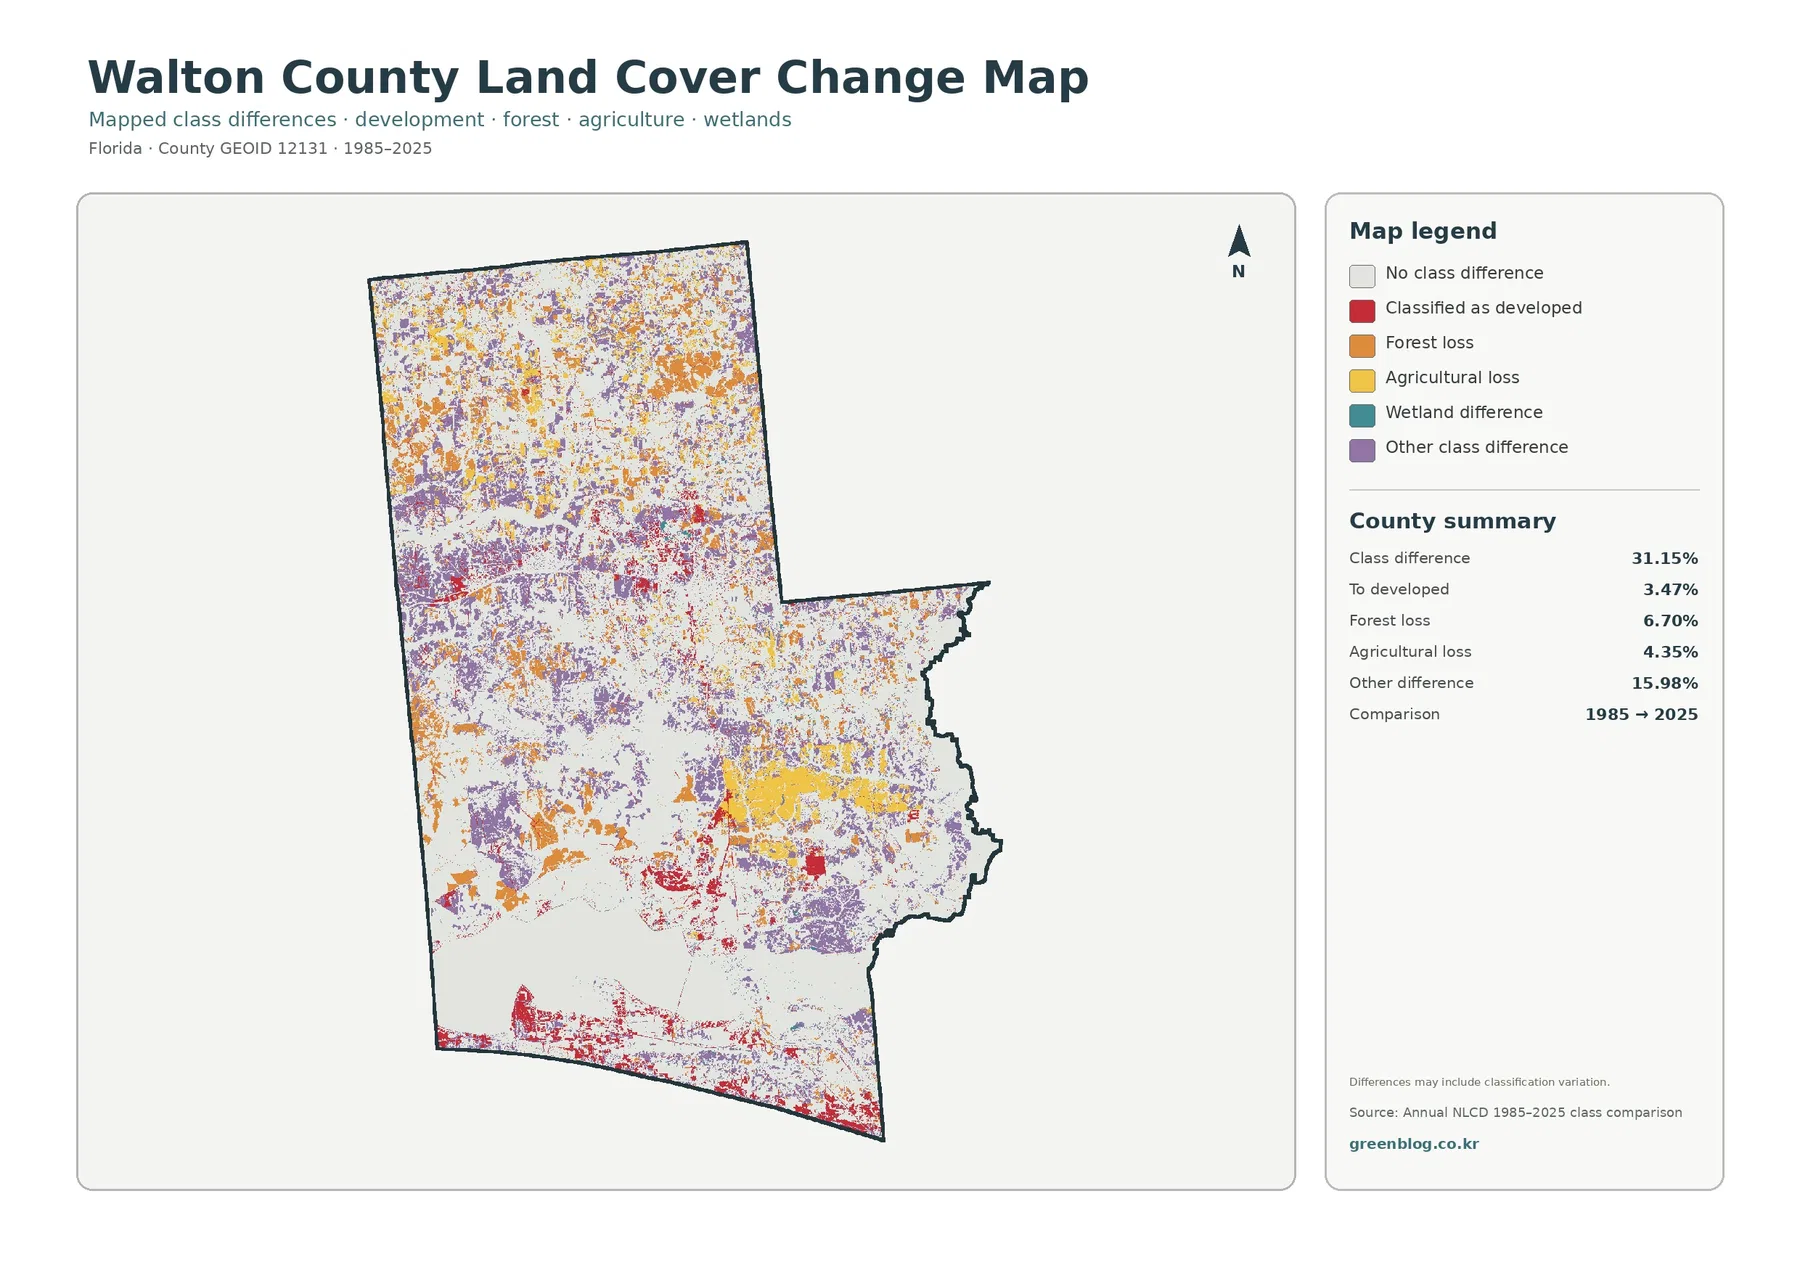
The total class difference between 1985 and 2025 is 31.15%. That number should not be rewritten as “31.15% of Walton County was physically transformed.” The map compares the class assigned to each raster cell at two endpoints. Real land-cover change can contribute, but imagery conditions, season, classification rules, and mixed cells can also affect whether a location receives the same label in both years.
Other class difference is the largest listed component at 15.98%. Purple cells are scattered widely across the northern interior, central areas, and parts of the south. At 6.70%, forest loss appears as orange areas across many northern and central locations. Agricultural loss is 4.35% and is visible through several of the areas that currently contain farmland or mixed rural cover.
The “to developed” component is 3.47%. Red difference cells are especially visible in the central developed areas and along the southern coast, with smaller marks in the north. This value is not the same as the current 8.86% developed cover. The current map describes where developed land exists in 2025; the change map identifies cells placed in a developed-difference category between the two dates.
Wetland difference is included in the legend but does not have a separate verified percentage in the county summary. Its visible locations can be discussed, but a new percentage should not be estimated from colored pixels. The same caution applies to cause: forest-loss, agricultural-loss, and developed-difference colors show classification outcomes, not why a change happened.
Current cover and two-date difference should be read as separate layers of evidence
Forest remains the largest current class at 38.19%, even though forest loss is listed at 6.70% in the comparison. Those values are not contradictory. One describes the 2025 surface, and the other describes a category of difference between two dates. A county can still have extensive forest while many individual cells differ from their 1985 classifications.
Agriculture needs the same two-layer reading: current agricultural cover is 7.42%, while agricultural loss is 4.35% in the two-date comparison. The two numbers cannot be added or subtracted to reconstruct a precise 1985 agriculture percentage. The change map is not a complete year-by-year accounting of gains and losses; it is an endpoint comparison.
The southern coast provides another useful cross-map comparison. Current developed cover, higher impervious values, and developed-category differences all appear in nearby areas. That overlap confirms that development-related surfaces matter there, but it does not establish the cause or timing of every mapped difference. Planning records, permits, and intermediate imagery would be needed for that level of analysis.
Map File Information
This ZIP contains the four original JPG maps used to compare 2025 land cover and related themes across Walton County.
- Included Files: General land cover / forest and farmland / impervious surface / 1985–2025 class comparison
- File Type: ZIP containing four JPG maps
- Intended Use: Printing, education, presentations, and map-based projects
Related Maps
Land cover is not zoning, ownership, or a parcel survey
Land cover describes what physically covers the ground as classified from remotely sensed imagery. A forest cell does not identify public ownership or conservation status, an agricultural cell is not an agricultural zoning designation, and a developed cell does not establish development rights. Those legal and property questions require current parcel, planning, zoning, and regulatory records.
Annual NLCD is raster data, meaning the landscape is divided into grid cells and each cell receives a representative class. A real cell can contain trees, grass, crops, pavement, buildings, water, and bare soil at the same time. At county scale, the raster layer simplifies that mixture so the broad patterns remain visible. Small forest edges, farm boundaries, wetland margins, roads, and coastal features should therefore be treated as generalized rather than survey-accurate.
The four downloadable JPG files are 2480×1754 pixels each. Enlarging them can make small patterns easier to see, but it cannot create new source detail. They are well suited to screens, presentations, ordinary handouts, and county-scale comparisons; very large prints should be checked at the intended output size.
Frequently Asked Questions
What is the largest 2025 land-cover class in Walton County?
Forest is the largest class at 38.19%, followed by wetlands at 22.68%. Developed land is 8.86%, grassland 8.53%, water 7.83%, agriculture 7.42%, and shrubland 5.31%. The northern interior is highly mixed, while the southern bay and coastal strip have a much stronger water-and-development presence.
Why is developed land 8.86% while mean impervious cover is only 2.13%?
Developed land can include yards, trees, grass, landscaped ground, and other permeable surfaces together with roads and buildings. Impervious cover isolates hard surfaces such as rooftops, pavement, and parking areas. Only 1.05% of the county is mapped at 50% or greater impervious surface.
What does the 31.15% class difference mean on the 1985–2025 map?
It is the share of cells classified differently at the two endpoints, not a direct measurement of physical transformation. The listed components include 3.47% to developed, 6.70% forest loss, 4.35% agricultural loss, and 15.98% other difference. Classification variation may be included, so specific causes require additional evidence.
Sources and Reference Data
- MRLC Annual NLCD Data – Collection 1.2 adds 2025 and covers 1985–2025 for the conterminous United States.
- USGS Annual NLCD Land Cover Classification – definitions for forest, wetland, agricultural, developed, and other mapped classes.
- U.S. Census Bureau TIGER/Line Shapefiles – official county-boundary reference for Walton County.
- Coastal Dune Lakes – Walton County – official county information about the coastal dune lakes and South Walton coast.
- Agriculture in Walton County – UF/IFAS Extension – local small-farm, pasture, livestock, and farm-pond information.
Annual NLCD 1985–2025 Coverage
- MRLC Annual NLCD Data – Collection 1.2 adds the 2025 product year and covers 1985–2025 for CONUS.
- USGS Annual NLCD Data Access – official access routes for Annual NLCD science products beginning in 1985.
- MRLC Annual NLCD Project – definitions for land cover, land-cover change, fractional impervious surface, and related products.
Green Map creates custom-edited map images using open geographic data sources such as geoBoundaries, Natural Earth, OpenStreetMap, and government open data.
These maps are edited visual materials, not raw data files, and are provided for education, documents, presentations, and graphic reference.