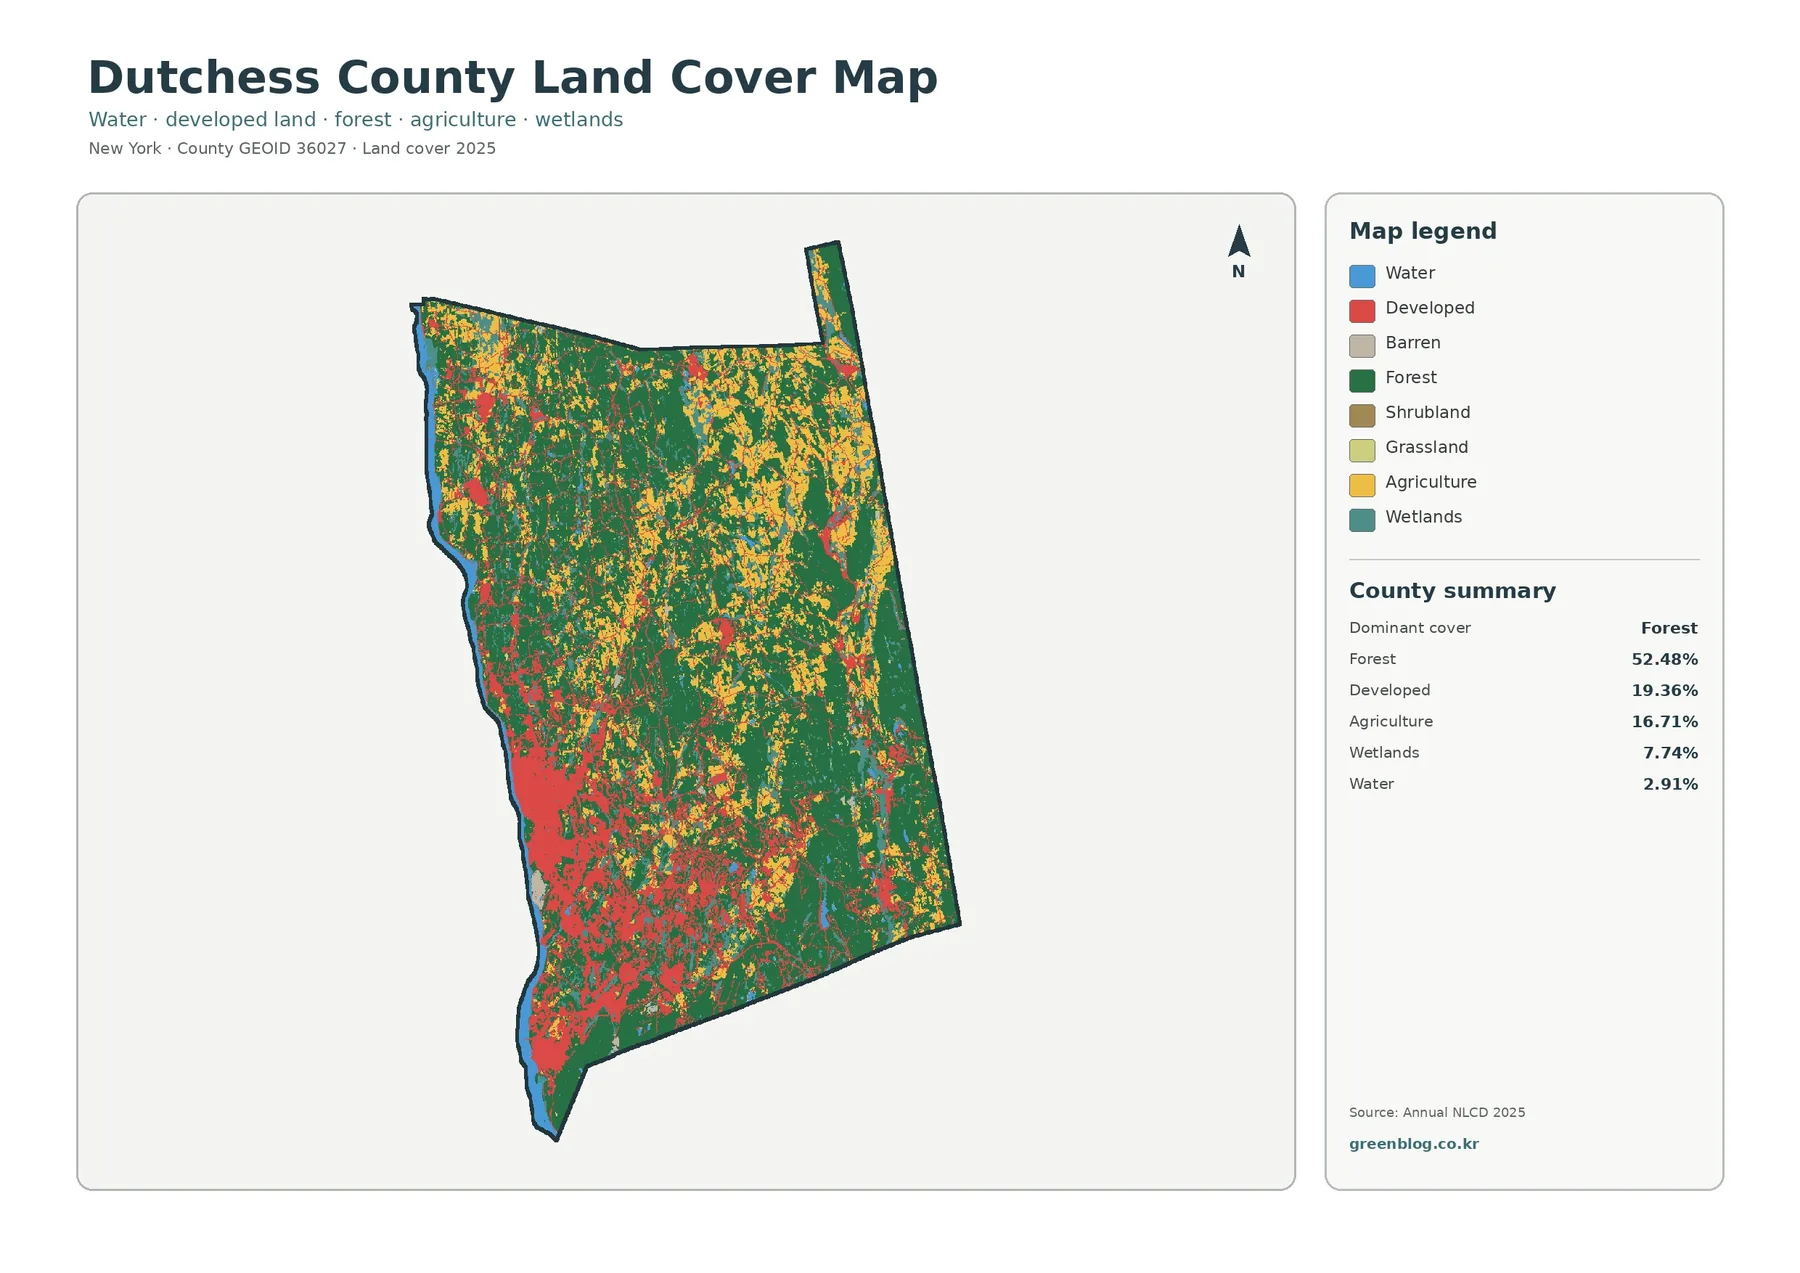
Dutchess County shows a strong contrast between the developed Hudson River side of the county and the more wooded, agricultural interior to the east. In the 2025 land-cover summary, forest is the largest class at 52.48%, followed by developed land at 19.36% and agriculture at 16.71%. Wetlands account for 7.74% and water for 2.91%. Four complementary maps extend that overview by separating forest and farmland, impervious surfaces, and mapped class differences between 1985 and 2025.
WebP images in the article provide quick on-page previews. For full-size use, the download box bundles four original JPG maps in one ZIP: general land cover, forest and farmland, impervious/developed land, and land-cover change. Using them side by side makes it easier to separate places that are simply classified as developed from places with a high concentration of pavement and rooftops, while also showing where forests, farms, wetlands, and mapped changes are concentrated.
Land cover describes what is physically on the ground, not what a parcel is legally zoned for or who owns it. A forest pixel represents mapped vegetation cover; a developed pixel represents a developed surface class. County-scale comparison, education, presentations, and environmental context are appropriate uses; parcel surveys and permitting decisions are not.
Table of Contents
A 2025 pattern split between the Hudson side and the eastern interior
Across the center and eastern side of Dutchess County, dark green forest dominates the general land-cover map. Agriculture appears in many yellow patches, especially through the northern and eastern interior, where farm areas repeatedly meet wooded ground. Along the western edge and into the southwest, the pattern changes noticeably. Developed cover is much more visible there, forming broader and denser clusters near the Hudson River side of the county and extending through the southern part of the map.
Development is not limited to one compact area. Smaller developed patches occur across the county, but their density changes sharply from place to place. In the southwest, developed cells form larger connected areas, while farther east they are more often surrounded by forest, agriculture, or wetlands. That contrast is especially useful because heavily settled landscapes and large rural or wooded areas appear within the same county boundary.
Wetlands make up 7.74% of the mapped cover and are visible as numerous patches, particularly where forest and agricultural land mix in the eastern and northeastern parts of the county. Water includes the long Hudson River edge and smaller inland water bodies. Looking at wetlands and water together with nearby forest, farms, and developed areas gives a better sense of the county’s surface pattern than percentages alone.
Forest and farmland form a broad rural mosaic
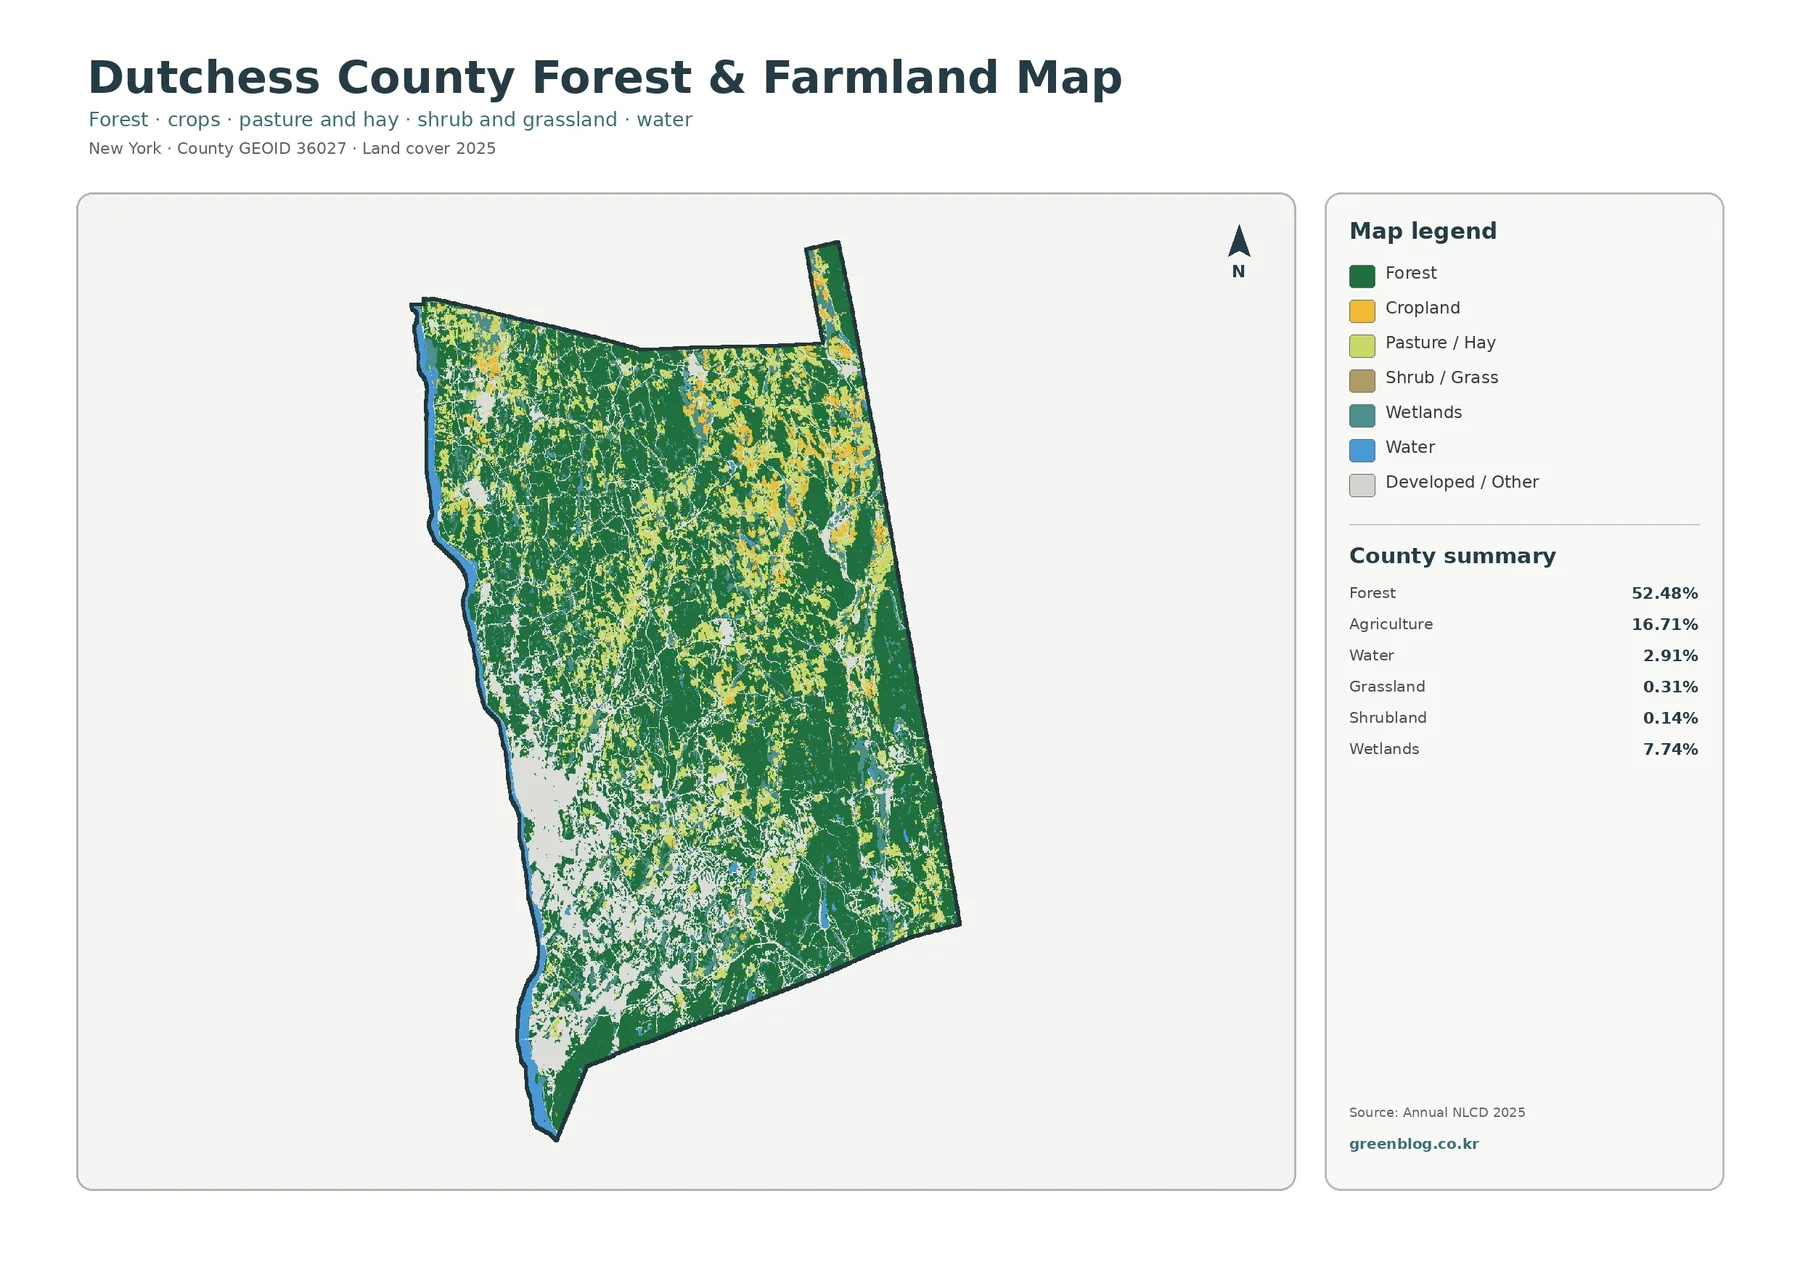
By reducing the visual weight of developed classes, the forest-and-farmland view makes the interior landscape easier to see. Forest covers 52.48% of the county, and large wooded areas occupy much of the central and eastern map. Agriculture accounts for 16.71%. Rather than forming one continuous farming district, agricultural cover appears in many separate areas between and beside forest.
This pattern is especially clear across the north and east, where cropland and pasture/hay occur in repeated patches. Some farming areas are broad, while others are narrow or broken up by forest and wetlands. Moving toward the southwest, the gray developed/other category becomes more prominent and the forest-farm pattern is increasingly fragmented. Such variation shows why a single countywide percentage can hide major local contrasts.
Reading the legend carefully matters here. Cropland, pasture/hay, shrub/grass, wetlands, and water are not interchangeable even when several of them look like open ground. Broad agricultural landscapes are easy to locate, but individual farm boundaries, crop types, and legal agricultural districts are beyond what this map can identify. Questions at that level require county parcel or agricultural records.
For a classroom or presentation, this version works well when the topic is the relationship between working land and forest. A reader can identify where agriculture is surrounded by woods, where wetlands interrupt those patterns, and where developed/other cover becomes dominant. It provides a cleaner rural-landscape view than the general map without implying that every light-colored area has the same use.
Impervious cover is concentrated most strongly in the southwest
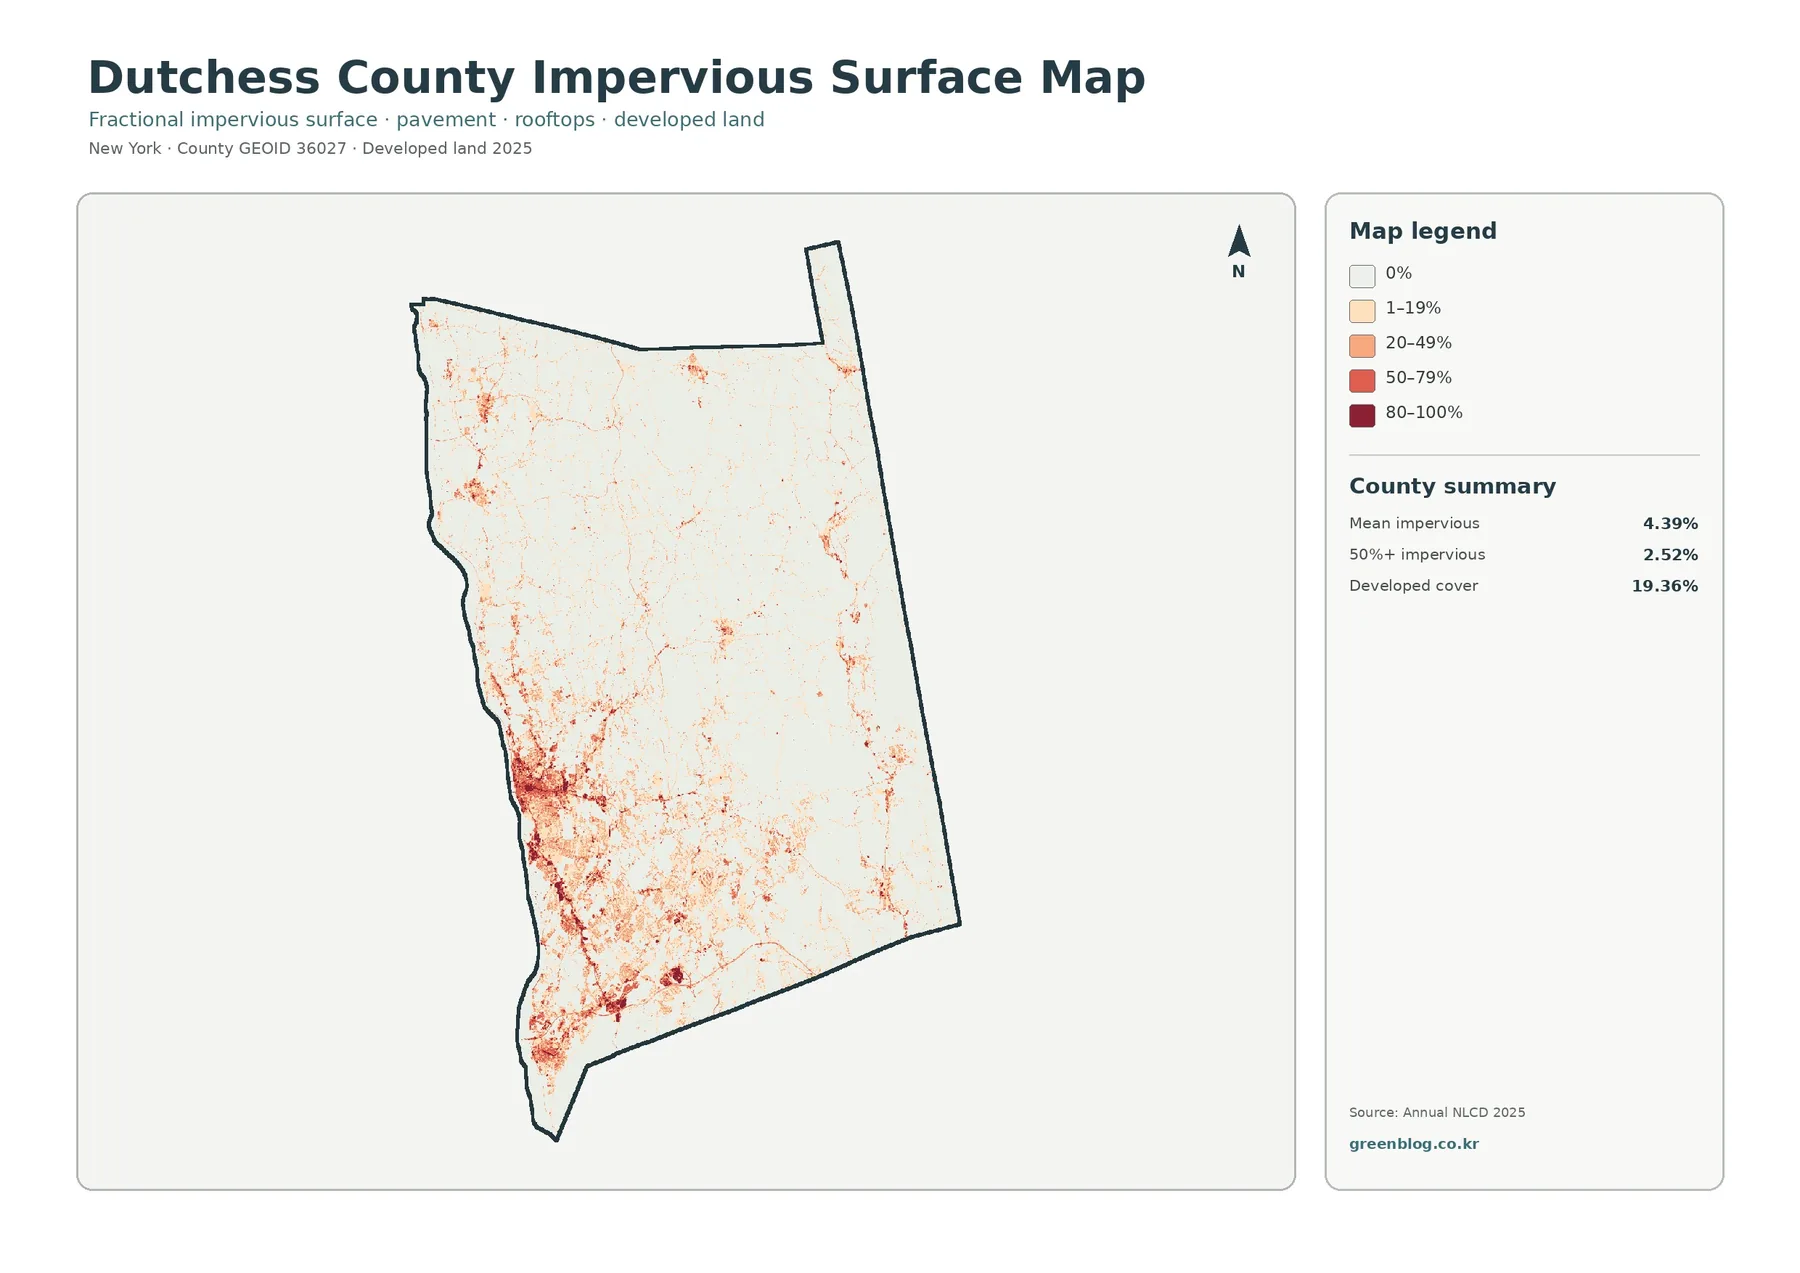
Impervious surface means hard surfaces that do not readily absorb rainfall, such as pavement, parking lots, and rooftops. Dutchess County has a mapped mean impervious value of 4.39%, while 2.52% of the county is in cells with 50% or greater impervious cover. Those numbers are much lower than the 19.36% developed-cover share because developed land can include lawns, trees, and other permeable surfaces around homes and businesses.
Southwestern Dutchess stands out immediately in the impervious-surface view. Darker impervious values form the largest concentration there, with additional clusters along the western side and through southern developed areas. Thin linear features also appear in many places, reflecting paved transportation corridors and other narrow hard surfaces. Farther north and east, smaller developed nodes appear with much less continuity than the southwestern pattern.
Comparing this image with the general land-cover map is particularly helpful. A place can be classified as developed without being mostly pavement. Low-density residential areas often contain substantial vegetation, while a road or parking area may have a high impervious fraction even though it occupies only a narrow strip. Using both maps prevents developed land and hard-surface intensity from being treated as the same thing.
Impervious cover can be useful background information for runoff or watershed discussions, but it does not by itself determine flood or water-quality risk. Slope, soils, drainage systems, rainfall, streams, and local site conditions also matter. Its strongest use is locating concentrations of hard surface and identifying places where more detailed environmental information may be needed.
Where the 1985 and 2025 classifications differ
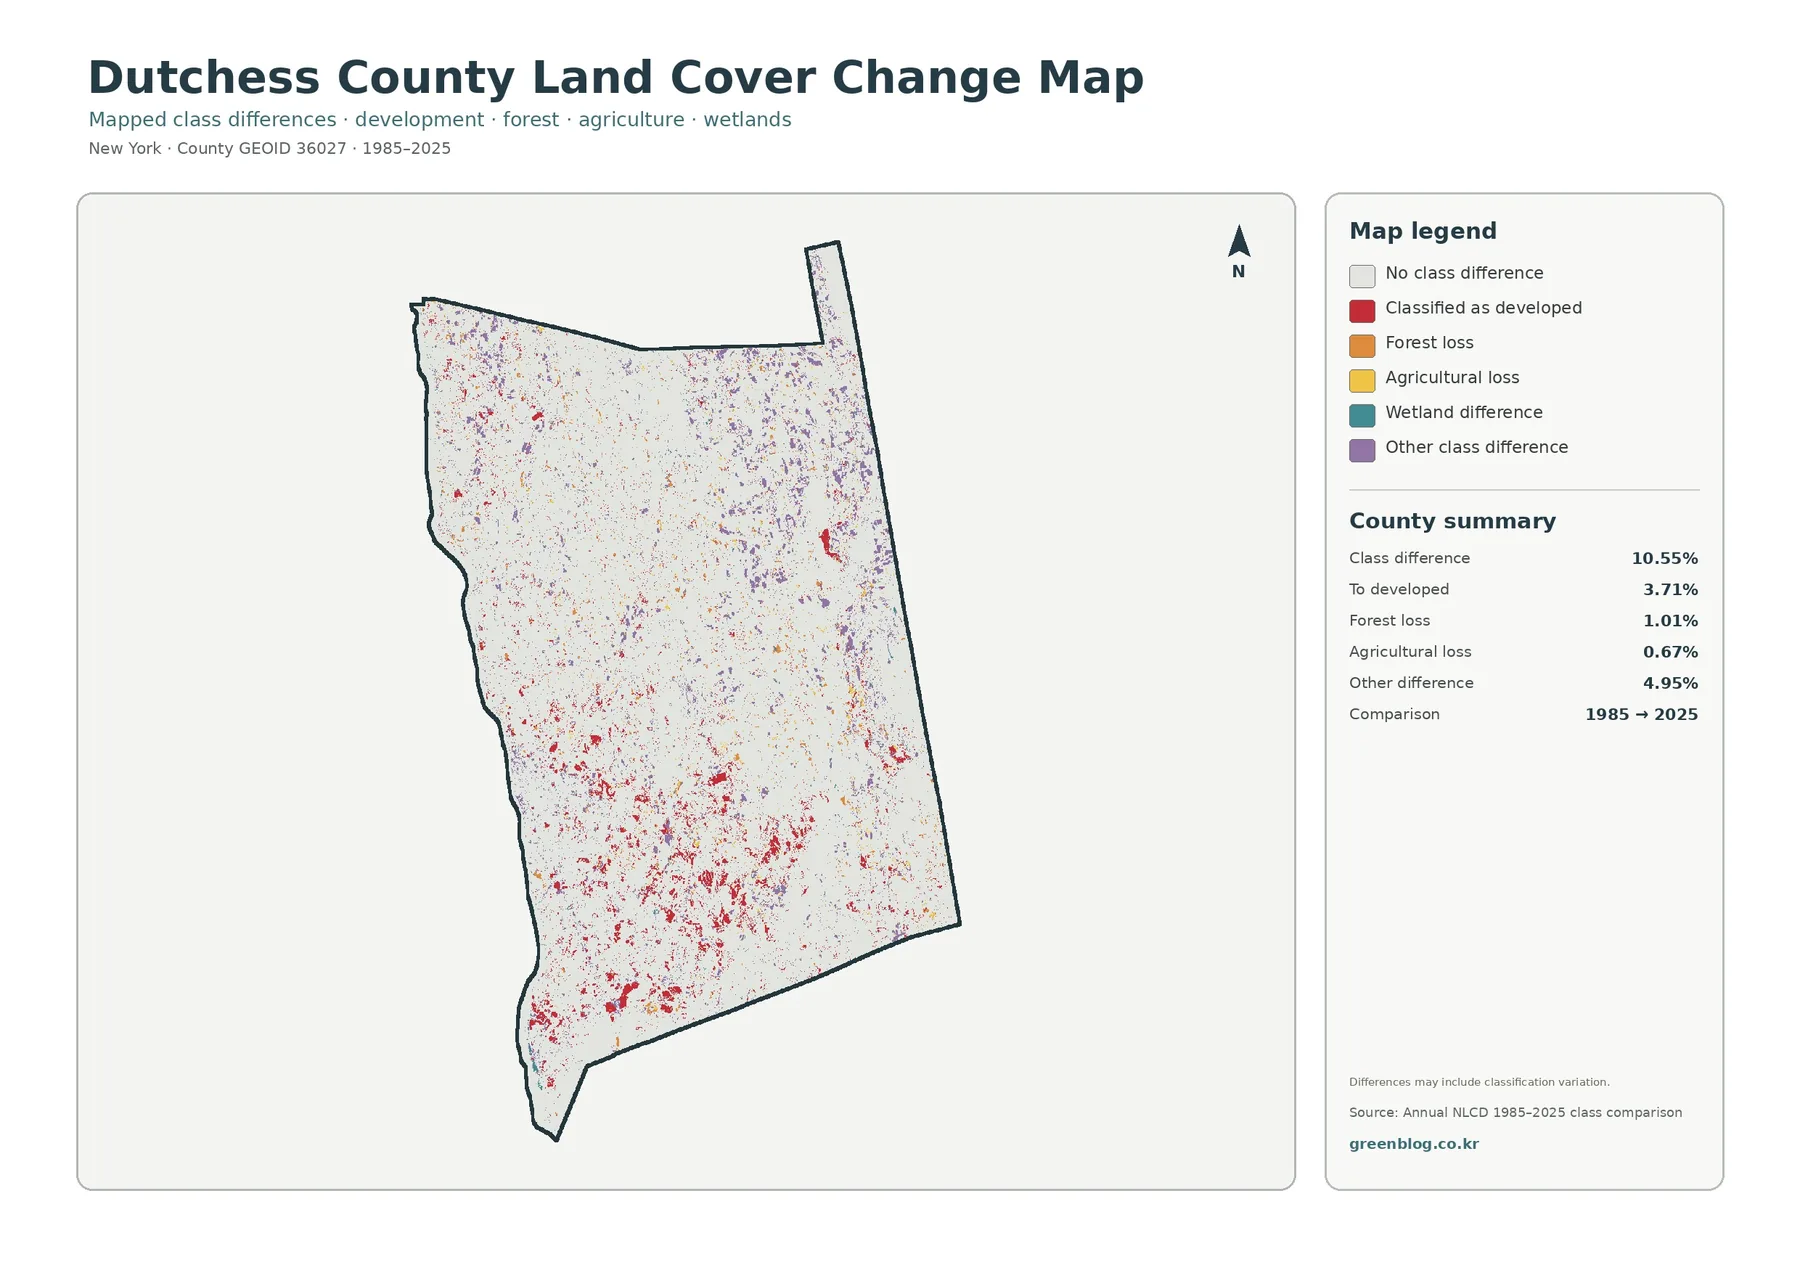
A separate change view compares the land-cover classifications mapped for 1985 and 2025. A total of 10.55% of mapped cells are shown as having a class difference. Within that total, the summary assigns 3.71% to developed, 1.01% to forest loss, 0.67% to agricultural loss, and 4.95% to other class difference. Because the figures compare two classification endpoints, they should not be treated as a precise measure of permanent land conversion for every year in the forty-year period.
Mapped differences are more noticeable across parts of the southwest and south-central county, including areas close to today’s stronger impervious pattern. Smaller change patches are scattered through the north and east. Taken as a whole, the pattern does not resemble one simple wave of change moving in a single direction. Instead, many local differences appear, some associated with development and others assigned to forest, agriculture, wetlands, or another broad class.
At 4.95%, the “other difference” category is a useful warning against overinterpreting the colors. Satellite image conditions, mixed pixels, classification methods, and real landscape changes can all contribute to a different class assignment at two dates. Treat a colored cell as a reason to investigate a location rather than proof of a specific cause.
For a site where change matters, use this graphic as a screening map. First find the cluster, then compare the same location on the 2025 general map and impervious map. Historical aerial photographs, county planning records, or other local GIS layers can then help determine whether the difference reflects development, vegetation change, agricultural change, or classification variation.
How to compare the four maps without mixing their meanings
A practical way to use the set is to begin with the general map and then move to the specialized view that answers the next question. Countywide contrast becomes clear on the general map: developed cover is strongest in the west and southwest, while forest and agriculture dominate much of the interior. Moving next to the forest-and-farmland image reduces development detail and makes the rural pattern easier to follow.
If the focus is urbanization, switch from the general map to impervious cover. That comparison shows which developed areas contain the greatest concentration of pavement and rooftops rather than simply labeling the whole area as developed. If the focus is long-term difference, use the change map last. It can show whether places that are developed today also contain clusters of cells classified differently in 1985.
Environmental topics benefit from the same comparison method. Wetland and water locations can be identified on the general map, then viewed alongside forest, agriculture, and hard-surface patterns. A sequence like this produces a clearer presentation than asking one map to answer every question. Comparing the same location across several views works well because each image emphasizes a different part of the landscape.
Useful applications for education, planning context, and environmental presentations
In a classroom, the maps can be used to teach legends, land-cover categories, and regional comparison. Students can compare the Hudson side with the eastern interior and describe how forest, farming, development, wetlands, and water are arranged differently. They can also select one location and explain why it appears differently on the land-cover and impervious maps.
Environmental presentations can connect wetlands and water with surrounding surface cover. Instead of stating only that wetlands occupy 7.74% of the county, a presenter can show whether a wetland cluster is bordered mostly by forest, agriculture, or developed land. When more detailed local natural-resource layers are needed, Dutchess County’s Environmental Mapper is a useful next step.
Working landscapes and conservation are easier to introduce with the forest-and-farmland view. For discussions of development, the impervious map helps explain why developed land is not identical to pavement. Historical imagery or planning documents become especially relevant in places highlighted by the change map. In each case, these graphics work best as overview maps that lead to more detailed sources.
Important limits before using the maps for a specific site
Raster land-cover data generalize the landscape. Narrow roads, small buildings, thin streams, field edges, and small wetlands may blend with nearby cover. A sharp color boundary on the map is not the same as a surveyed property boundary. Mixed pixels can also contain more than one surface type even though only one class is displayed.
Date is another important limitation to keep in mind. Because the current maps represent 2025 classifications, later construction, clearing, vegetation growth, agricultural rotation, or other changes may not appear. Using only the 1985 and 2025 endpoints also means intermediate changes or reversals are not all visible.
Most importantly, land cover is not zoning, ownership, parcel use, or a development approval. A forest-classified cell does not identify tree species or management condition, and a developed cell does not mean that additional development is permitted. Site-level decisions should use current county GIS, parcel records, field observations, and any relevant regulatory data.
Download the Dutchess County land-cover JPG set
Four downloadable JPGs match the topics shown in the article: general 2025 land cover, forest and farmland, impervious/developed land, and land-cover change from 1985 to 2025. For printing, presentation slides, class handouts, or side-by-side county comparisons, the original JPG set provides a cleaner working file. Choose the image that fits the question, or keep all four together when you need to explain both current conditions and mapped change.
Frequently Asked Questions
What is the largest land-cover class in Dutchess County?
Forest is the largest 2025 class at 52.48%. Developed land is 19.36%, agriculture is 16.71%, wetlands are 7.74%, and water is 2.91%. Mapped surface cover is what these values describe; they do not represent parcel-level legal land use.
Why is developed cover 19.36% while mean impervious surface is only 4.39%?
Developed classes can include lawns, trees, soil, and other permeable ground around buildings and roads. Impervious surface measures hard cover such as pavement and rooftops, so the countywide impervious average can be far lower than the total developed share.
Does every colored cell on the 1985–2025 map represent a confirmed real-world conversion?
No. A colored cell means the broad classification differs between the two mapped dates. Real development, forest change, or agricultural change may be involved, but mixed pixels and classification variation can also create differences. Important locations should be checked against other historical and local sources.
Map File Information
Dutchess County Land Cover Map Files
- Included Files: General land cover, forest & farmland, impervious/developed land, and land-cover change
- File Type: Four original JPG files in one ZIP archive
- Intended Use: Printing, education, presentations, and map-based comparison
Related Maps
- Albany County Land Cover Map
- Bronx County New York Land Cover Map
- Cattaraugus County New York Land Cover Map
Sources and references
- MRLC Annual NLCD Data — official access to Annual NLCD products and supporting data.
- USGS Annual NLCD Land Cover Classification — documentation for the land-cover classes used in Annual NLCD.
- Dutchess County Environmental Mapper — the county’s official mapping resource for its Natural Resources Inventory.
- Dutchess County: Conserve Your Land — county planning information on farmland, forests, wetlands, and other natural resources.
Green Map creates custom-edited map images using open geographic data sources such as geoBoundaries, Natural Earth, OpenStreetMap, and government open data.
These maps are edited visual materials, not raw data files, and are provided for education, documents, presentations, and graphic reference.