Agriculture covers 77.11% of Coles County in the supplied 2025 classification, but the county does not read as one uninterrupted farm sheet. Two large developed footprints occupy the south-central part of the map, while wooded bands become much more prominent east and southeast of them. This Coles County Illinois Land Cover Map set is useful for comparing that broad farm background with Charleston–Mattoon development, forested drainage terrain, hard surfaces, and mapped class differences.
The page includes four WebP views: current land cover, forest and farmland, impervious surface and developed land, and a 1985–2025 class comparison. The original 2480 × 1754-pixel JPG versions are bundled in one ZIP for county profiles, lessons, presentations, and side-by-side map work. Each view answers a different question, so the discussion below focuses on what becomes clearer when the layers are separated.
Table of Contents
Two city footprints interrupt an otherwise broad farm pattern
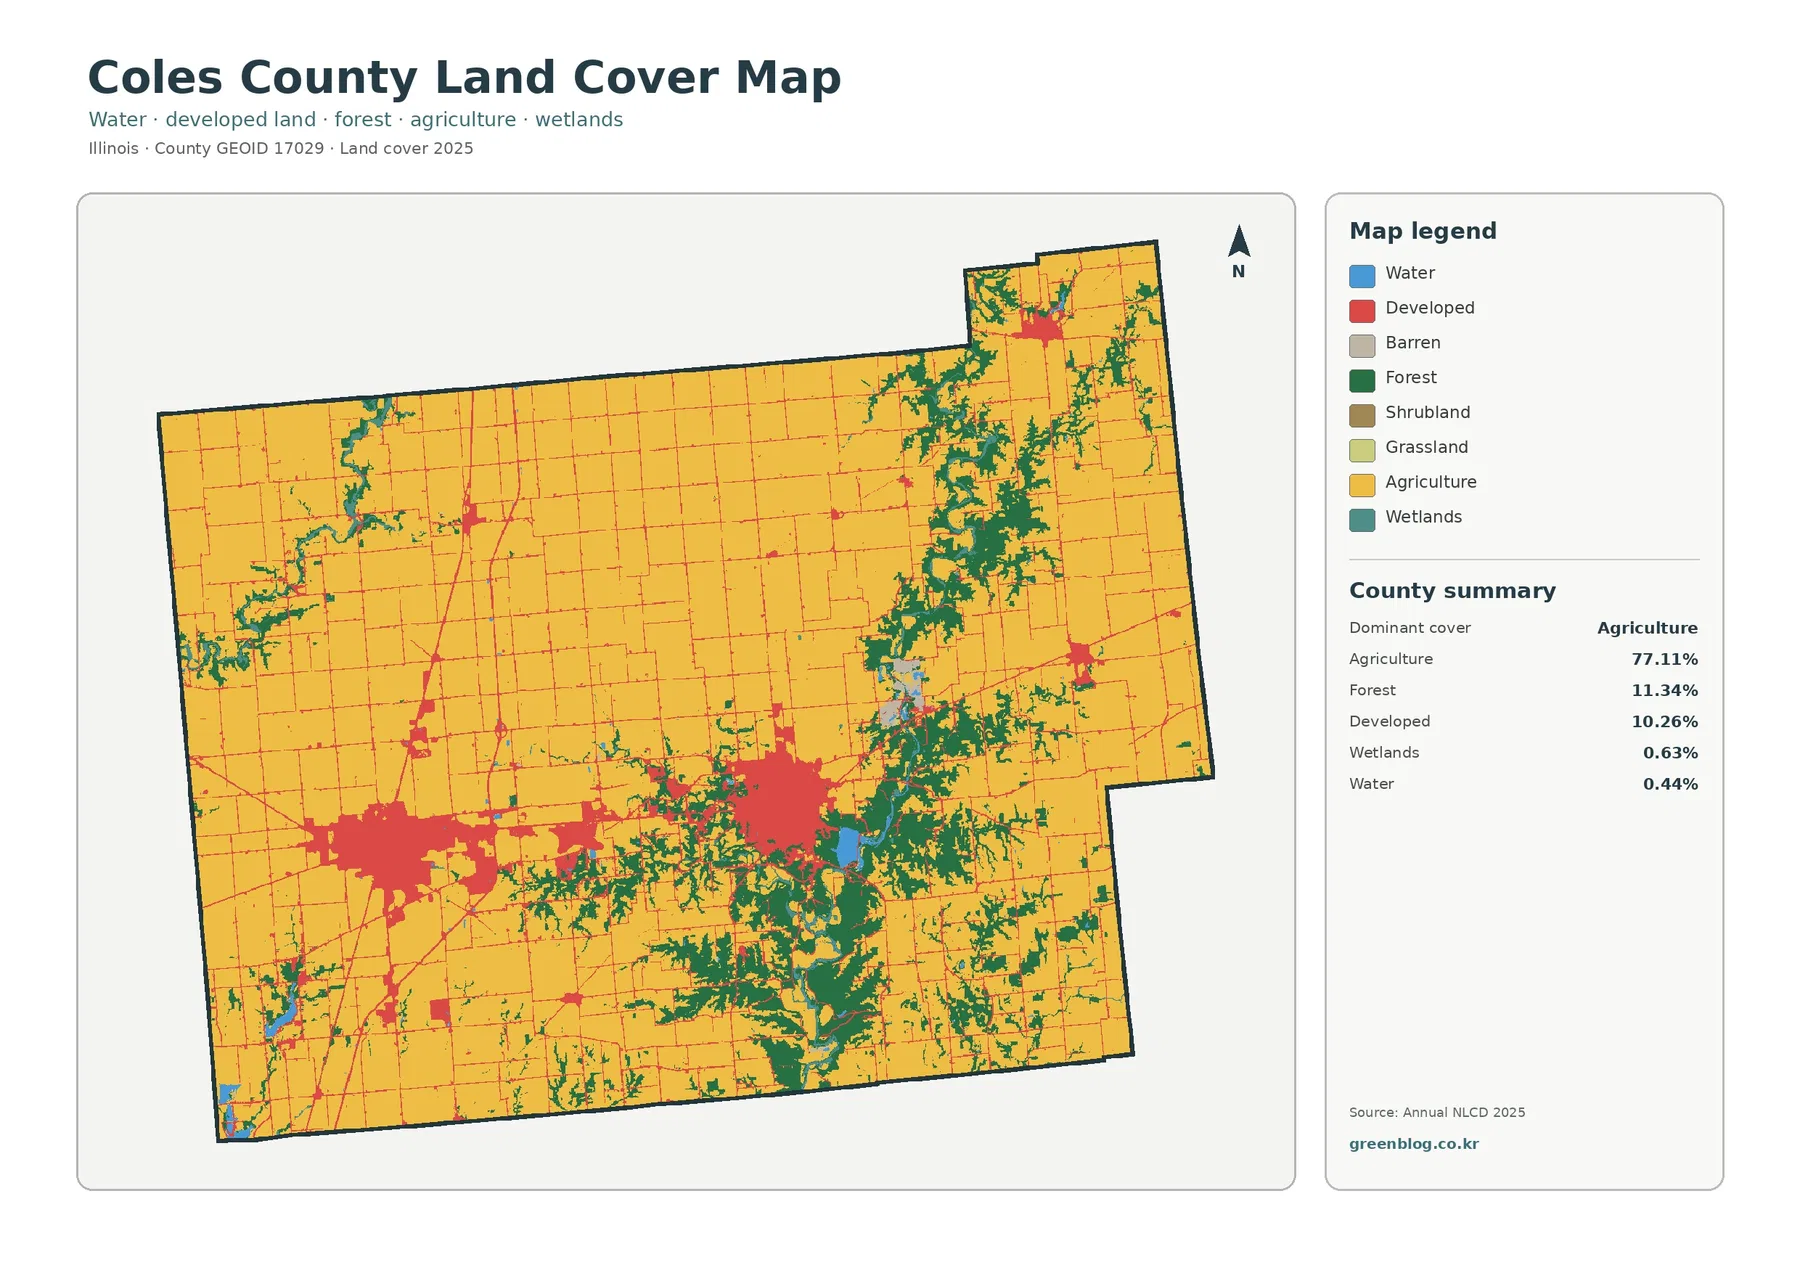
The county summary puts agriculture first at 77.11%, followed by forest at 11.34% and developed land at 10.26%. Wetlands account for 0.63% and open water for 0.44%. Those numbers describe a strongly agricultural county, yet the geography is not uniform. Large yellow field blocks cover most of the north, west, and interior, while two red developed areas occupy a substantial break in the farm pattern across the southern half.
The western developed concentration corresponds broadly to Mattoon, and the eastern concentration to Charleston. Coles County’s official website identifies both cities as important employment and business centers and notes State Route 16 between them. A narrow developed trace is visible between the two large clusters, but the land-cover graphic does not label roads or municipal boundaries. It is therefore safer to describe the visible connection as a developed corridor rather than assign every red cell to a named road or city limit.
Smaller developed knots appear near the northeastern extension and along the eastern side of the county. They matter because they show that built cover is not confined to the Charleston–Mattoon pair. Even so, the two larger footprints are the clearest interruption in the agricultural background. The map is a surface classification rather than a population map, so a larger red patch should not be treated as a direct measure of residents, jobs, commercial floor area, or tax base.
Land cover describes what is present on the ground surface as classified from remote-sensing data. It is not zoning, ownership, parcel geometry, or legal land use. A yellow agricultural cell does not identify a farm operator or crop, and a developed cell may contain lawns, trees, soil, and other permeable surfaces around buildings and roads. That distinction becomes especially important when the impervious layer is compared with the general map.
Wooded terrain becomes a defining feature southeast of Charleston
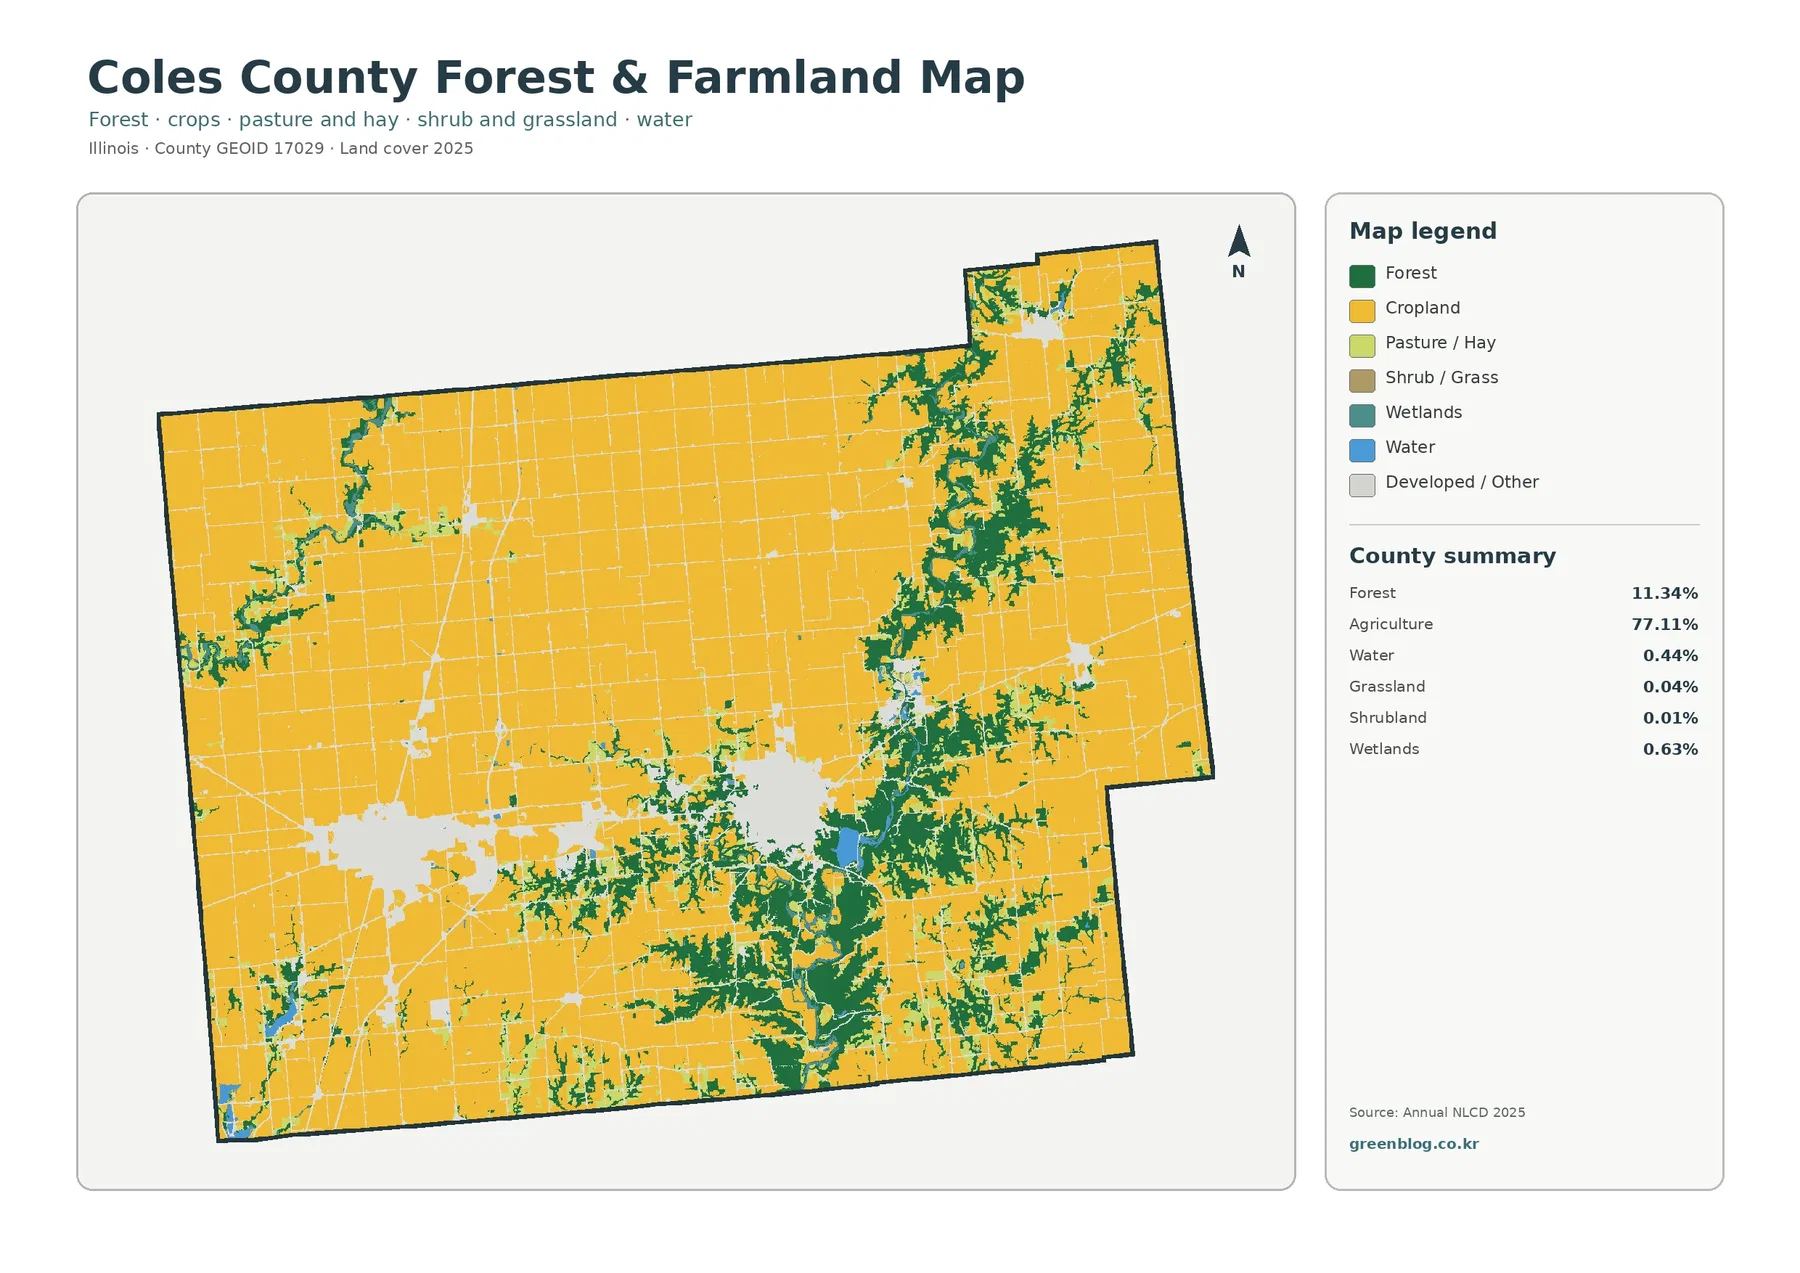
Removing the visual weight of developed cover makes the county’s 11.34% forest share much easier to understand. Forest does not spread evenly through the farm grid. The strongest green concentrations sit east and southeast of the two main urban areas, where long irregular bands branch through otherwise agricultural land. Smaller wooded strips also occur in the west and northwest, but they are generally narrower and more isolated than the southeastern network.
This pattern has a useful local reference point. Illinois Department of Natural Resources describes Fox Ridge State Park, just south of Charleston, as a landscape of steep wooded ridges, broad valleys, and forested bluffs along the Embarras River. Nearby protected lands also contain upland and floodplain forest. The supplied map does not draw the park boundary or label the river, but the concentration of green south and southeast of Charleston fits the broader wooded terrain described by those official resources.
The distinction is important because a countywide percentage can hide where a class actually occurs. Eleven percent forest scattered evenly across every township would look very different from eleven percent concentrated along one side of the county. Here, the concentration creates a clear transition from the rectangular field pattern into more irregular wooded shapes. That transition is one of the most county-specific features in the four-map set.
Open water is only 0.44% and wetlands 0.63%, so neither class occupies a large countywide share. Blue patches appear as small lakes or ponds, while wetland cells are limited and often sit near wooded or low-lying areas. Grassland is listed at 0.04% and shrubland at 0.01% in the focused summary. For practical description, agriculture, forest, and developed land account for nearly all of the visible 2025 pattern, with water and wetlands adding smaller local details.
Hard surfaces separate the urban cores from their lower-density edges
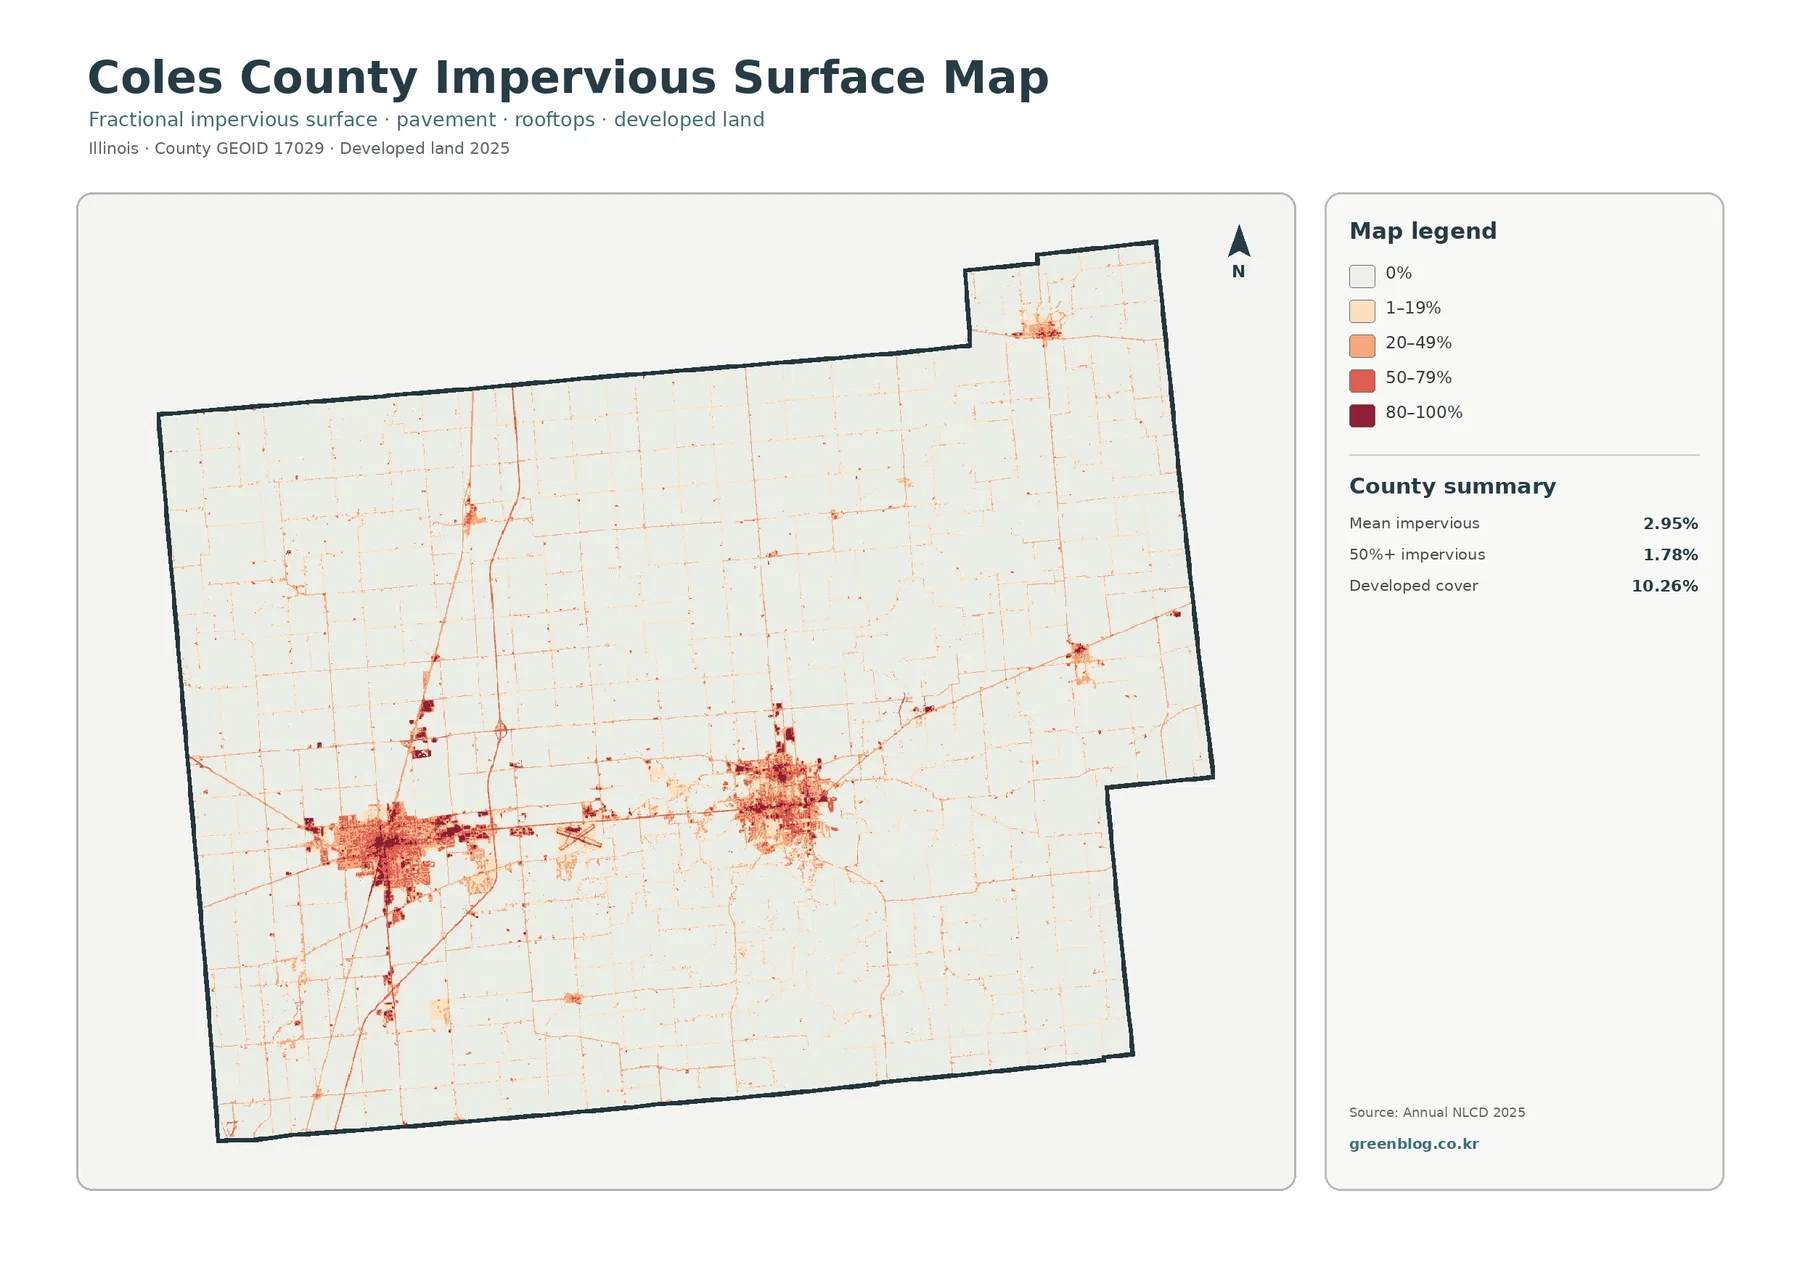
Mean impervious cover is 2.95% across Coles County, and 1.78% of the county is mapped at 50% impervious or greater. Both values are far below the 10.26% developed share. The difference is expected because developed land-cover classes can include lawns, trees, bare ground, and other surfaces that still absorb water. The impervious layer focuses more narrowly on roofs, pavement, parking lots, and similar hard materials.
Mattoon and Charleston stand out immediately as the darkest, most continuous clusters. Within those broad footprints, the map grades from lighter edges to more concentrated hard surfaces near the cores. Thin lines extend outward into the agricultural surroundings, and several smaller settlement clusters appear separately in the north and east. This makes the impervious map more useful than the general land-cover view when the question is where hard surfaces are concentrated rather than simply where developed classes occur.
The visible connection between Charleston and Mattoon also becomes easier to follow. Coles County notes that State Route 16 runs between the two communities and places Sarah Bush Lincoln Health Center along that route. The map’s linear hard-surface pattern is consistent with an intercity transportation corridor, but it should not be used as a route map. Named roads, lane widths, rights-of-way, and traffic conditions require a dedicated transportation source.
Impervious cover can support a discussion of runoff because water moves differently across pavement and rooftops than across fields or forest. It is not, however, a flood-hazard layer. Rainfall intensity, slope, soil, drainage systems, stream levels, and local topography all matter. A dark cell identifies a higher proportion of hard surface within the classification grid; it does not by itself show where flooding will occur.
The 1985–2025 difference layer is mostly scattered rather than countywide
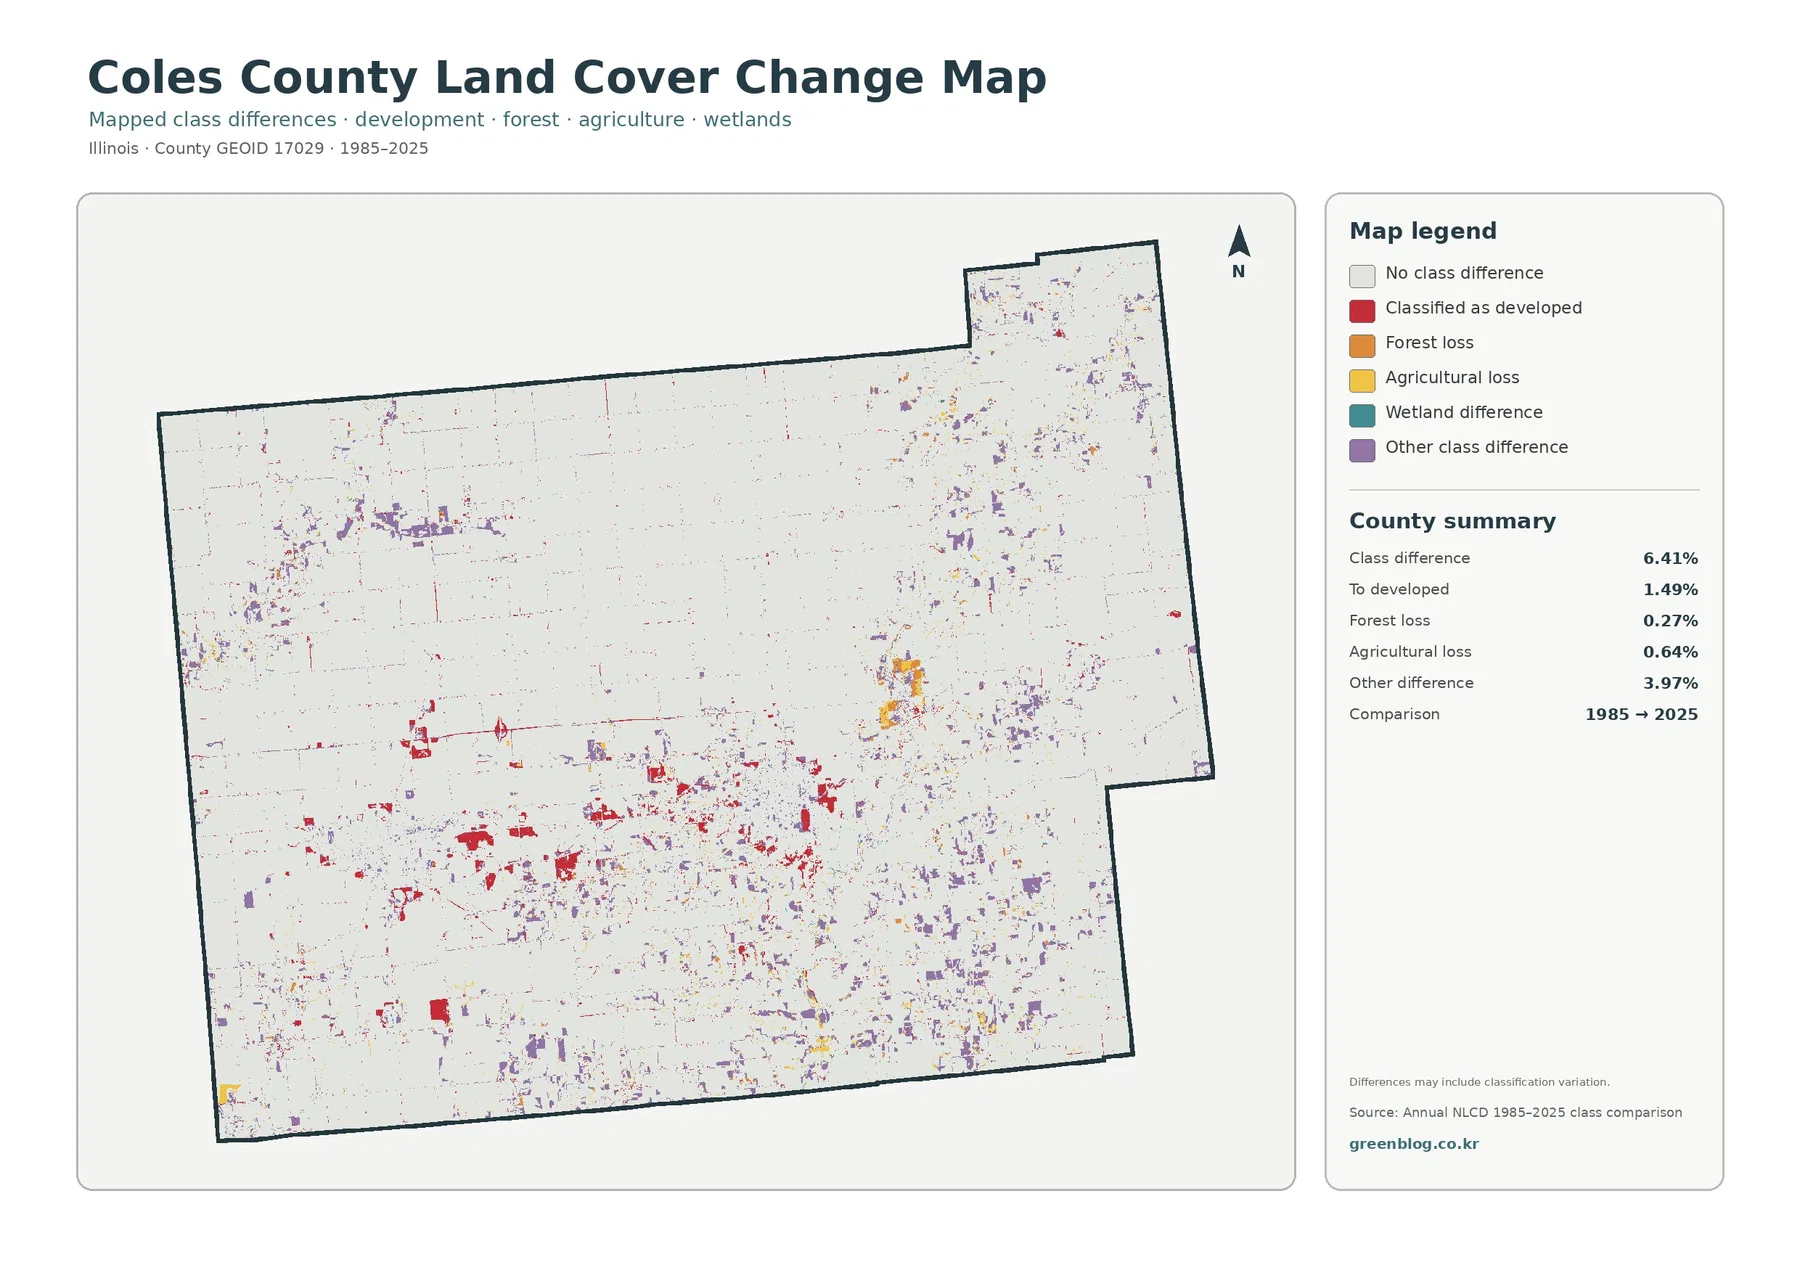
The comparison reports 6.41% total class difference between 1985 and 2025. The listed components are 1.49% classified as developed, 0.27% forest loss, 0.64% agricultural loss, and 3.97% other difference. Wetland difference appears in the legend but does not have its own printed percentage in the summary. A residual calculation should therefore not be presented as an official wetland-change figure.
Red developed-conversion cells are most noticeable around the two large current urban footprints and at several smaller settlement locations. Orange forest-loss marks appear in scattered pieces, including the east and southeast where present-day forest is more common. Yellow agricultural-loss cells are also dispersed rather than forming one large belt. Purple other-difference cells make up the largest named share and occur across many parts of the county, especially in the southern half and near some northern patches.
That composition matters when describing change. It would be misleading to call 6.41% a measure of urban growth, because only 1.49% is explicitly listed as becoming developed in this endpoint comparison. It would also be misleading to call every orange or yellow cell permanent loss. A cell labeled forest in 1985 and something else in 2025 may have changed for many reasons, and the two-date graphic does not identify the year or cause of the change.
Annual NLCD uses 30-meter raster cells, meaning the county is divided into square pixels and each cell receives a predominant class. A single cell can contain crop rows, a ditch, trees, grass, pavement, and a building. Mixed surfaces, seasonal conditions, and classification differences can all affect endpoint labels. When a specific property or project matters, intermediate aerial imagery, permits, parcel records, and field information are needed.
What 77.11% agriculture does—and does not—tell you about Coles County
The agricultural percentage is a strong description of the county’s surface pattern. Broad cropland blocks extend across most of the north, west, and central interior, and the focused vegetation map makes their continuity especially clear. The percentage does not identify ownership, farm size, crop type, productivity, or whether a parcel is legally classified as agricultural. Those questions belong to farm statistics, assessor records, or agricultural program data rather than the land-cover layer.
University of Illinois Extension maintains a Coles County office in Mattoon and provides agriculture and natural-resource programs for the area. That is a useful next source when a reader needs information beyond the surface classification. The map is better suited to questions such as where the farm background is most continuous, where it gives way to urban cover, and where forest interrupts the rectangular field pattern.
The contrast among those three major classes is more informative than the agriculture number alone. North and west of the main urban centers, the agricultural color remains comparatively uninterrupted. Around Mattoon and Charleston, developed cover breaks the grid into a more complex pattern. Farther east and southeast, wooded terrain becomes increasingly prominent. That countywide progression gives the map a distinctive structure that would disappear if the article only listed percentages.
Choose the map that matches the question before zooming in
For a county profile, begin with the 2025 overview because it places agriculture, forest, developed land, water, and wetlands in one frame. If the main topic is farming versus natural cover, move to the forest-and-farmland view, where the southeastern wooded bands stand out without the visual weight of urban classes. For a discussion of Charleston and Mattoon, the impervious map is the clearest way to separate concentrated hard surfaces from lower-density developed edges.
The 1985–2025 layer works best after the current maps. Its red, orange, yellow, teal, and purple colors describe endpoint class differences, not present-day land-cover categories. Putting it beside the current overview helps prevent a common mistake in which a change color is interpreted as the current surface. When timing or cause matters, use the change layer only as a screening tool and follow it with dated imagery or records.
Each downloadable JPG measures 2480 × 1754 pixels. The package does not identify the files as meeting an A3 high-resolution reference, so large-format printing should be tested before producing a full set. For web publishing, slides, classroom displays, and county comparisons, keep the original proportions and resize the image to suit the layout rather than stretching it.
The current maps represent the supplied 2025 observation year. Construction, road work, vegetation removal or recovery, and agricultural changes after that date may not appear. Enlarging the image also cannot create parcel-level detail beyond the source grid. Coles County’s GIS portal, current aerial photography, and official land records are better choices when a decision depends on an exact property boundary or a recent local change.
Frequently Asked Questions
Why does 11.34% forest look so prominent on the eastern side of Coles County?
Forest is not spread evenly across the county. Much of it is concentrated in branching bands east and southeast of Charleston, so the dark green stands out strongly against broad yellow farm blocks. Illinois DNR’s description of Fox Ridge State Park and the Embarras River area confirms that wooded ridges, valleys, and floodplain forest are important parts of that southeastern landscape.
Why is developed cover 10.26% when mean impervious cover is only 2.95%?
Developed land-cover classes can include lawns, trees, soil, and other permeable surfaces around homes, businesses, and roads. Impervious cover focuses on roofs, pavement, parking lots, and similar hard materials. The two measures describe related but different characteristics, so the countywide impervious mean is much lower than the developed share.
Does the 6.41% class difference mean that 6.41% of Coles County was permanently converted after 1985?
No. The value is the share of cells whose endpoint classifications differ between 1985 and 2025. Some represent real land-cover change, but mixed pixels, seasonal conditions, and classification variation can also contribute. The map does not identify the exact year, permanence, or cause of each difference.
Sources and Reference Data
- MRLC Annual NLCD Data – official access point for annual land-cover and comparison products
- USGS Annual NLCD Land Cover Classification – definitions and guidance for agriculture, forest, wetlands, developed land, and related classes
- U.S. Census Bureau TIGER/Line Shapefiles – official county-boundary reference
- Coles County, Illinois – official county information on Charleston, Mattoon, industry, transportation, and the county GIS portal
- Illinois DNR – Fox Ridge State Park – official description of the wooded ridges, valleys, and Embarras River setting south of Charleston
- University of Illinois Extension – Coles County – local agriculture and natural-resource programs and the Mattoon extension office
Map File Information
The ZIP contains four original JPG maps for comparing Coles County's 2025 farm-dominant cover, Charleston–Mattoon development, southeastern forest, impervious surfaces, and 1985–2025 class differences.
- Included Files: Maps described in this article
- File Type: ZIP archive available from the download link below
- Intended Use: Printing, education, presentations, and map-based projects
Related Maps
- Adams County Illinois Land Cover Map
- Alexander County Illinois Land Cover Map
- Bond County Illinois Land Cover Map
Green Map creates custom-edited map images using open geographic data sources such as geoBoundaries, Natural Earth, OpenStreetMap, and government open data. These maps are edited visual materials, not raw data files, and are provided for education, documents, presentations, and graphic reference.