Troup County has a strong contrast between wooded land, a large western water body, and several built clusters. In the 2025 summary, forest covers 55.58% of the county, developed cover 14.11%, agriculture 12.33%, water 7.05%, and wetlands 4.28%. The central developed area is the largest hard-surface concentration, while the western side is shaped by water and forest. That combination gives the county a very different map pattern from a place dominated by either farms or urban cover alone.
Four maps are provided on this page: current land cover, a forest-and-farmland view, fractional impervious surface with developed land, and mapped class differences between 1985 and 2025. The body previews are 1800×1273 WebP images. A single ZIP download contains the four original 2480×1754 JPG maps, making it possible to inspect the maps on screen first and then use the larger files in a document, class handout, or presentation.
Table of Contents
Forest is the dominant cover, but water changes the western side of the county
Dark green forest occupies most parts of the county outside the major settlement areas. Large wooded blocks surround the western water body and continue across much of the north, east, and southern interior. Yellow agricultural patches are scattered through the south, east, and north instead of forming one continuous belt. Teal wetlands occur in narrower bands and irregular pockets, often close to water or within larger forested areas.
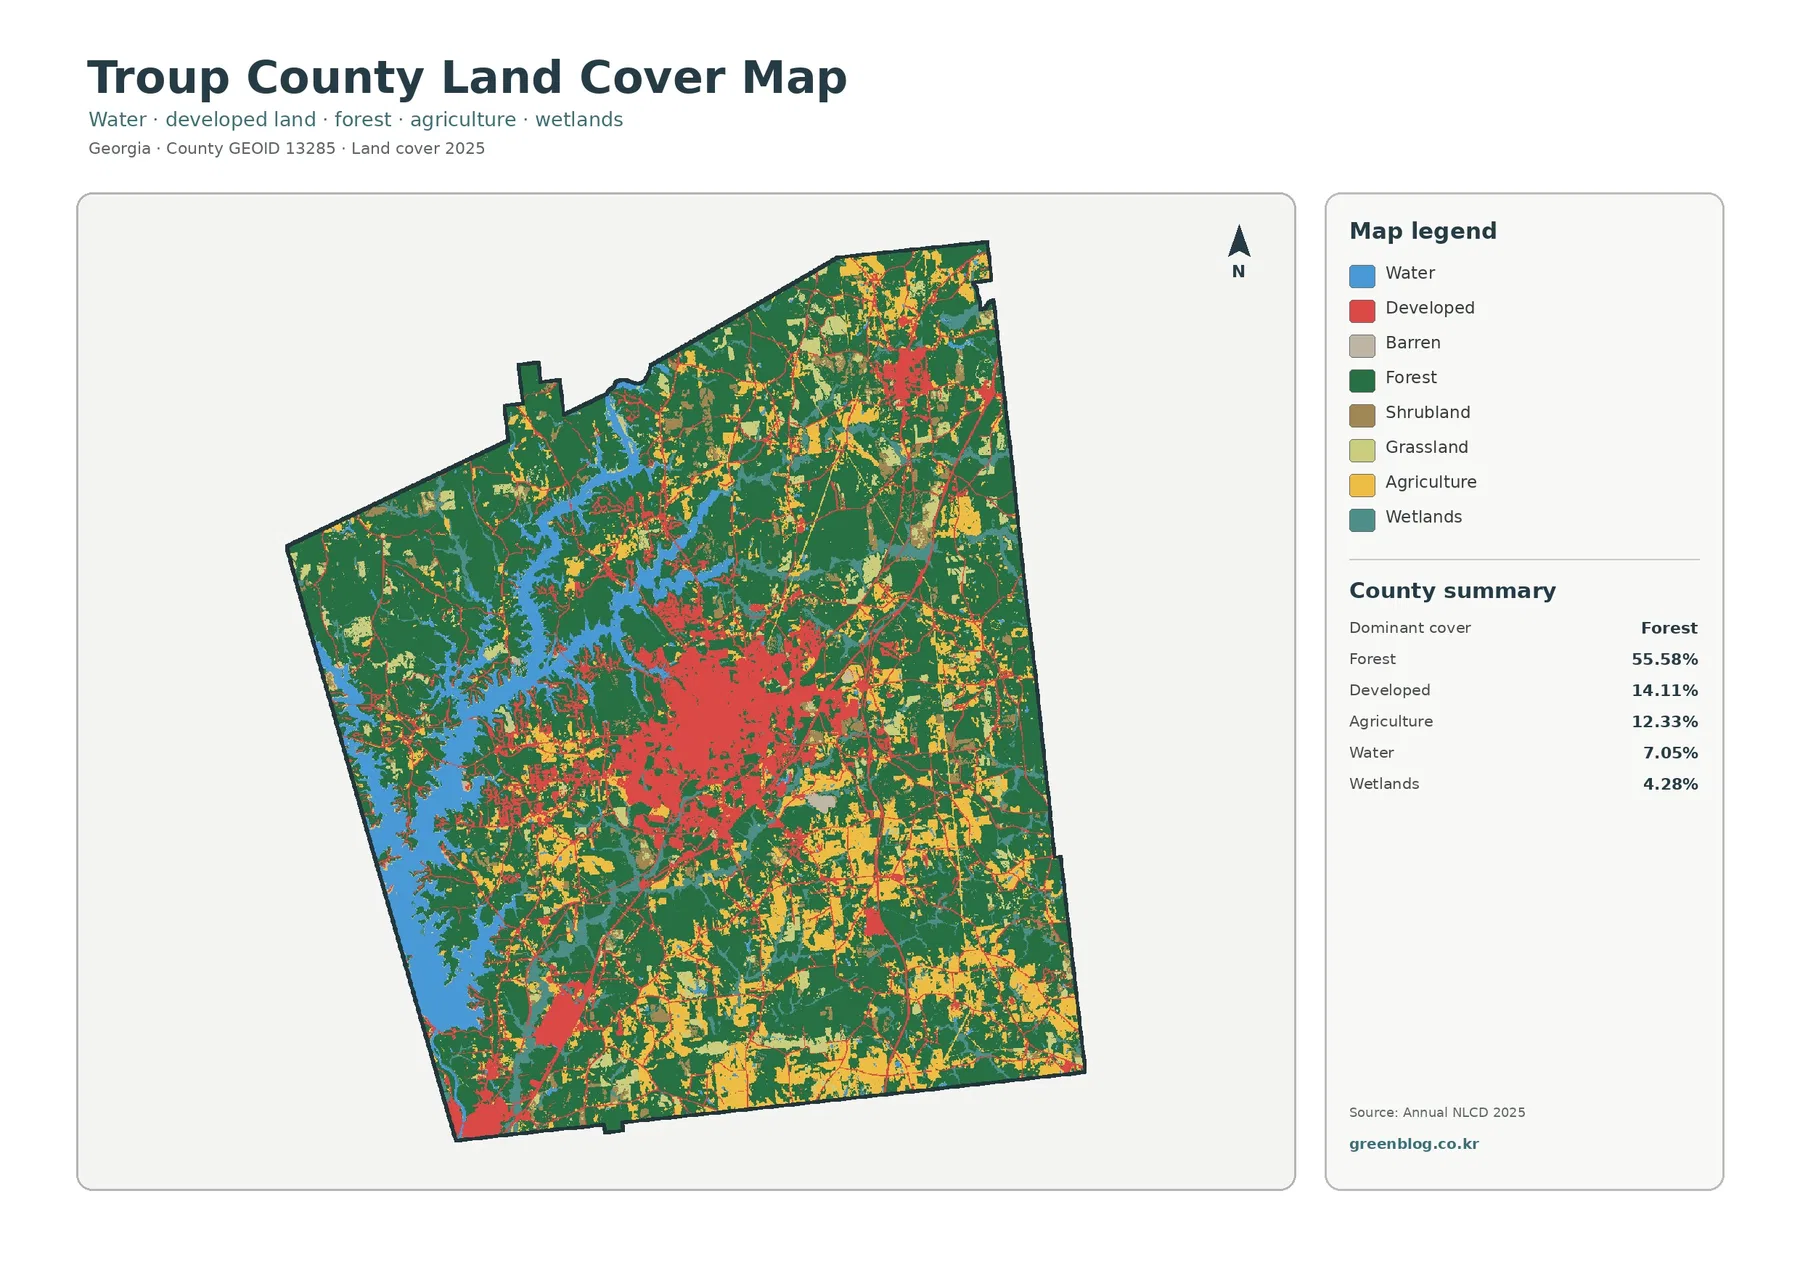
Troup County’s official website places the county on the Chattahoochee River and notes that West Point Lake lies predominantly within the county. The county’s 2025 comprehensive plan also describes a West Point Lake conservation character area in western and northern Troup County. Those official sources provide useful names for the broad geographic setting visible in the supplied image, although the map itself does not label the reservoir, river, municipal limits, or roads.
Water accounts for 7.05% of the mapped area, and the share is easy to understand once the western side is viewed at full size. Blue does not appear only as small isolated ponds; it forms a broad, branching body that reaches far into the surrounding forest. The pattern creates long forest-water edges and many narrow inlets. None of those blue pixels should be treated as a navigation zone, public-access boundary, or floodplain, because the map classifies surface cover rather than legal or recreational use.
| 2025 land-cover class | Share |
|---|---|
| Forest | 55.58% |
| Developed | 14.11% |
| Agriculture | 12.33% |
| Water | 7.05% |
| Wetlands | 4.28% |
| Grassland | 3.85% |
| Shrubland | 2.52% |
Land cover is not the same thing as zoning, ownership, or legal land use. A forest cell means tree cover is dominant at the raster scale. A developed cell can include pavement, buildings, lawns, trees, and other surfaces, while an agricultural cell does not identify the owner or crop. Parcel-level questions need tax, survey, zoning, environmental, or permitting records rather than a countywide satellite classification.
Removing the urban colors makes the forest-farm pattern easier to compare
The forest-and-farmland version reduces the visual weight of developed land so the rural and natural cover can be followed more easily. Forest remains the clear background at 55.58%. Agriculture accounts for 12.33%, grassland 3.85%, shrubland 2.52%, wetlands 4.28%, and water 7.05%. The result is not a single unbroken forest block: farm and open-cover patches interrupt the green in many parts of the county.
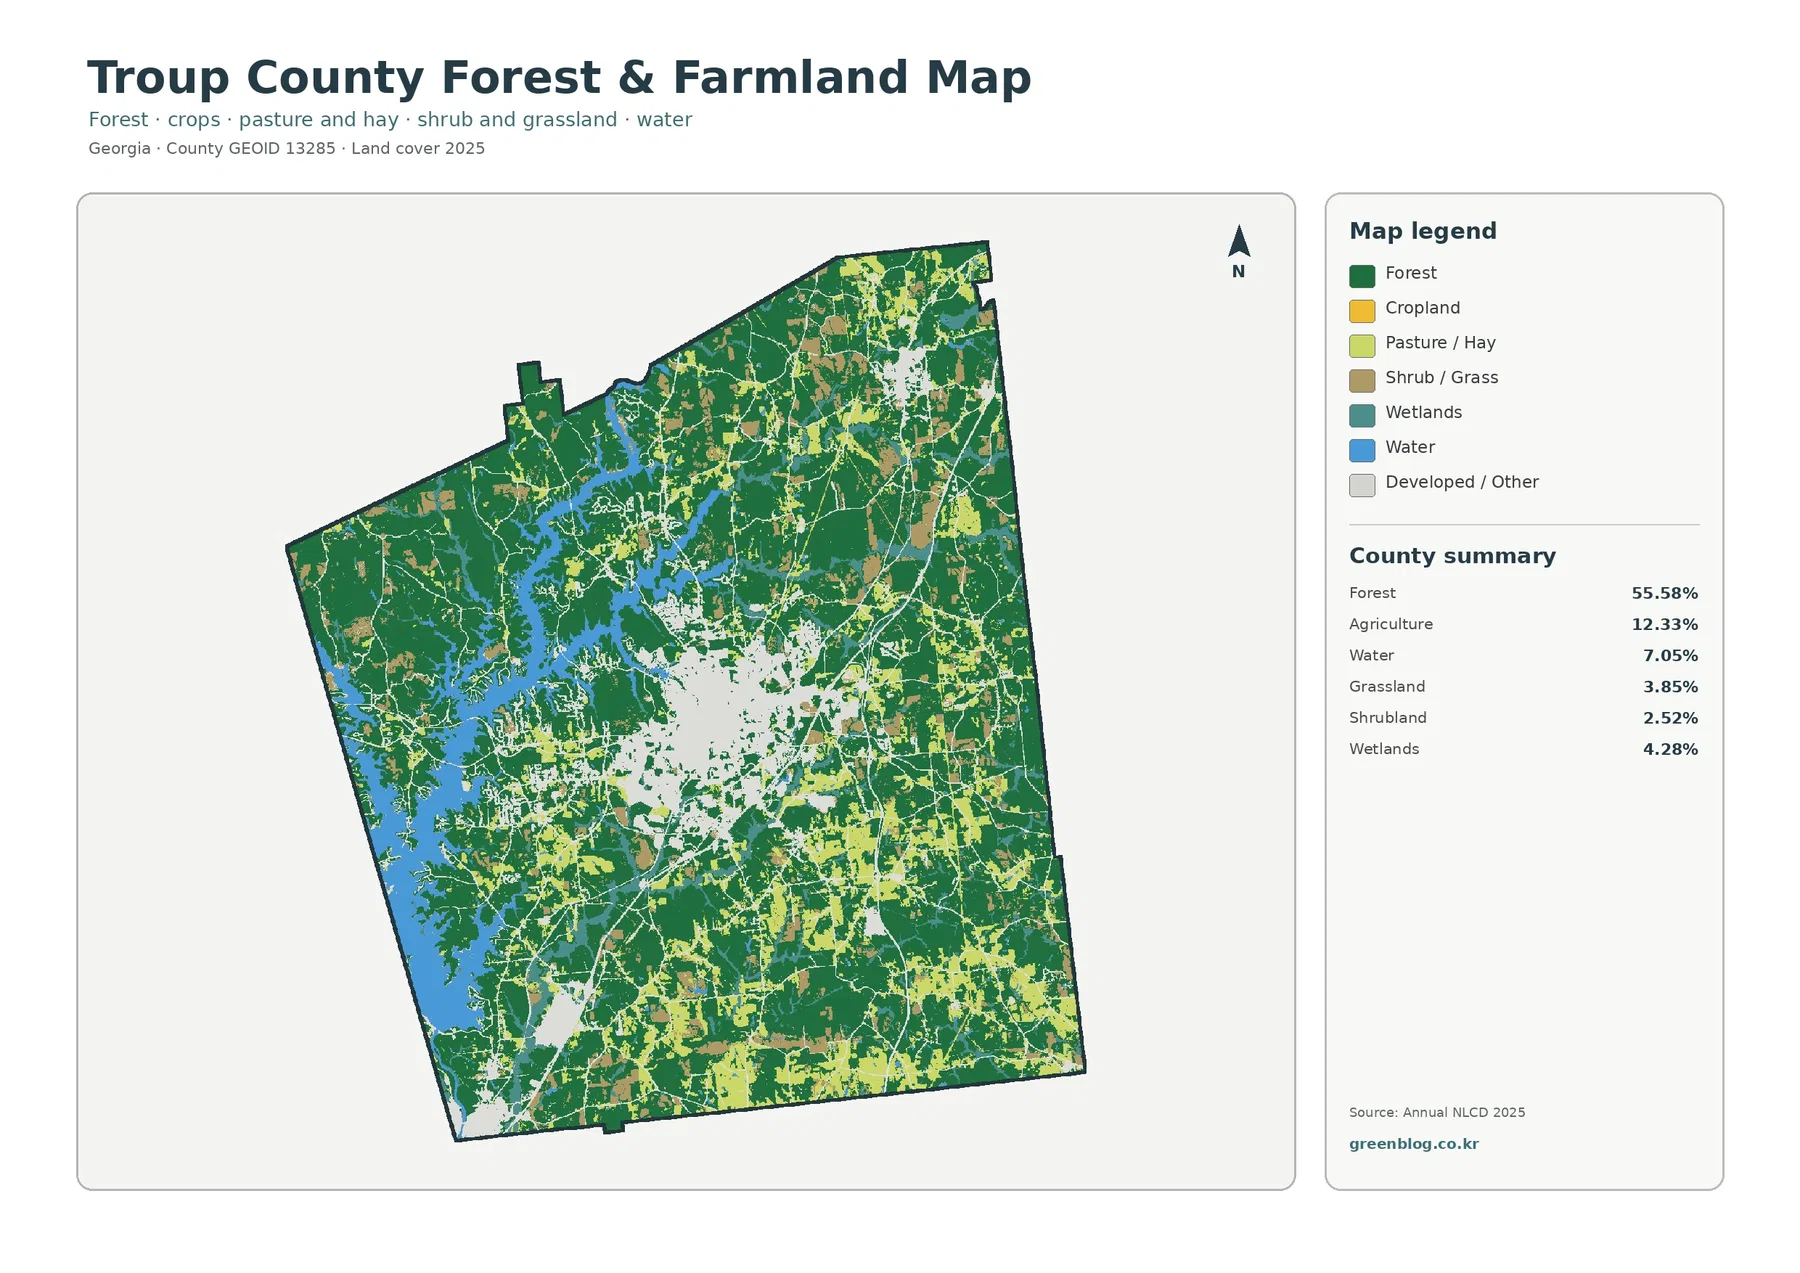
Forest is especially continuous around much of the western water body and across several outer parts of the county. Agricultural color becomes more frequent in the south and east and also appears in scattered northern patches. Smaller grass and shrub classes occupy transitions between forest, farms, and developed areas. Looking at these classes together prevents the 55.58% forest statistic from being mistaken for a county that is uniformly wooded from boundary to boundary.
UGA Extension’s Troup County office provides agriculture and natural-resources education and links residents to research-based production and environmental information. That local role confirms that agricultural and natural-resource management are meaningful county topics, but the supplied NLCD map does not identify individual farm enterprises. A yellow patch cannot be labeled as a particular crop, and a green patch cannot establish timber ownership or a management unit.
Wetlands represent 4.28% of current cover. Although that percentage is much smaller than forest, teal areas are visible in a number of corridors and pockets, including places near the western water network. A land-cover wetland class is not a regulatory wetland determination. Environmental review, permitting, or property decisions require the appropriate field work and official wetland information rather than a classification color alone.
Hard surfaces reveal a strong central core and smaller outlying clusters
The impervious-surface map strips away most of the land-cover colors and makes settlement intensity much easier to see. A large dark concentration sits near the center of the county. Smaller clusters are visible toward the northeast and southwest, while thin lines connect settlements and cross the rural landscape. Wide areas around West Point Lake and the outer county remain white or lightly shaded, showing a sharp contrast with the principal built center.
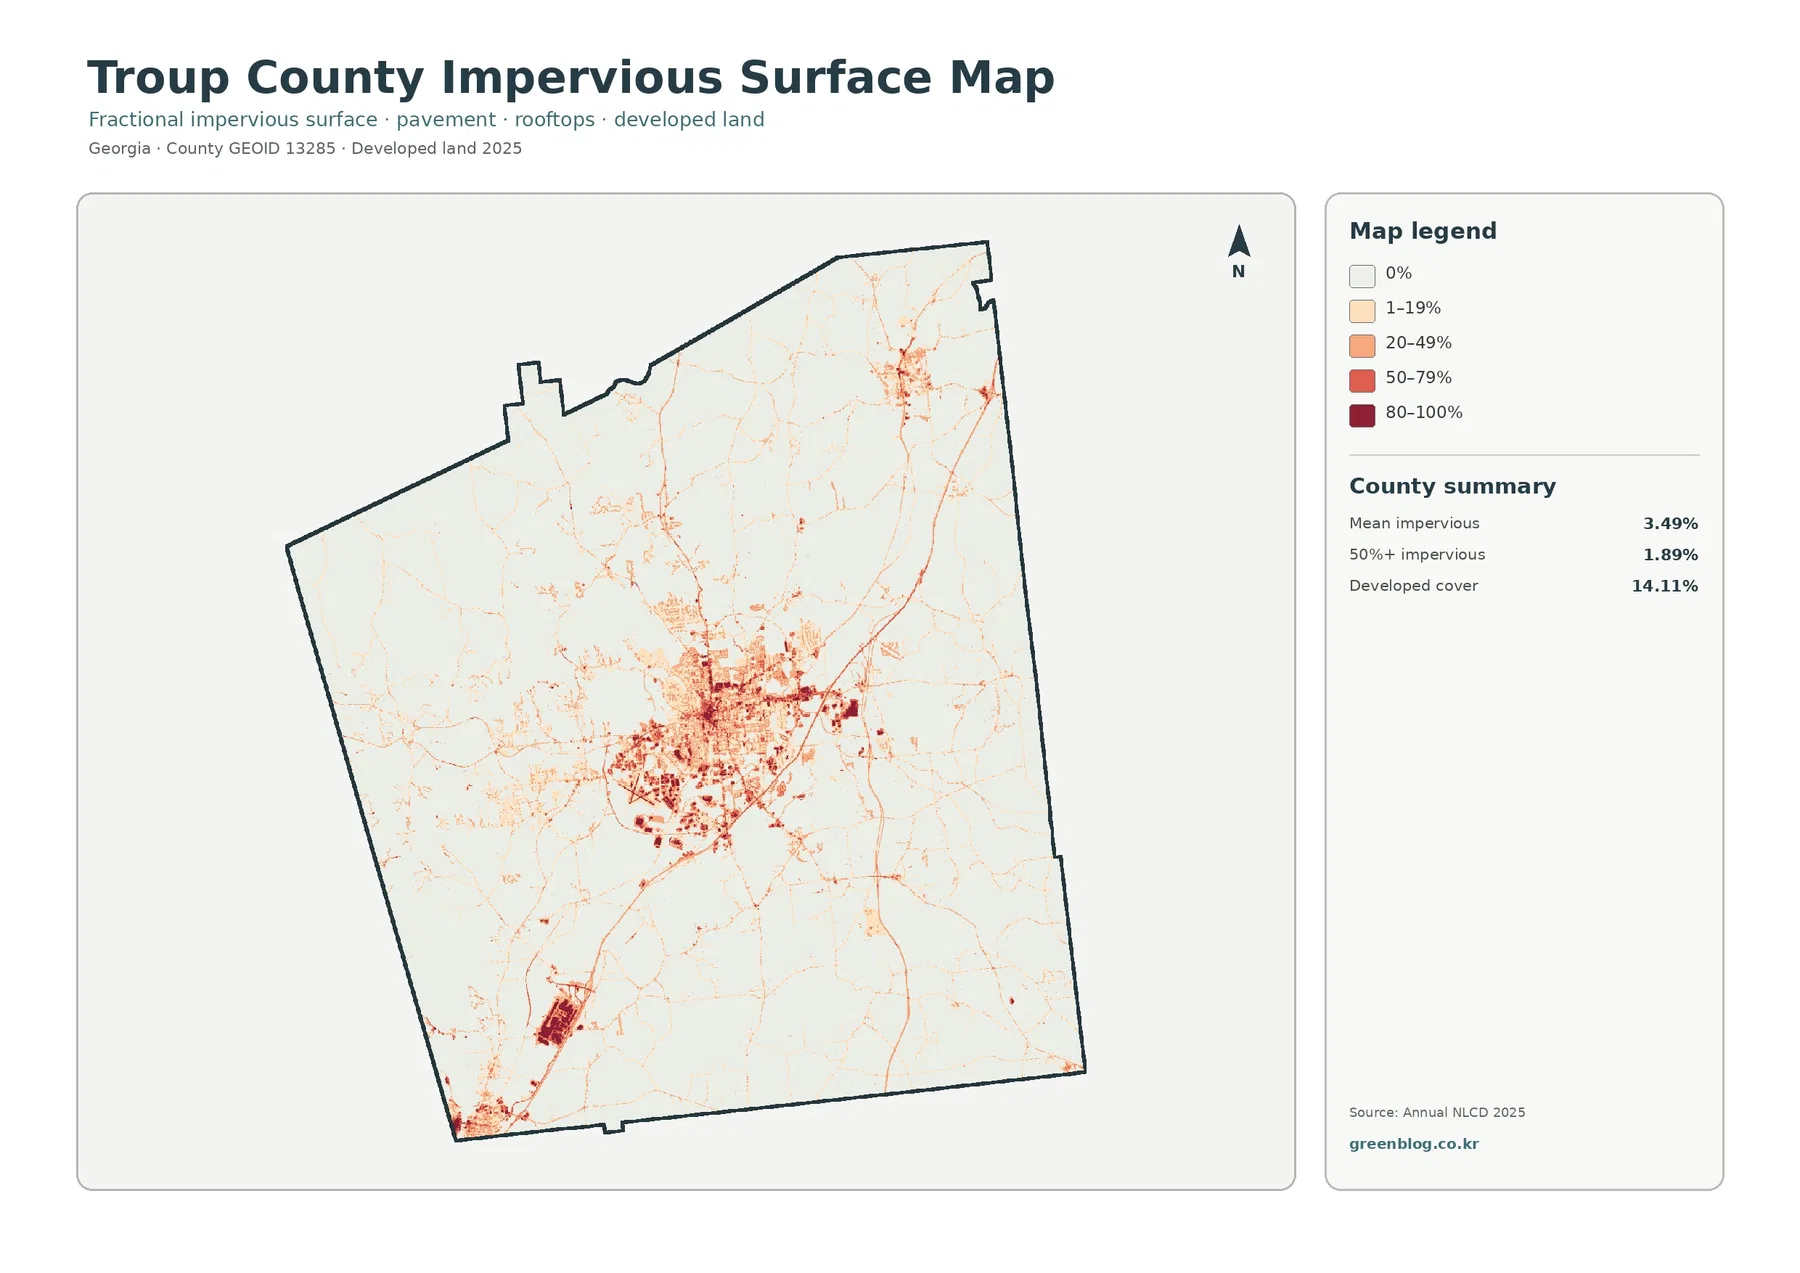
County information identifies three municipalities: LaGrange, West Point, and Hogansville, with LaGrange serving as the county seat. That official context is useful when discussing the map’s central and outlying settlement pattern. It does not, however, turn the colored clusters into city boundaries. The supplied image does not contain municipal outlines, so any exact city-limit overlay should come from Census TIGER/Line data or another official boundary source.
Mean impervious surface is 3.49%, while land with at least 50% impervious cover represents 1.89%. Both numbers are much lower than the 14.11% developed-cover class. The difference is expected because a developed land-cover cell can include lawns, trees, soil, and other permeable surfaces in addition to roofs and pavement. Dense hard surfaces are concentrated in a relatively small part of the county rather than spread evenly through every developed cell.
Impervious surface is useful for locating rooftops, pavement, parking areas, and similar hard surfaces that do not readily absorb rainfall. It should not be treated as a flood-risk map. Runoff also depends on storm intensity, soils, slope, drainage infrastructure, vegetation, and proximity to channels. A dark patch can support a discussion about urban surface intensity, but it does not prove that a specific parcel will flood.
| Impervious/developed measure | Share |
|---|---|
| Mean impervious surface | 3.49% |
| 50%+ impervious surface | 1.89% |
| 2025 developed cover | 14.11% |
The 1985-2025 class difference is broader than growth in developed cover
The change map compares the 1985 and 2025 land-cover classifications. Total class difference is 29.87%. Within that total, 4.48% is labeled as changed to developed, 7.49% as forest loss, 2.01% as agricultural loss, and 15.62% as other class difference. Wetland difference appears in the legend, but the summary does not provide a separate wetland percentage, so no missing value has been derived by subtraction.
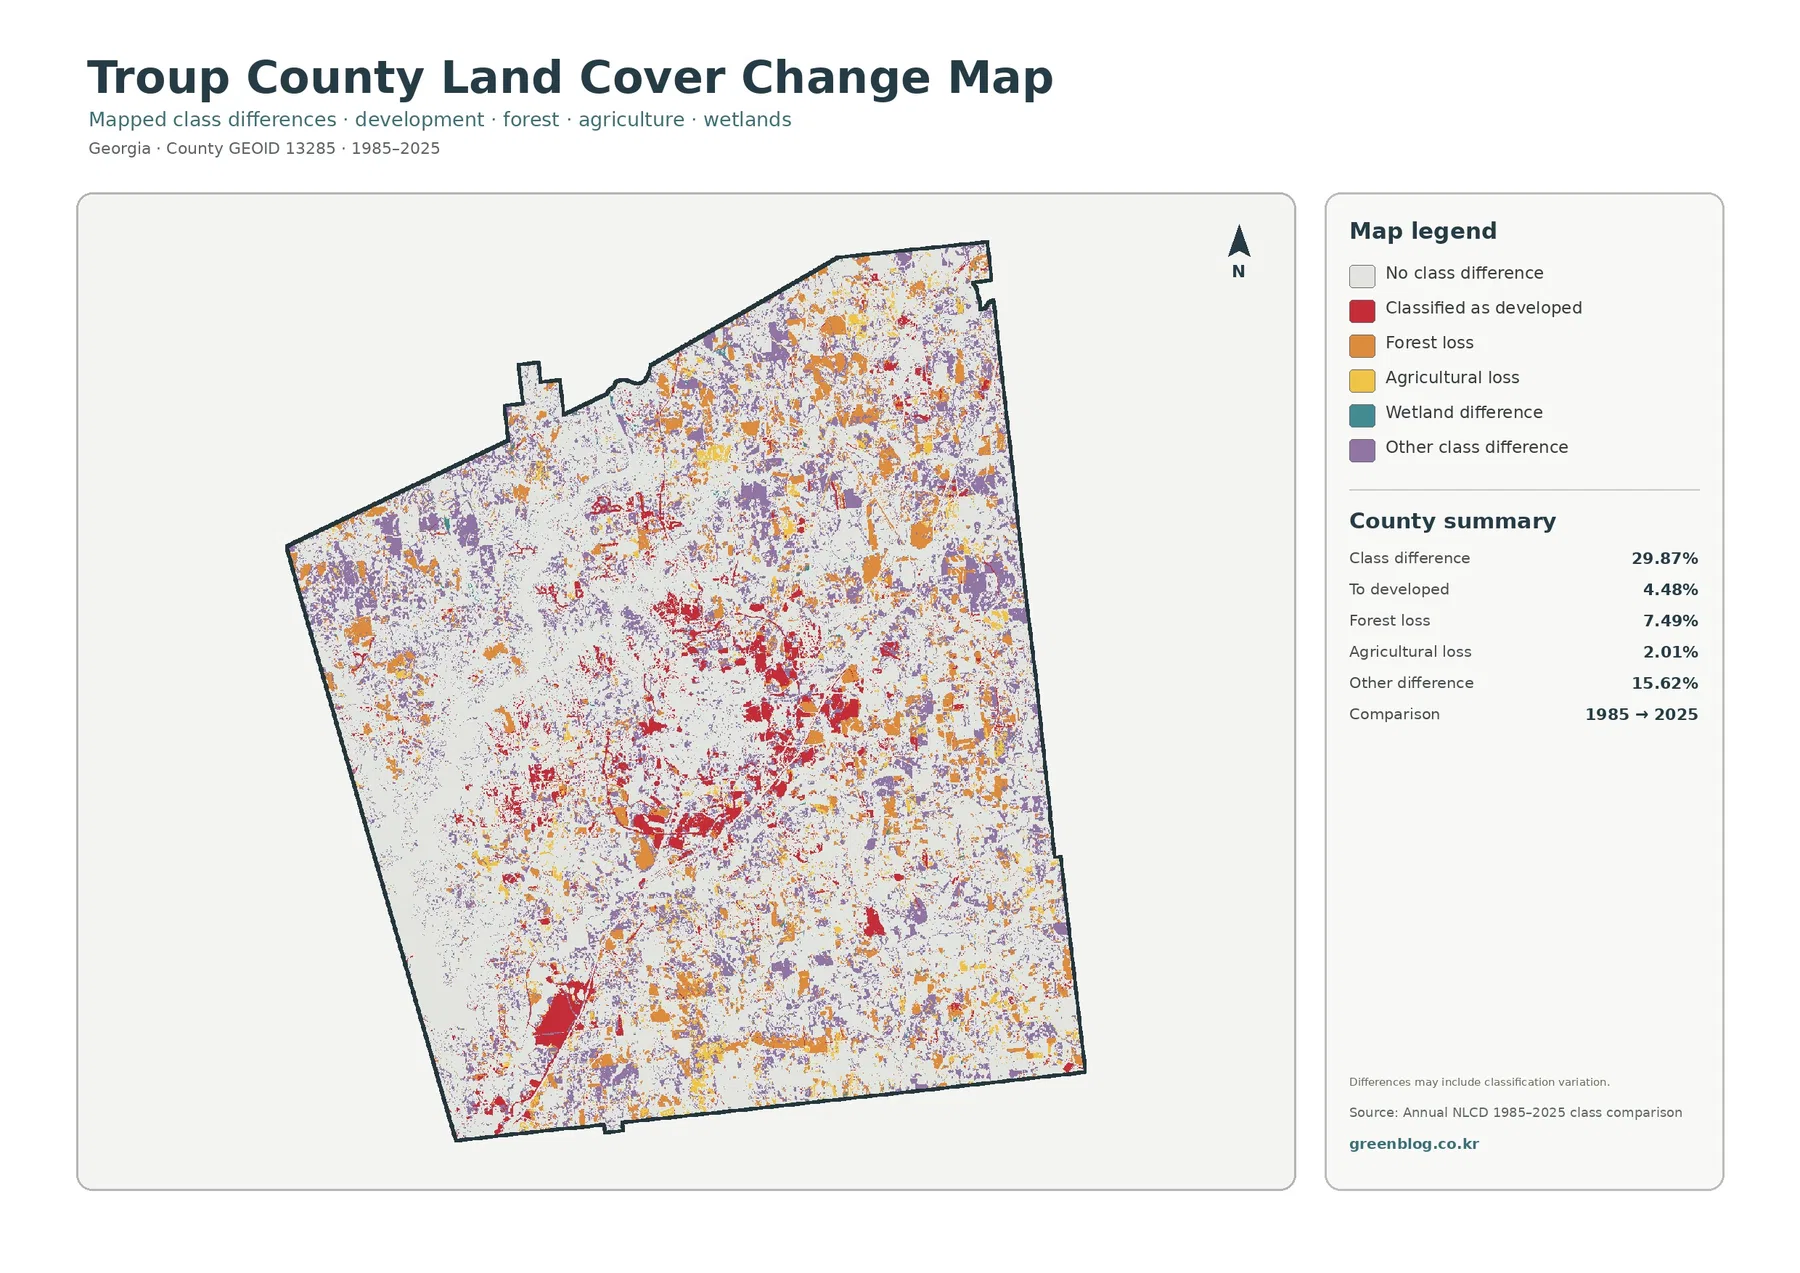
Red changed-to-developed areas are most noticeable around the central settlement and along several linear corridors, with additional patches in the northeast and southwest. Orange forest-loss and purple other-difference cells are more widely scattered across the county. That distribution matters because it shows why the colored area on the change map is much broader than the dense hard-surface area on the current impervious map.
Calling 29.87% an urbanization rate would be incorrect. Only 4.48% is specifically summarized as changed to developed. The rest includes forest loss, agricultural loss, other class differences, wetland-related differences, and possible classification variation. The map itself warns that differences may include classification variation, so a single changed pixel cannot establish whether the cause was construction, clearing, regrowth, farming, or another process.
Forest loss at 7.49% also should not be read as a statement that exactly 7.49% of all county forest permanently disappeared. This map compares two endpoints. It does not show when a cell changed, whether it changed more than once, or what its intermediate condition was. Historical aerial photography, annual imagery, development records, and forest-management information are better tools when the timing or cause of a change is the question.
| 1985-2025 mapped difference | Share |
|---|---|
| Total class difference | 29.87% |
| Changed to developed | 4.48% |
| Forest loss | 7.49% |
| Agricultural loss | 2.01% |
| Other difference | 15.62% |
How West Point Lake, LaGrange, West Point, and Hogansville fit the map without becoming labels
Troup County’s official About page names LaGrange, West Point, and Hogansville as the county’s three municipalities and identifies LaGrange as the county seat. The same source notes the county’s connection to the Chattahoochee River and West Point Lake. Those facts help a reader understand why a large built center, two smaller outlying clusters, and an extensive western water body can all appear within one county boundary.
Even with that local context, the raster colors should remain separate from administrative geography. Developed cover is not a municipal outline, forest is not a conservation easement, and water is not a recreation-management boundary. The 2025 comprehensive plan provides planning and conservation context around West Point Lake, while the land-cover image shows surface classes. Using each source for its intended purpose keeps the explanation accurate.
Roads present the same issue. Thin impervious lines and developed corridors are visible, but the map does not print route names. If a project needs Interstate, state-route, or local-road labels, a TIGER/Line or official transportation layer should be placed above the land-cover image. That approach preserves the land-cover information while adding the geographic references needed for navigation or planning.
Choose the map according to the question, not by appearance alone
For a general county overview, the current land-cover map is the most complete choice. It keeps forest, agriculture, developed land, water, wetlands, grassland, and shrubland in one legend. The large western water body and central built cluster are immediately visible, making this version suitable for county introductions, environmental lessons, and broad land-cover comparisons.
Forestry or rural-land discussions benefit from the forest-and-farmland version because developed cover is visually simplified. It becomes easier to follow the 55.58% forest share, the 12.33% agricultural patches, and the smaller open-cover classes. The impervious map is better when the question is where hard surface is concentrated, especially when comparing the central core with the much lighter outer county.
Long-term comparison requires the change map, but the legend must stay with the image. Red means changed to developed on that map, not current developed cover. Orange identifies forest loss, while purple represents other class difference. When the current land-cover map and change map are placed side by side, viewers should be told that 14.11% current developed cover and 4.48% changed-to-developed area describe different measurements.
A two-map layout is often easier to read than shrinking all four maps onto one slide. Pair the general map with the impervious map to compare natural cover and built intensity. Pair the general map with the forest-and-farmland view for forestry and agriculture. Use the current map beside the change map when the subject is 1985-2025 change, keeping both legends large enough to read.
Download the four original JPG maps
The WebP previews in the article are 1800×1273 pixels. The ZIP download contains four 2480×1754 JPG files: 2025 land cover, forest and farmland, impervious/developed land, and 1985-2025 land-cover change. All four use the same Troup County boundary, which makes them convenient for side-by-side layouts. The asset manifest does not mark these JPGs as meeting the A3 high-resolution reference, so a test print is recommended before large-format use.
Keep the title, year, and legend with any exported image whenever possible. The same red family of colors is used for related but different ideas across the set. Current developed cover, a high impervious percentage, and changed-to-developed pixels are not interchangeable measurements. Leaving the legend visible is the simplest way to prevent a viewer from treating 14.11%, 3.49%, and 4.48% as if they described the same thing.
Projects that need exact city boundaries, named roads, parcel lines, or shoreline-management zones should add the appropriate official layer. The supplied maps focus on countywide land-cover surfaces. Census TIGER/Line, county planning material, or other official datasets can provide the missing administrative and transportation geography without changing the meaning of the land-cover classes.
Limits of 30 m classification and a two-date comparison
Annual NLCD land cover is a raster product with cells of roughly 30 m. A single cell can contain trees, a house, a narrow road, lawn, soil, or a water edge, yet the land-cover map assigns a representative class. Small features and parcel boundaries therefore appear more generalized than they would in detailed aerial photography or survey data. The product is well suited to countywide pattern comparison, not property measurement.
A 2025 land-cover snapshot represents one classified year and does not include changes that occur afterward. The change map compares 1985 with 2025, but it does not reveal the sequence between those dates. A cell shown as forest loss could have changed early or late in the period and could have passed through multiple cover types. More detailed time-series imagery is needed when the timing of change matters.
Mixed pixels are especially relevant near shorelines, wetlands, narrow roads, and forest edges. Small shifts in imagery or classification can create a mapped difference even when the on-the-ground change is limited. For that reason, every exact percentage in this article comes directly from a supplied map summary. No unlisted wetland-change percentage or barren-land share has been calculated from the remainder.
Frequently Asked Questions
What is the largest 2025 land-cover class in Troup County?
Forest is the largest class at 55.58%. Developed cover is 14.11%, agriculture 12.33%, water 7.05%, and wetlands 4.28%. The western water body and central built cluster create the strongest visual contrast.
Does the central developed cluster show the exact boundary of LaGrange?
No. Troup County identifies LaGrange as the county seat, but the supplied land-cover map does not include municipal boundaries. The developed color is a surface classification; exact city limits require Census or another official boundary layer.
Is the 29.87% 1985-2025 class difference an urbanization rate?
No. Changed-to-developed cells account for 4.48%. The 29.87% total also includes 7.49% forest loss, 2.01% agricultural loss, 15.62% other difference, wetland-related differences, and possible classification variation. Map File Information The ZIP contains four original JPG maps for Troup County: 2025 land cover, forest and farmland, impervious/developed land, and 1985-2025 land-cover change.
Map File Information
Download the map files associated with this page for reference, printing, and compatible visual projects.
- Included Files: 4 original JPG land cover map files shown in this article
- File Type: JPG files in a ZIP archive
- Intended Use: Printing, education, presentations, and map-based projects
Related Maps
- Appling County Georgia Land Cover Map
- Atkinson County Georgia Land Cover Map
- Bacon County Georgia Land Cover Map
Sources and references
- MRLC Annual NLCD Data – official access to annual land-cover and impervious-surface data.
- USGS Annual NLCD Land Cover Classification – official documentation for land-cover classes and interpretation.
- U.S. Census Bureau TIGER/Line Shapefiles – official geography for county, municipal, and road boundaries.
- Troup County Government – About Us – official county context for LaGrange, West Point, Hogansville, the Chattahoochee River, and West Point Lake.
- Troup County 2045 Comprehensive Plan – official planning and conservation context for the West Point Lake area.
- UGA Extension Troup County – county agriculture and natural-resources information and services.
Green Map creates custom-edited map images using open geographic data sources such as geoBoundaries, Natural Earth, OpenStreetMap, and government open data. These maps are edited visual materials, not raw data files, and are provided for education, documents, presentations, and graphic reference.