Download the A3 JPG files from this Greenwood County South Carolina Map page when you need a printable or larger county reference; the WEBP versions below are provided for quick on-page viewing. Greenwood sits near the middle of the mapped road network, Ninety Six lies to the east, Hodges and Ware Shoals are to the north, and Troy marks the long southwestern end. Seeing those places together immediately shows that Greenwood County extends well beyond the city of Greenwood in several directions.
The downloadable ZIP matches the three views shown in the article: a county-and-roads map, a city-connections map, and a terrain-and-water map. The first combines the boundary, named places, numbered routes, parks, and nearby references. The second strips away much of that detail so selected communities can be compared from Greenwood as a hub. The third shifts attention to named creeks, water surfaces, and the rolling Piedmont relief beneath the drainage network.
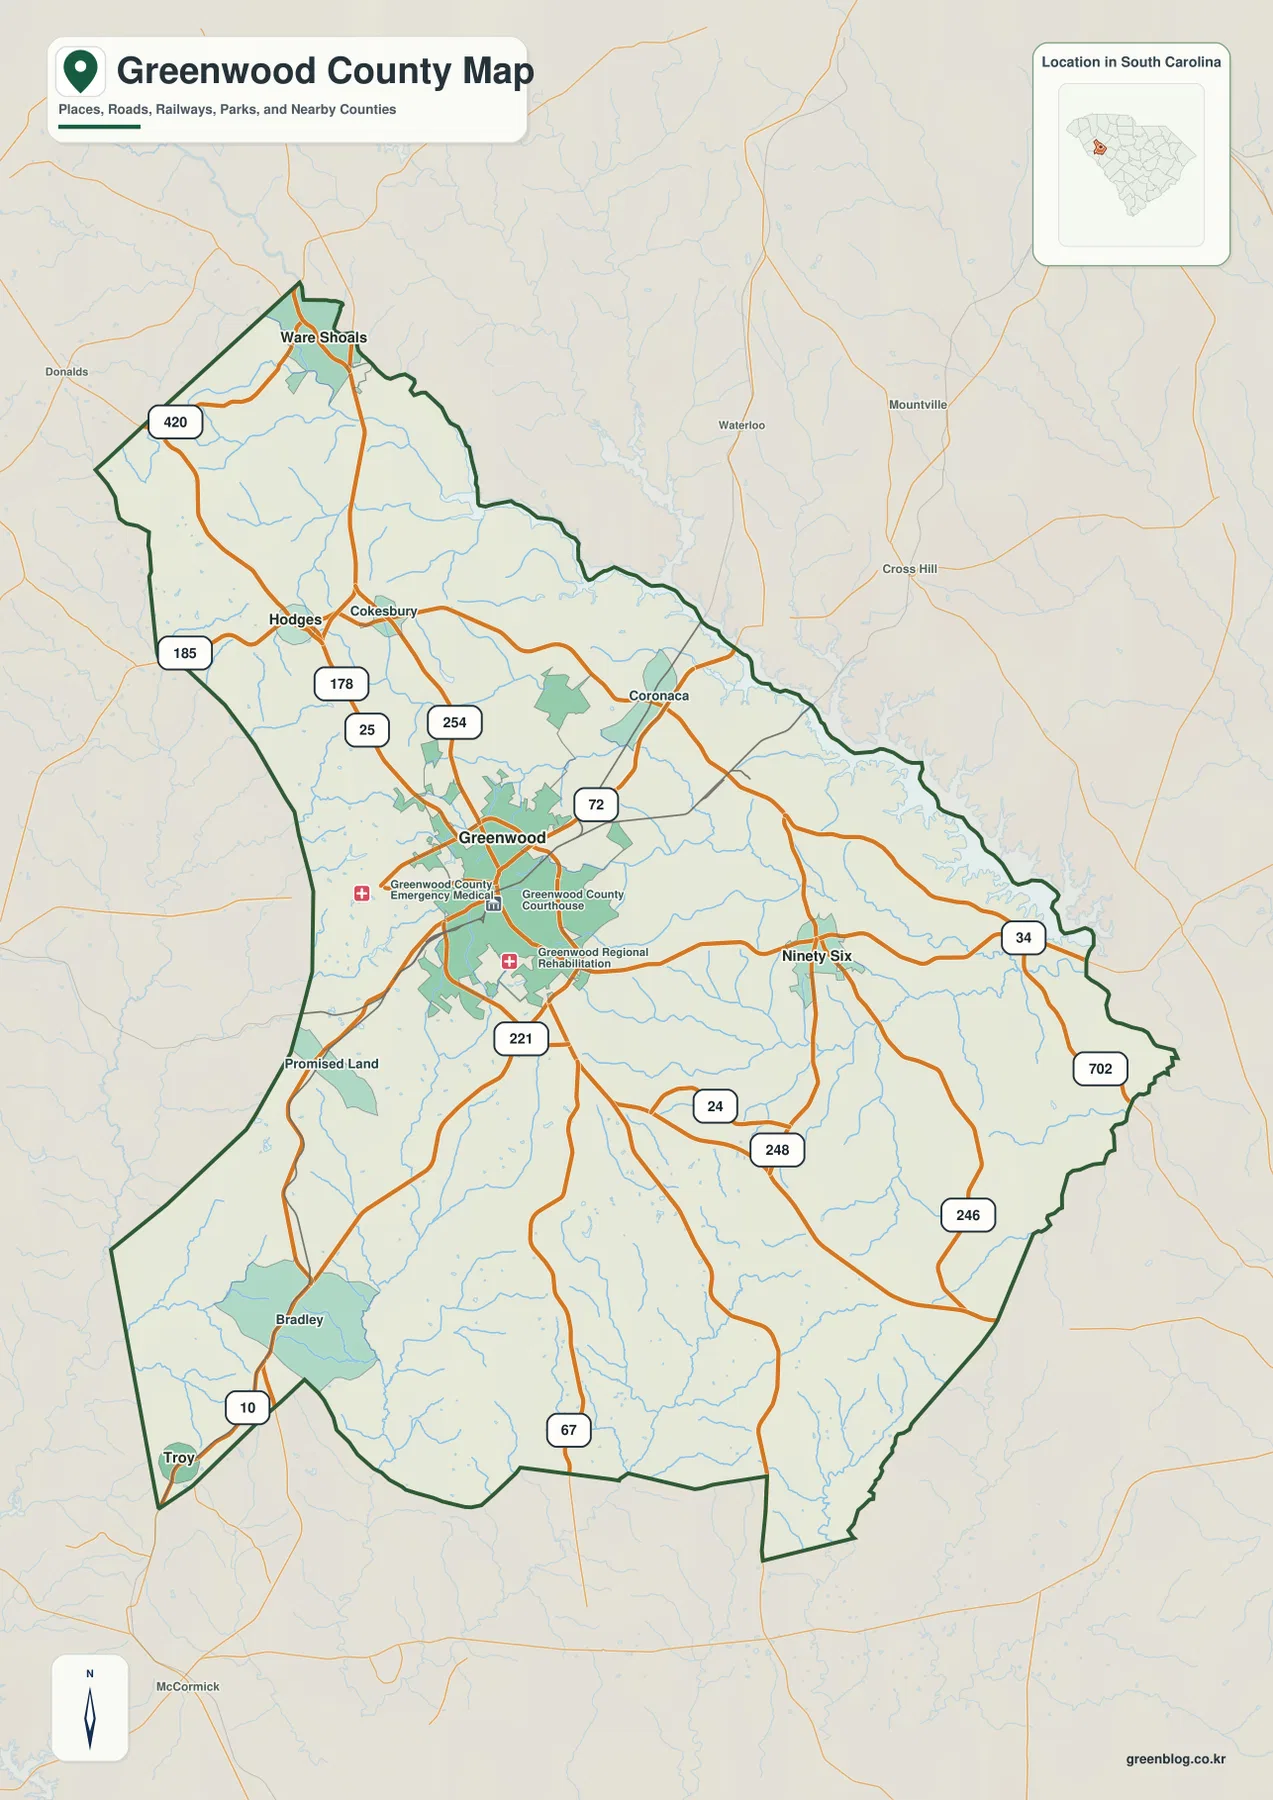
Table of Contents
Greenwood and Ninety Six form the easiest east–west reference
Greenwood is the strongest visual anchor on the general county map because several numbered routes converge around the city. Route shields for 25, 72, and 221 are easy to find near the central area, with additional roads branching toward the north, east, south, and southwest. Ninety Six appears farther east, where the road network becomes less concentrated but remains well connected to Greenwood. If you are unfamiliar with the county, locating these two names first provides a simple frame for everything else on the map.
North of Greenwood, Hodges and Cokesbury appear close to the main northbound road pattern, and Ware Shoals sits near the narrow northern tip of the county. South of Greenwood, Route 221 continues toward the lower part of the county, while Bradley and Troy help define the southwest. The result is an outline that stretches in several directions rather than forming a regular rectangle. Looking at the full boundary before zooming in on Greenwood helps prevent the northern and southwestern sections from being overlooked.
The eastern side has its own road references. Ninety Six lies near the 34 and 702 shields, while 246 and 248 appear farther south and southeast. In the northwestern part of the county, 420 and 185 can be seen around the Ware Shoals side, and 178 and 254 are visible north of Greenwood. The map is not intended to replace a current navigation service, but the road numbers make it much easier to explain how the named places relate to the county boundary.
A few facility labels also appear around Greenwood, including the Greenwood County Courthouse and medical or rehabilitation references. They are useful as central-city landmarks, but the map is not a complete directory of public buildings. Their main value here is orientation: they reinforce that Greenwood is the administrative and urban focus of the county while the other labeled communities are distributed around it.
From the Greenwood hub to Ware Shoals, Hodges, Ninety Six, and Troy
The city-connections map removes much of the road detail and ranks the selected places visually around Greenwood. Greenwood is the hub, Ninety Six is placed to the east, Hodges and Ware Shoals are north of the hub, and Troy is far to the southwest. Because the map uses only a small set of communities, it is easier to read when the question is simply “which direction is this town from Greenwood?” rather than “which numbered road should I follow?”
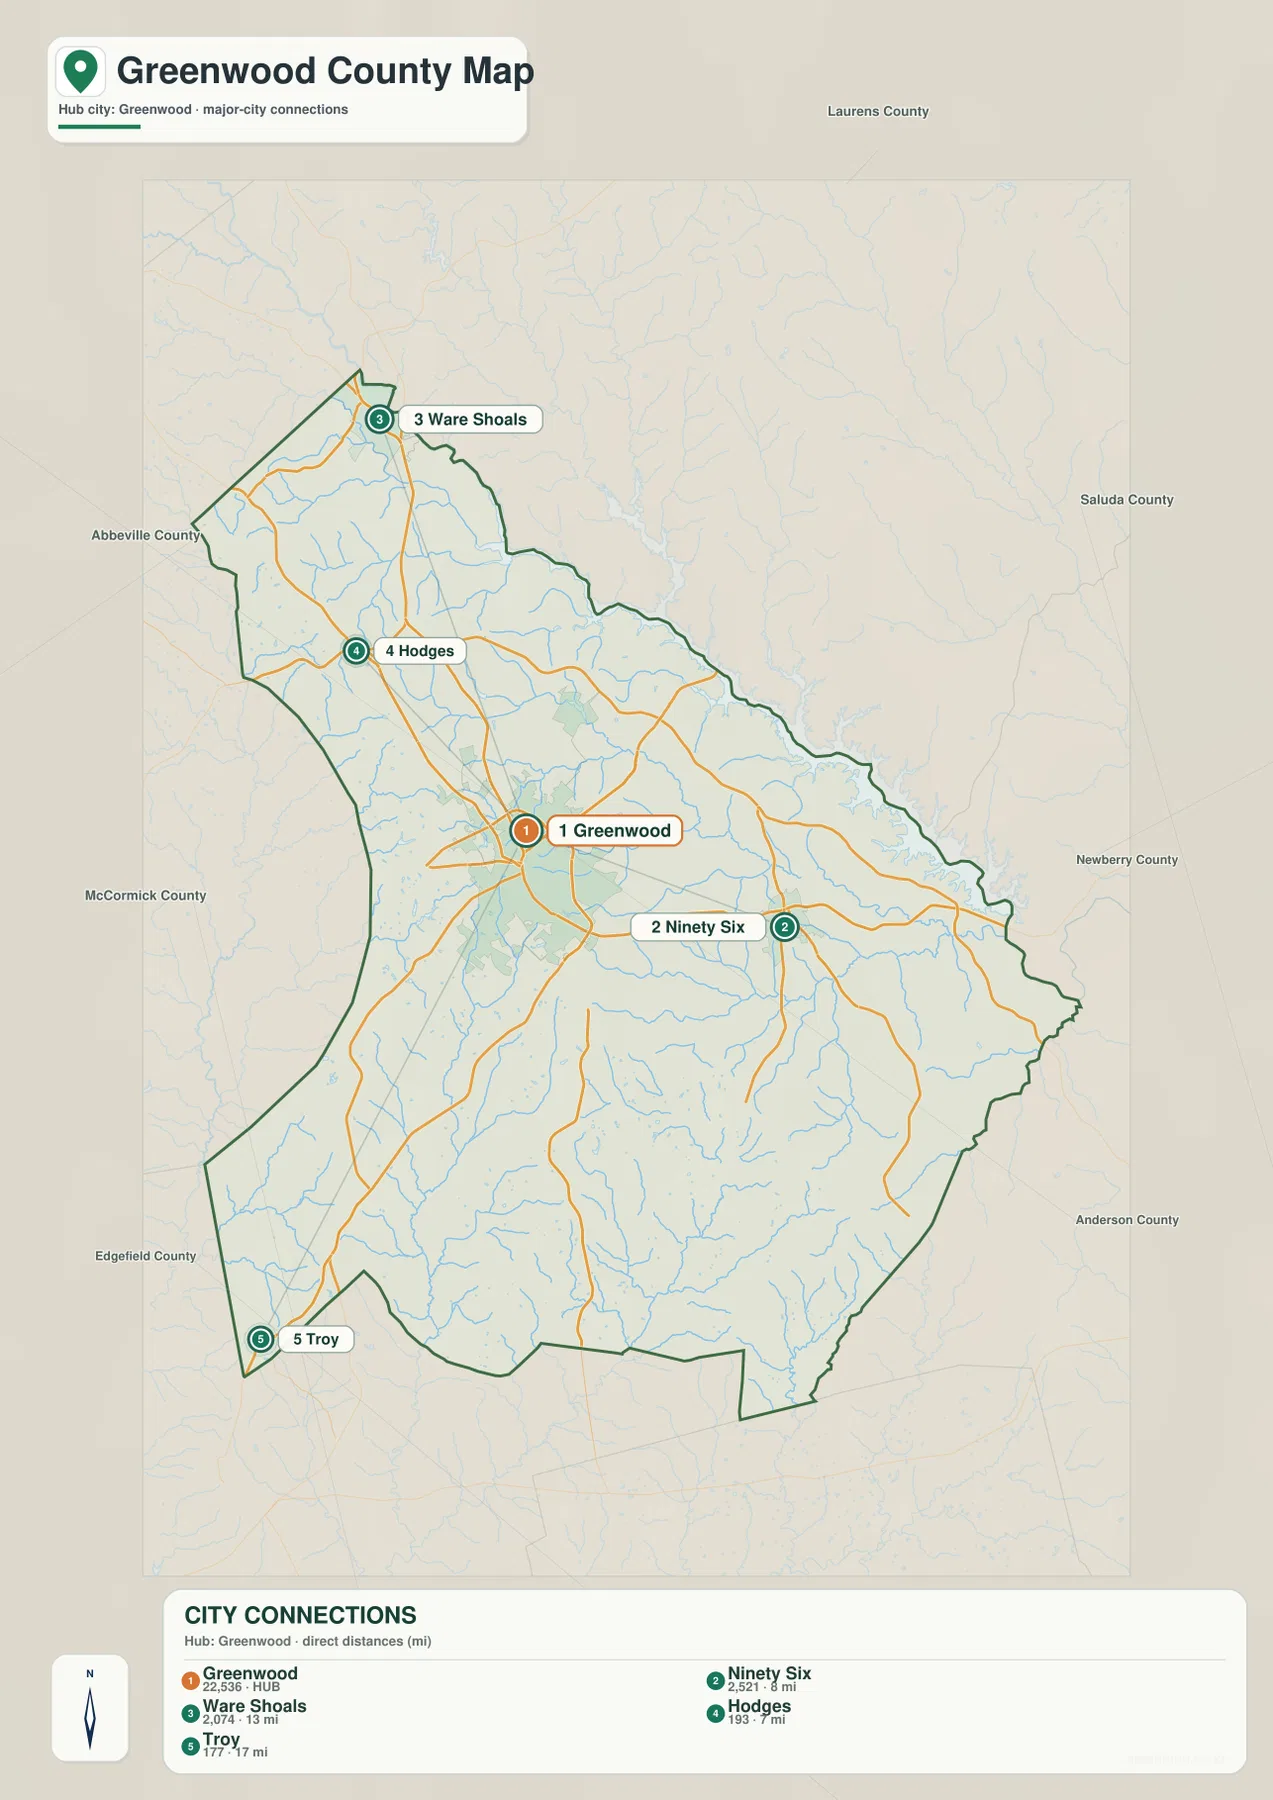
The legend also provides straight-line distance references from Greenwood. Ninety Six is shown at about 8 miles, Hodges at about 7 miles, Ware Shoals at about 13 miles, and Troy at about 17 miles. These are direct-distance values used for the graphic, not driving distances. A real road trip can be longer because roads curve, cross streams, and connect through different junctions.
The numbers help explain the county’s shape. Hodges and Ninety Six are relatively close to Greenwood but lie in different directions, so the hub is connected to more than one local corridor. Ware Shoals is farther north near the top of the county, while Troy sits well away from the hub in the southwest. Together they show why a Greenwood-centered map needs enough surrounding area to represent the county accurately.
Names of surrounding counties are printed outside the boundary as regional references, including Abbeville, McCormick, Edgefield, Laurens, Saluda, and Newberry. Those labels are helpful when placing Greenwood County within western South Carolina, especially if you are comparing several county maps side by side. They should be read as orientation labels rather than as a substitute for a dedicated statewide boundary map.
A dense creek network crosses the Piedmont terrain
The terrain-and-water map changes the emphasis completely. Instead of road numbers and facilities, it highlights a branching drainage network over shaded relief. Turkey Creek is labeled in the north. Coronaca Creek, Rocky Creek, Wilson Creek, and Brightmans Creek appear through the central part of the county, while Ninety Six Creek provides a long named reference toward the east. Farther south, the map labels Hard Labor Creek, Big Coldwater Creek, Beaverdam Creek, Cuffytown Creek, Horsepen Creek, and Halfway Swamp Creek.
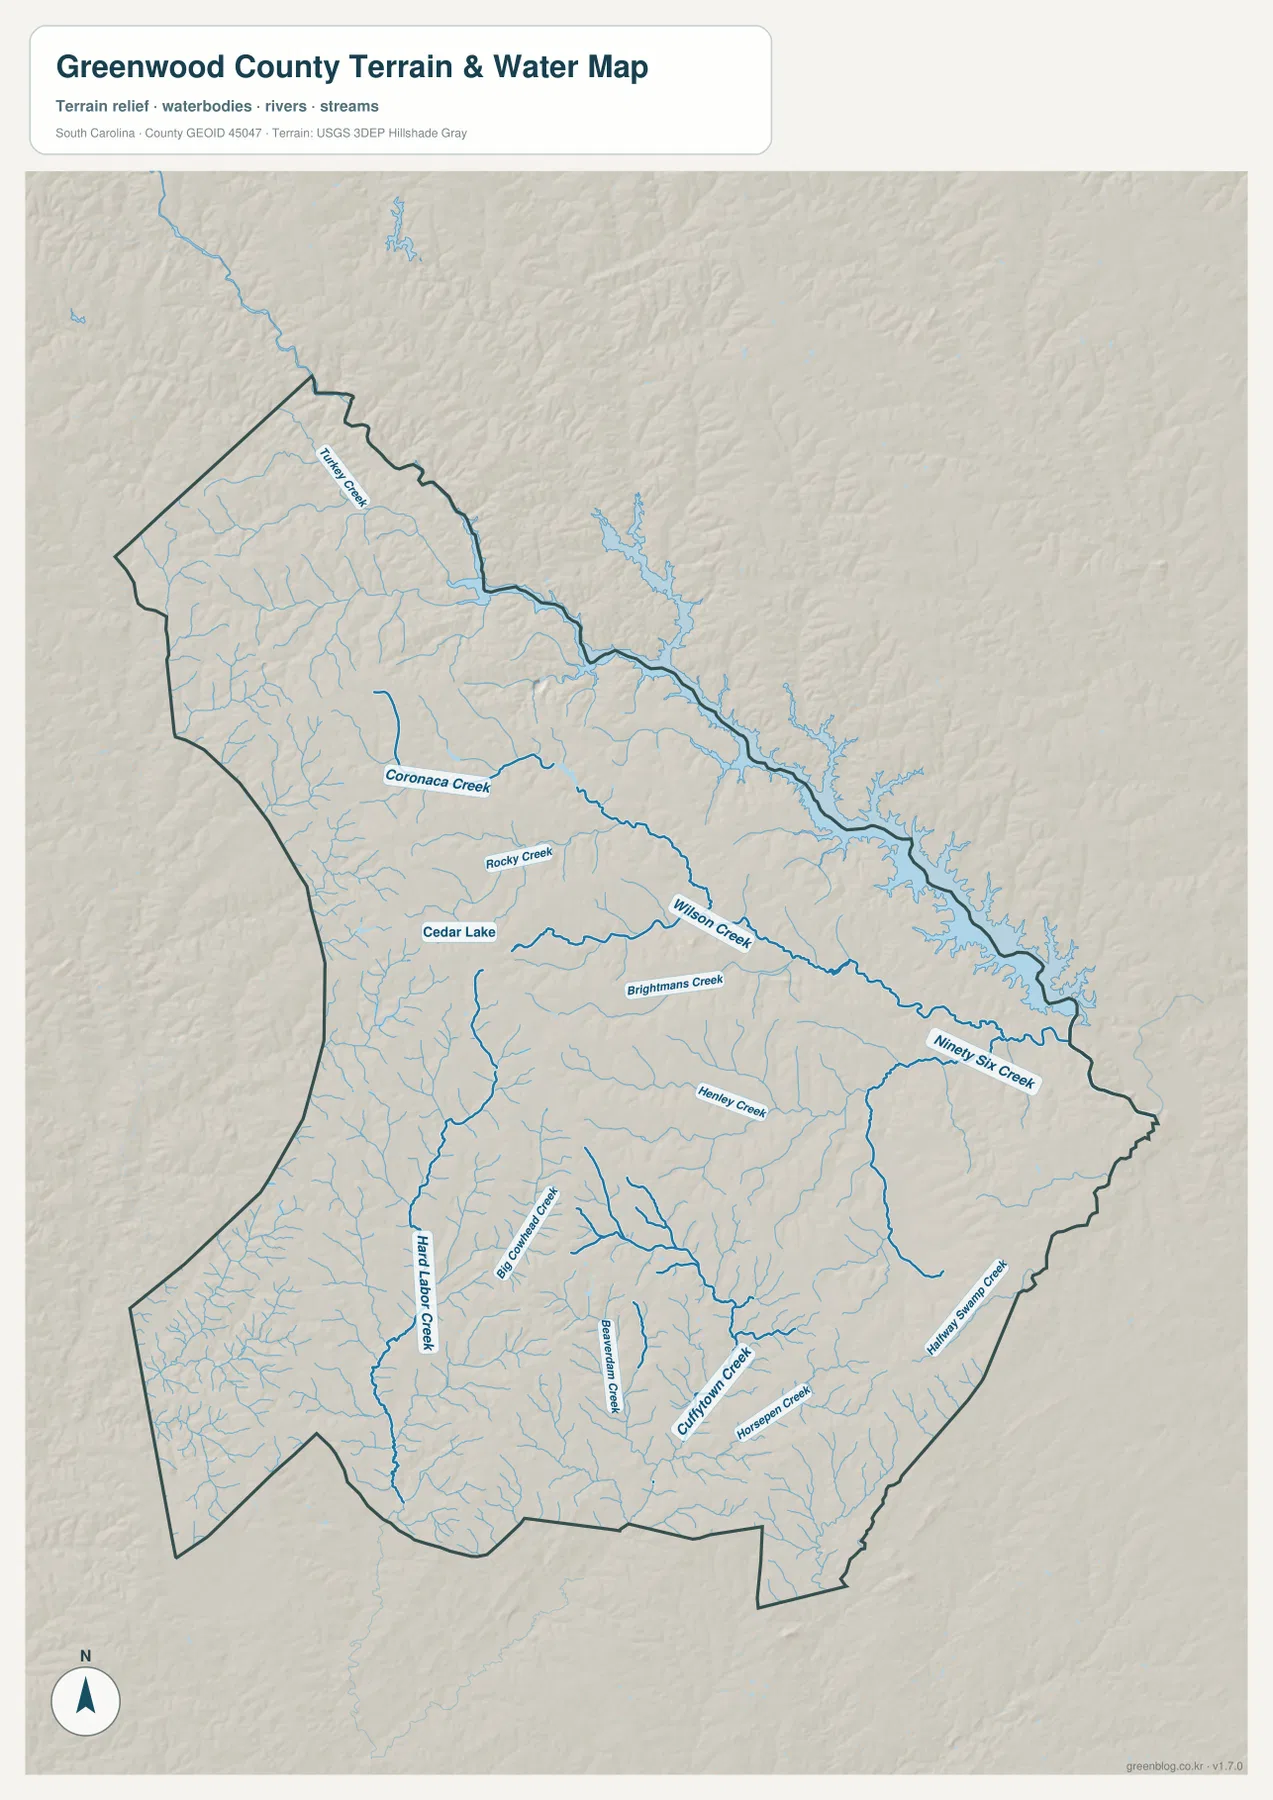
A large, irregular water surface follows much of the northeastern side of the county on this image. The package does not place a name directly on that water body, so the map is best read visually rather than assigning an unsupported label. Cedar Lake is named separately inside the county. Numerous smaller blue tributaries are also drawn without labels, which makes the overall drainage density much more apparent than it is on the road map.
The shaded background shows rolling relief rather than a flat plain. Greenwood County’s broad Piedmont setting is noted in the source package, and the map’s hillshade is consistent with a landscape of low ridges and shallow valleys. This is not a contour map and it does not provide exact elevation values, but the relief helps explain why the creeks form so many branching lines across the county.
Wilson Creek and Ninety Six Creek are especially useful for orienting the center and east, because their labels remain readable at normal page size. In the southern half, Hard Labor Creek and Cuffytown Creek provide different reference lines, with many unnamed tributaries between them. For a report about local water features, this view is more informative than the general road map because the drainage network is not competing with dozens of street and place labels.
The narrow north and long southwest give Greenwood County its distinctive outline
The county boundary is easy to recognize once Ware Shoals and Troy are used as opposite reference points. The northern part rises into a relatively narrow extension around Ware Shoals, while the southwestern side reaches down toward Troy. The eastern edge is more irregular, especially where the large water surface follows the boundary. These differences in width make the county look quite different depending on whether you focus on Greenwood itself or on the full outline.
The information preserved in the source package lists Greenwood as the county seat, a population figure of 69,351, a land area of 456 square miles, and a founding year of 1897. Those values are supporting context rather than features drawn on the maps. They are useful when Greenwood County is being compared with other South Carolina counties at the same printed size, because the physical size of an A3 image alone does not tell you the real land area.
| State | South Carolina |
|---|---|
| County | Greenwood County |
| County seat | Greenwood |
| Population in source package | 69,351 |
| Land area | 456 sq mi |
| Founded | 1897 |
| Broad physical setting | Piedmont |
The shape and the statistics answer different questions. The boundary tells you how the county extends around Greenwood, Ninety Six, Ware Shoals, and Troy, while the area figure provides a comparable measure that is independent of screen or paper size. Using both avoids a common problem with map collections: two counties can occupy similar amounts of space on a page even when their true land areas are not the same.
Choosing the right Greenwood County map for the task
Use the general county map when roads, communities, the county outline, and nearby references need to appear together. It is the best single-image overview because it includes Greenwood, Ninety Six, Ware Shoals, Hodges, Troy, Coronaca, Cokesbury, Promised Land, Bradley, and many numbered routes. The tradeoff is that more labels share the page, so this view takes a little longer to scan than the other two maps.
The city-connections map works better when the main question is the relative position of a few places. Greenwood serves as a clear hub, and the direction and direct-distance reference for each selected community can be explained without discussing every road. This makes it well suited to slides, school projects, or a short county profile where the audience needs a simple geographic layout.
Choose the terrain-and-water view when creeks and relief are more important than transportation. It shows Turkey Creek in the north, the central creek network, Ninety Six Creek in the east, and several named streams in the south, all over shaded terrain. It is useful for understanding the natural pattern beneath the road network, but it should not be treated as a flood-risk map, navigation chart, or surveyed property map.
The WEBP versions are optimized for reading on the page. When you need to inspect smaller labels, place a map in a document, or print it at a larger size, use the A3 JPG files in the download ZIP. The three JPGs cover the county-road view, the city-connections view, and the terrain-and-water view, so you can use only the one that matches your purpose or compare them side by side.
Frequently Asked Questions
How are Greenwood and Ninety Six positioned on the map?
Greenwood is the central hub, while Ninety Six lies to the east. The city-connections graphic gives a direct-distance reference of about 8 miles between them, and the general map shows the road network linking the two areas. The distance is a straight-line reference, not a driving measurement.
Which creeks are easiest to use as landmarks on the water map?
Wilson Creek and Ninety Six Creek are clear references through the central and eastern parts of the county. Turkey Creek is labeled in the north, while Hard Labor Creek, Cuffytown Creek, and several other named streams provide useful reference lines in the southern half.
Are the city-connection mileage values driving distances?
No. The legend identifies them as direct distances from Greenwood. Actual driving distances and travel times depend on the available roads and route chosen, so a current navigation service should be used for trip planning.
Map File Information
The ZIP contains three high-resolution A3 JPG maps for Greenwood County: the county-and-roads map, the city-connections map, and the terrain-and-water map. Use them when you need a larger image than the WEBP previews shown in the article.
- Included Files: 3 high-resolution A3 JPG maps: county and roads, city connections, and terrain/water
- File Type: JPG files in a ZIP archive
- Intended Use: Printing, education, presentations, and map-based projects
Related Maps
Sources and Reference Data
This article is based on the map images and Greenwood County facts preserved in the supplied package. The following official resources are useful for understanding the boundary, hydrography, and elevation data types represented by the maps.
- South Carolina Association of Counties – County Information: county reference information
- U.S. Census Bureau TIGER/Line Shapefiles: county boundaries and administrative geography
- USGS National Hydrography: rivers, creeks, and water features
- USGS 3D Elevation Program: elevation and terrain data framework
Green Map creates custom-edited map images using open geographic data sources such as geoBoundaries, Natural Earth, OpenStreetMap, and government open data.
These maps are edited visual materials, not raw data files, and are provided for education, documents, presentations, and graphic reference.