Minidoka County has a very clear 2025 land-cover split: a broad agricultural grid fills much of the southern county, while shrubland and grassland take over across the long northern section. Agriculture is the largest mapped class at 41.19%, followed by shrubland at 27.22% and grassland at 23.64%. Developed land accounts for 5.34% and is most visible around the southern population centers. The four maps on this page let you compare that current pattern with a simplified farm-and-open-land view, impervious surfaces, and mapped class differences between 1985 and 2025.
The four supplied JPG maps are available together in one ZIP. They are useful for screen comparison, printing, classroom reference, presentations, and county-scale environmental review. Land cover describes what the ground surface was classified as in satellite-based data—such as agriculture, shrubland, grassland, water, or developed land. It is not a parcel map and does not establish zoning, ownership, development rights, or the legal use of any property.
Table of Contents
A southern farm grid gives way to shrubland and grassland across the long northern section
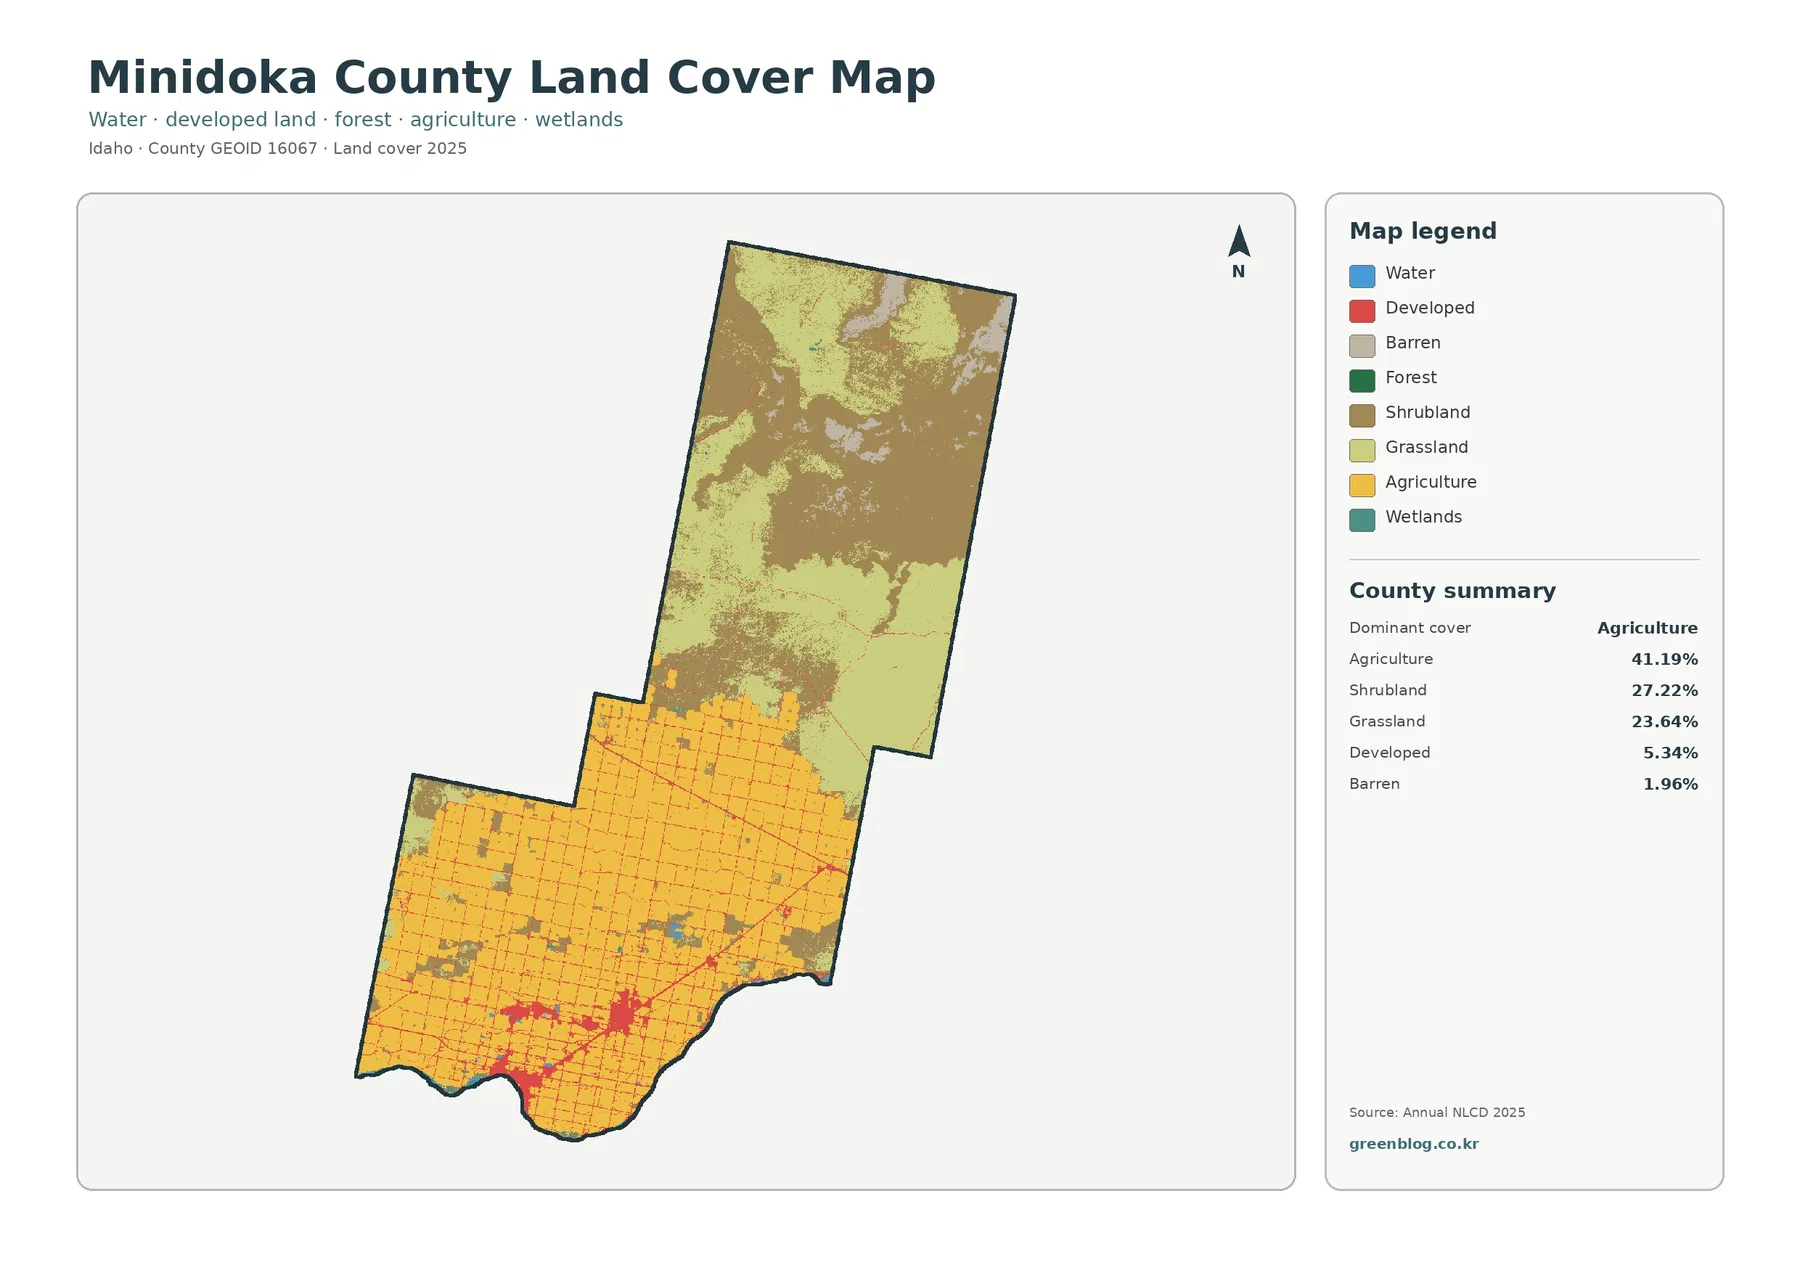
The general land-cover map makes the county’s strongest contrast easy to see before any numbers are read. Yellow agricultural cells dominate the lower half, where large rectangular blocks and straight boundaries repeat across a broad area. In the county summary, agriculture covers 41.19%. The pattern is not evenly scattered through Minidoka County; it forms a large, continuous working landscape in the south and then becomes much less common as the county narrows and extends northward.
North of that farmed zone, shrubland becomes one of the main colors. It covers 27.22% of the county. Grassland adds another 23.64%, so the two open-land classes together make up slightly more than half of the mapped area. They do not appear as two perfectly separated regions. Instead, broad shrub-dominated patches meet and intermingle with grassier areas, especially through the transition zone between the agricultural south and the more open northern interior.
Developed land represents 5.34%, and most of the clearly visible red is concentrated in the south. Barren land is listed at 1.96% and appears in smaller patches, especially where open land and agriculture meet. Water and wetlands occupy much smaller shares, but they provide useful geographic reference along the southern edge and in a few scattered low areas. Reading all of these classes together gives a more realistic picture than treating Minidoka County as only an agricultural county or only an open rangeland county.
The Snake River edge and Rupert-area settlement help orient the agricultural half of the county
Minidoka County’s official city page lists Rupert as the county seat and also identifies Heyburn, Paul, Acequia, and Minidoka among the county’s communities. The land-cover map does not label those city names, but the developed pattern in the southern part of the county can be understood more clearly with that local context. The largest developed cluster is centered around the Rupert area, with smaller clusters and narrow transportation lines extending through the surrounding farm grid.
A county wildfire-mitigation plan describes the Snake River as the major river forming the county’s southern border and also names Lake Walcott and Milner Reservoir among important water bodies. Those details help explain why the lower edge of the map is a useful anchor when comparing water, agriculture, and settlement. The map itself is not a hydrography map, however. A small blue or wetland-colored cell should not be assigned to a named river, reservoir, canal, or spring unless a separate water-layer source confirms it.
The county’s official history also documents the Minidoka Project and the expansion of irrigated land during the twentieth century. That history fits the broad geometric agricultural pattern visible in the present-day map, but it should not be used to identify an individual field or irrigation facility. The NLCD view shows surface classes at county scale. Field ownership, canal service areas, crop type, and water rights require different datasets.
The forest-and-farmland view highlights something unusual: forest rounds to 0.00%
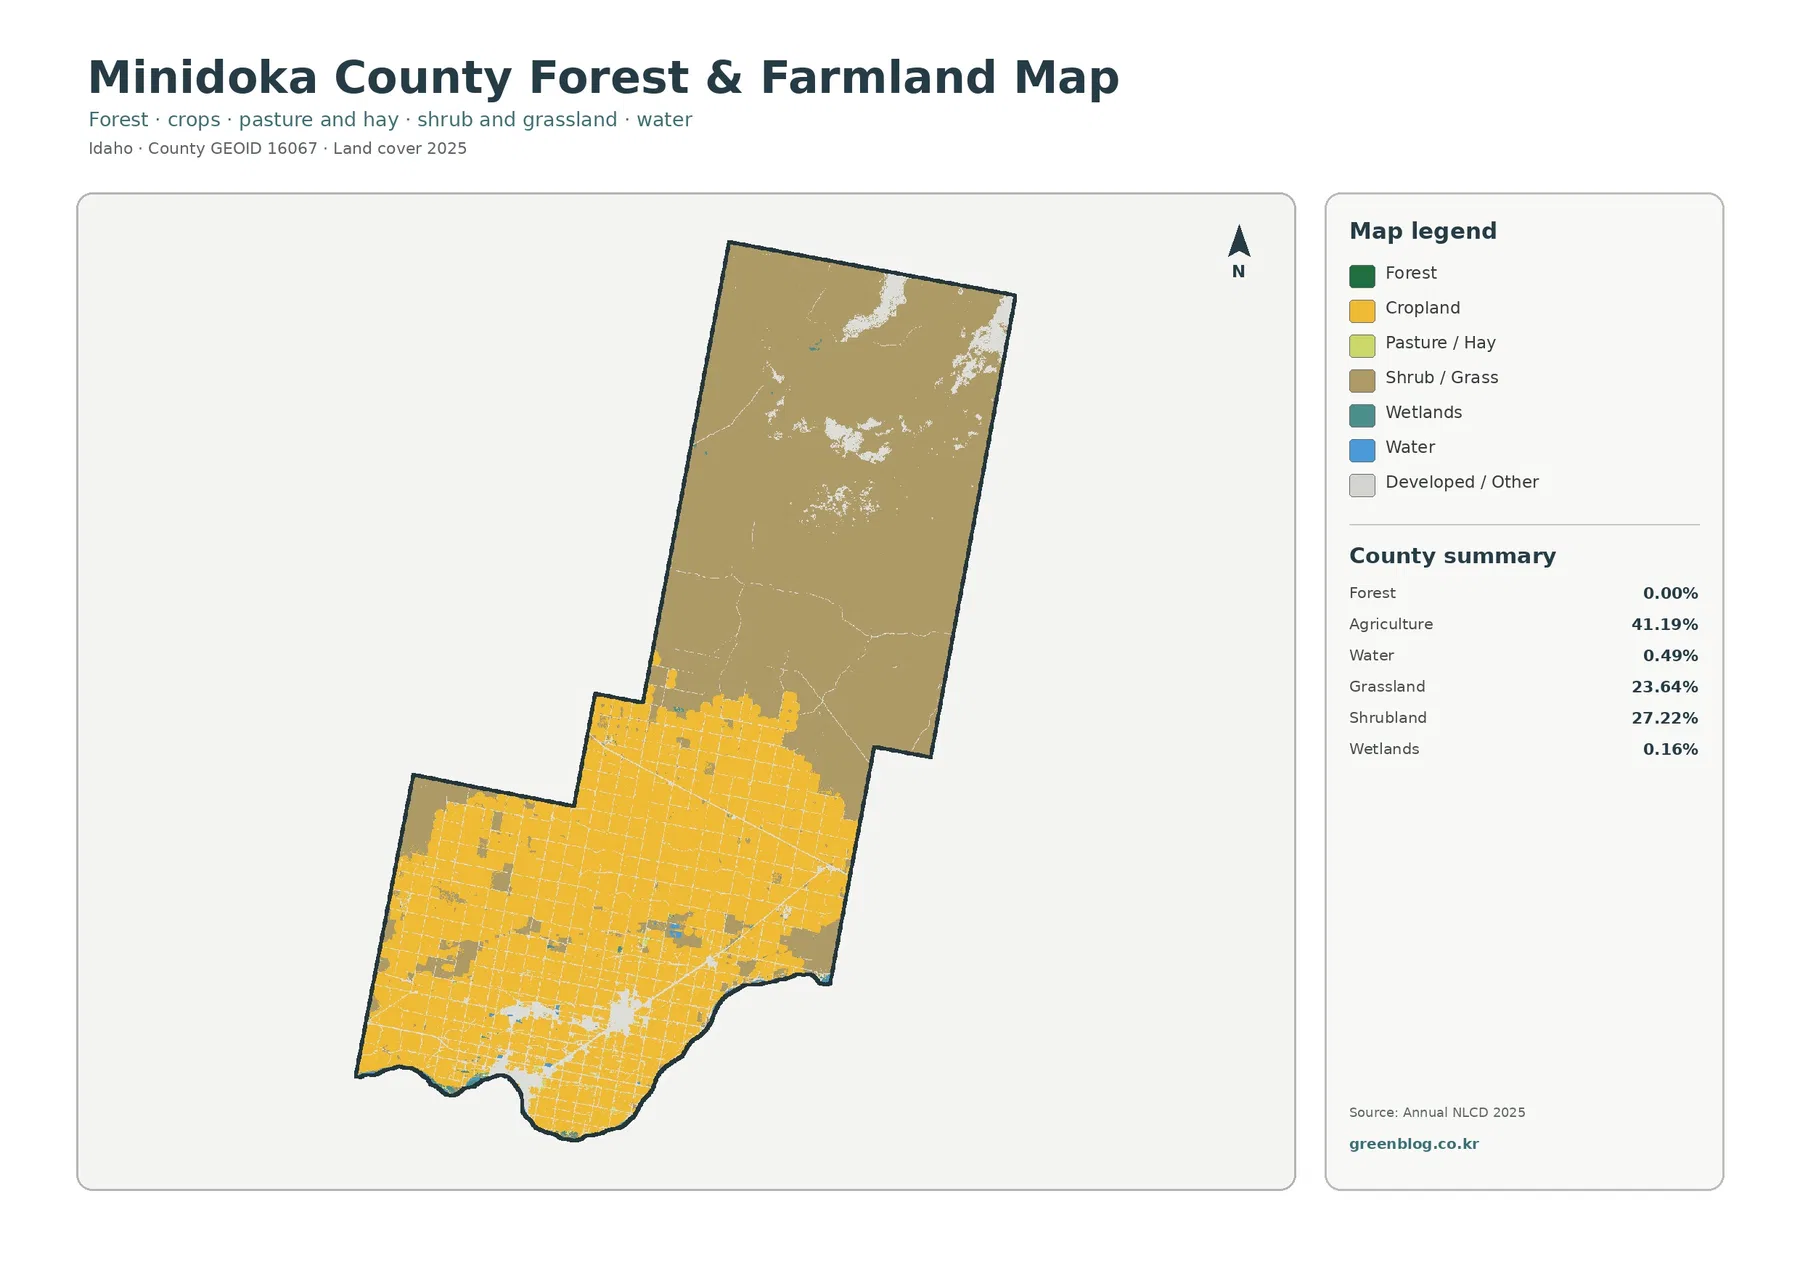
The simplified forest-and-farmland map reduces the number of visible categories so that farmed land, shrub/grass cover, water, wetlands, forest, and developed/other areas are easier to compare. Its county summary reports forest at 0.00%. That figure should not be read as a literal statement that no trees exist anywhere in Minidoka County. It means that forest-class area rounds to 0.00% in this 2025 classification summary. Narrow tree rows, small wooded patches, or mixed pixels may be absorbed into other classes at 30-meter resolution.
Agriculture remains 41.19%, and the large yellow blocks cover most of the southern portion. North of the farm belt, shrubland at 27.22% and grassland at 23.64% form the dominant background. Water is 0.49% and wetlands are 0.16%. Those smaller percentages are easy to overlook in a table, but their locations matter because water and wet ground can interrupt the otherwise regular agricultural geometry near the southern boundary and around scattered low areas.
University of Idaho Extension in Minidoka County provides research-based agricultural information to growers, including crop production and farm-management support. That county-specific source confirms the importance of agriculture to the local setting, but it does not turn this map into a crop map. The yellow agricultural class does not distinguish potatoes from wheat, sugar beets, hay, beans, or other crops. Anyone needing crop-by-crop acreage should use an agricultural statistics product or a crop-specific land-cover layer in addition to this page.
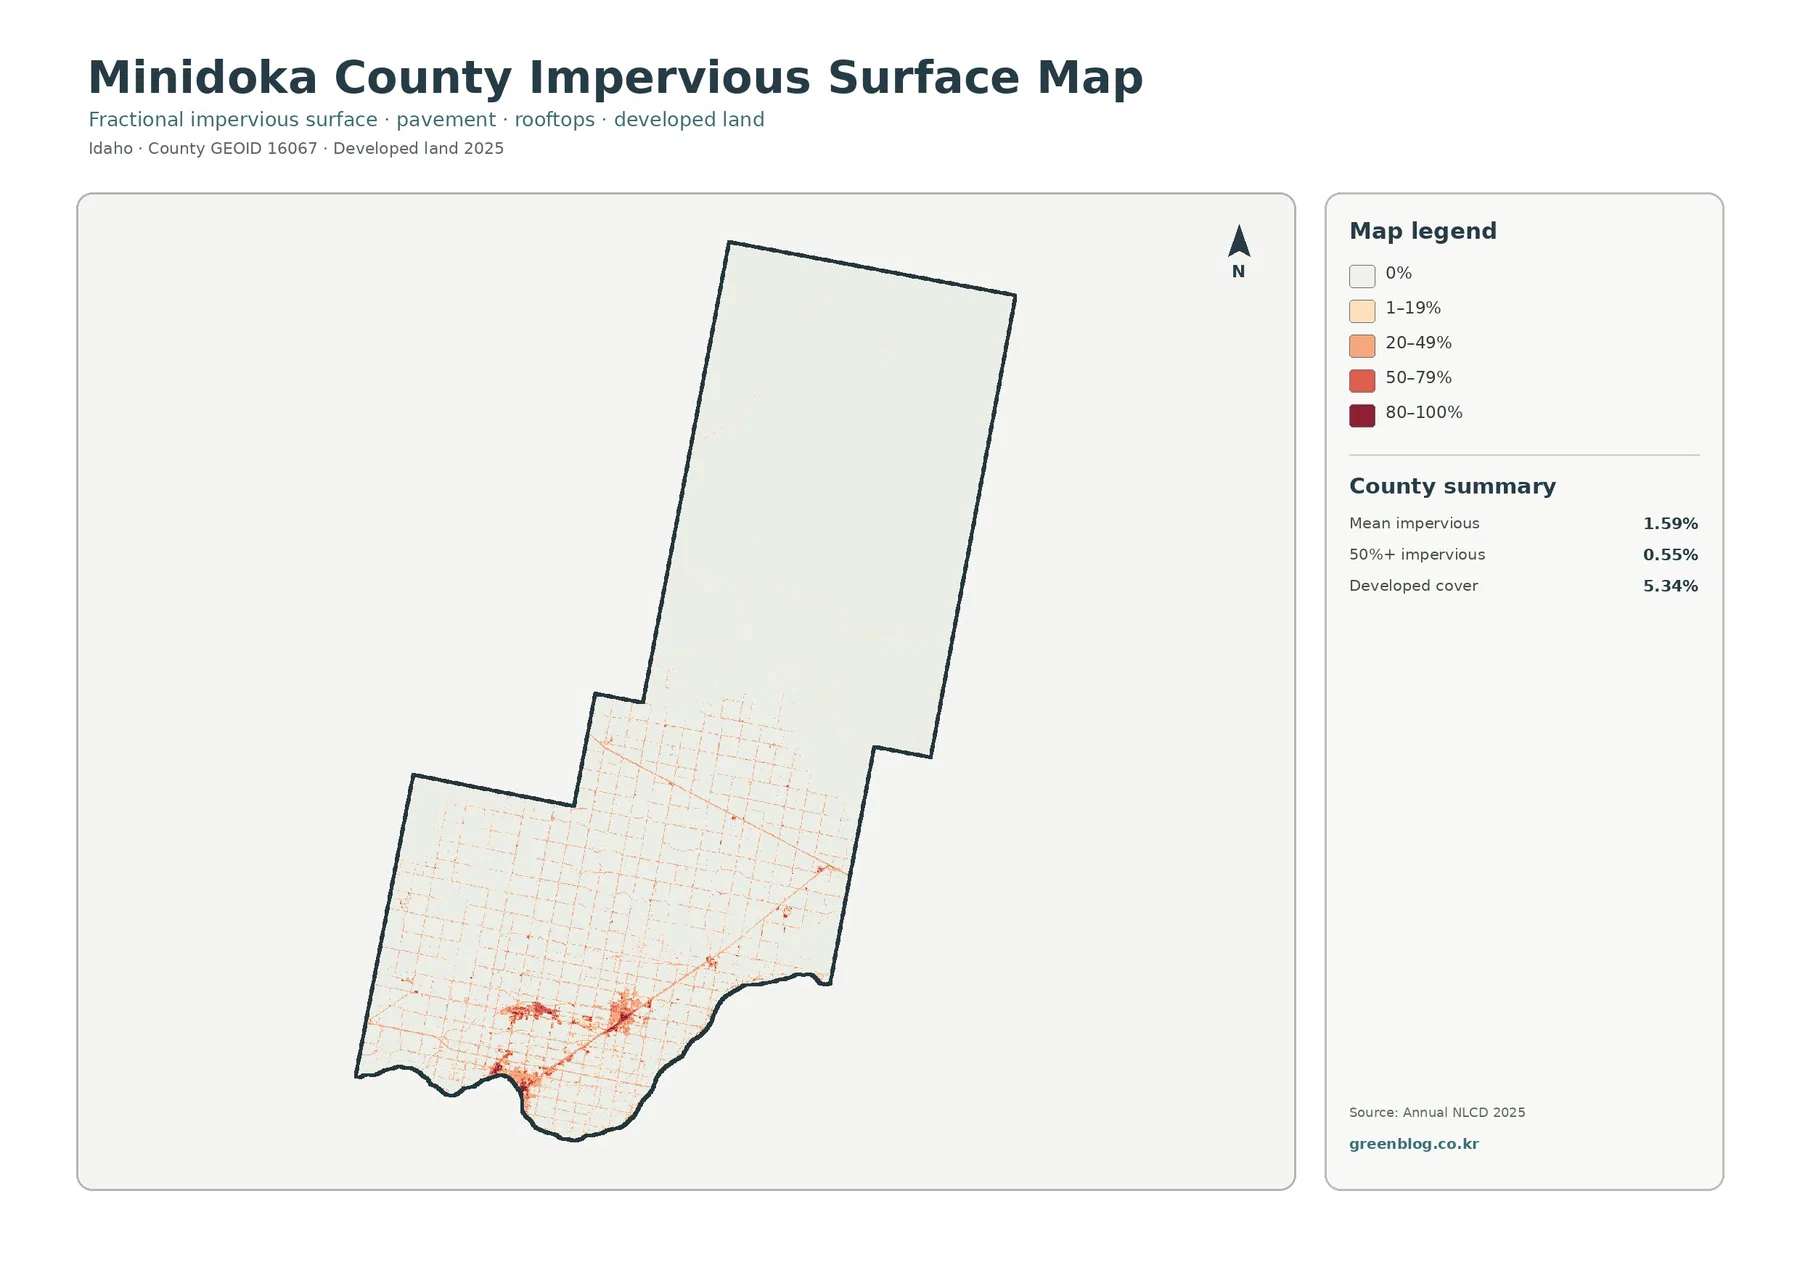
Impervious surfaces stay low countywide but form a distinct concentration around the southern cities
Impervious cover measures hard surfaces that limit infiltration, including rooftops, pavement, parking areas, and similar built materials. Minidoka County’s mean impervious value is 1.59%. Only 0.55% of the county has impervious cover above 50%. Those numbers are small because most of the county consists of agriculture, shrubland, grassland, or other nonurban surfaces rather than continuous built-up land.
The map still shows a strong local signal. Darker orange and red values cluster around the Rupert area in the south, and narrow lower-value lines follow roads through the agricultural grid. Smaller built concentrations appear elsewhere within the southern farm belt as well. Once the map moves north into the shrubland and grassland section, high impervious values become very rare. That makes the difference between the settled south and the open northern interior easier to see than it is on the multicolor land-cover map.
Developed land and impervious cover should not be treated as interchangeable measurements. Developed land occupies 5.34%, while mean impervious cover is only 1.59%. A developed pixel may include lawns, bare soil, trees, or other permeable surfaces around buildings. Conversely, a thin road can appear as impervious cover without creating a large developed-land patch. Comparing the two maps side by side is more informative than trying to substitute one statistic for the other.
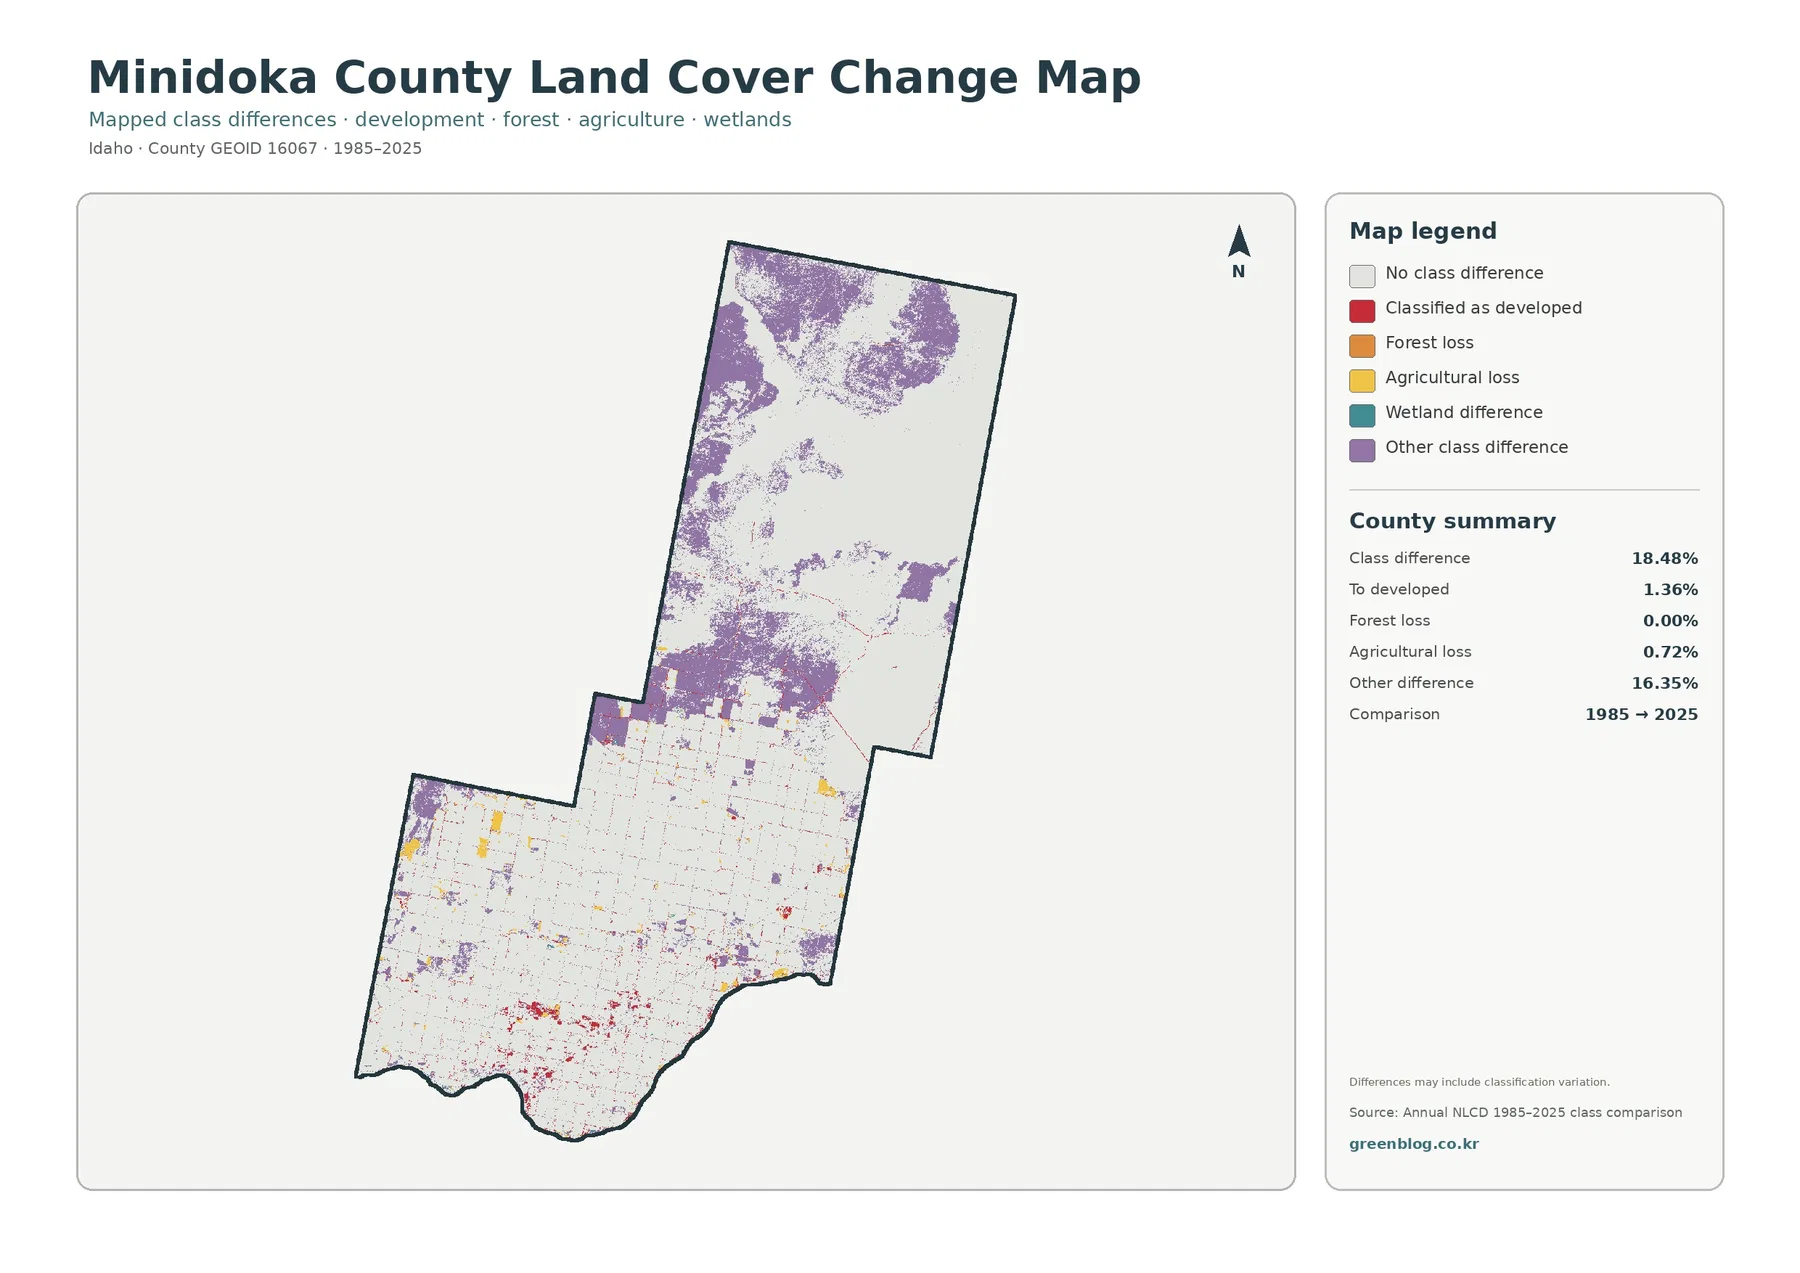
Most of the 18.48% 1985–2025 class difference is labeled as other class difference
The change map compares the land-cover class assigned to the same locations in 1985 and 2025. The county summary reports a total class difference of 18.48%. Within that total, 16.35% is categorized as other class difference. Areas classified as developed account for 1.36%, agricultural loss for 0.72%, and forest loss for 0.00%. The legend also includes wetland difference, but the summary panel does not provide a separate percentage for it, so no additional value should be invented.
Purple other-difference cells are the dominant change color. They cover broad pieces of the northern shrub/grass landscape and also occur around the northern edge of the agricultural zone. That category does not describe one specific land conversion. In open landscapes, boundaries between shrubland and grassland can shift between classifications, and some differences can also reflect sensor, processing, or classification changes. The map itself warns that mapped differences may include classification variation.
Red cells classified as developed are much more concentrated in the southern settlement zone and along transportation corridors. Yellow agricultural-loss cells are smaller and more scattered through the farm belt. These locations can identify places worth investigating, but the 1985–2025 comparison alone cannot establish when a change happened or why. Intermediate Annual NLCD years, historical aerial imagery, and local planning records are needed to separate persistent land conversion from classification noise.
A practical reading order: farms first, built surfaces second, change last
For a first look at Minidoka County, begin with the general land-cover map and identify three anchors: the large agricultural zone in the south, the main developed cluster around Rupert, and the shrubland/grassland-dominated north. Once those are familiar, move to the simplified farm view to see how sharply the agricultural footprint stands out when fewer classes are shown. This approach prevents the reader from losing location when the legend changes from one map to the next.
Use the impervious map when the question is about built intensity rather than land-cover category. The southern city centers and road network become more obvious there, while fields and open land remain pale. Use the change map only after the current pattern is clear. Because 16.35% of the 18.48% total difference falls in the broad other-difference category, that map requires more caution than the current land-cover view.
For printing or presentation, keep the legend visible and retain the year in the map title. Shrubland and grassland cover large areas and can look similar when reduced or printed in grayscale. The change map has an additional risk: light no-difference areas and purple other-difference areas can be misunderstood if the legend is cropped. A complete map with its legend and source line is more useful than a clipped image when several counties are being compared.
Thirty-meter classification is useful for county patterns, not parcel decisions
Annual NLCD is based on Landsat-scale information and represents land cover in 30-meter raster cells. A single cell can contain more than one real-world surface: part of a field, a road, a canal edge, a building, and vegetation may all occur within the same footprint. The classification assigns a mapped class rather than reproducing every small feature. That limitation matters in Minidoka County because the southern farm landscape contains many narrow roads, field edges, irrigation features, and small developed sites.
The percentages on this page are therefore appropriate for describing broad county patterns. They should not be used to decide whether an individual parcel is agricultural, whether a field grows a particular crop, or whether land can be developed. The 1.59% mean impervious figure is also a county-scale statistic rather than the paved percentage of a specific property. Parcel boundaries, zoning, permits, irrigation service, and ownership should be checked with the relevant county or state records.
Frequently Asked Questions
What is the largest 2025 land-cover class in Minidoka County?
Agriculture is the largest class at 41.19%. It forms a broad grid across the southern county, while shrubland at 27.22% and grassland at 23.64% dominate much of the north.
Does the 0.00% forest value mean there are no trees in Minidoka County?
No. It means forest-class area rounds to 0.00% in this 2025 county summary. Small tree rows or mixed pixels may be assigned to other classes or may be too limited to appear after rounding at 30-meter resolution.
Is the 18.48% class difference the same as confirmed land conversion from 1985 to 2025?
No. Other class difference accounts for 16.35% of the total and may include classification variation. The 1.36% classified as developed and 0.72% agricultural loss are useful indicators, but intermediate years and aerial imagery are needed to confirm timing and causes.
Map File Information
The four Minidoka County land-cover JPG maps are provided together in one ZIP file.
- Included Versions: land cover, forest & farmland, impervious & developed land, and land-cover change
- File Type: ZIP containing four JPG files
Related Maps
Sources and References
- MRLC – Annual NLCD Data (official source for the 2025 land-cover data and the 1985–2025 class comparison)
- U.S. Geological Survey – Annual NLCD Land Cover Classification (official explanation of land-cover classes and the 30-meter classification framework)
- University of Idaho Extension – Agriculture in Minidoka County (county-specific agricultural and grower-support context)
- Minidoka County – Cities in Minidoka County (official list including Rupert, Heyburn, Paul, Acequia, and Minidoka)
- Minidoka County – History (official county history describing the Minidoka Project and the expansion of irrigated land)
Green Map creates custom-edited map images using open geographic data sources such as geoBoundaries, Natural Earth, OpenStreetMap, and government open data. These maps are edited visual materials, not raw data files, and are provided for education, documents, presentations, and graphic reference.