Lawrence County sits in the rugged eastern part of Kentucky, where narrow valleys, wooded ridges, and the Big Sandy river system shape both settlement and travel. Louisa anchors the eastern side of the county near the West Virginia line, while Blaine lies farther west among branching creeks and hill roads. This page brings those relationships together with separate county, city, water-and-terrain, and elevation views. The original high-resolution JPG map files are also available in the download box later on the page.
The U.S. Census Bureau lists 415.6 square miles of land in Lawrence County and identifies its neighbors as Carter, Boyd, Elliott, Morgan, Johnson, and Martin counties in Kentucky plus Wayne County in West Virginia. That boundary list is useful, but the maps add the part that a table cannot show: a long, irregular county outline, a river-oriented eastern edge, and a dense pattern of small valleys cutting through the interior.
Table of Contents
A county shaped by Louisa, valley roads, and an irregular mountain boundary
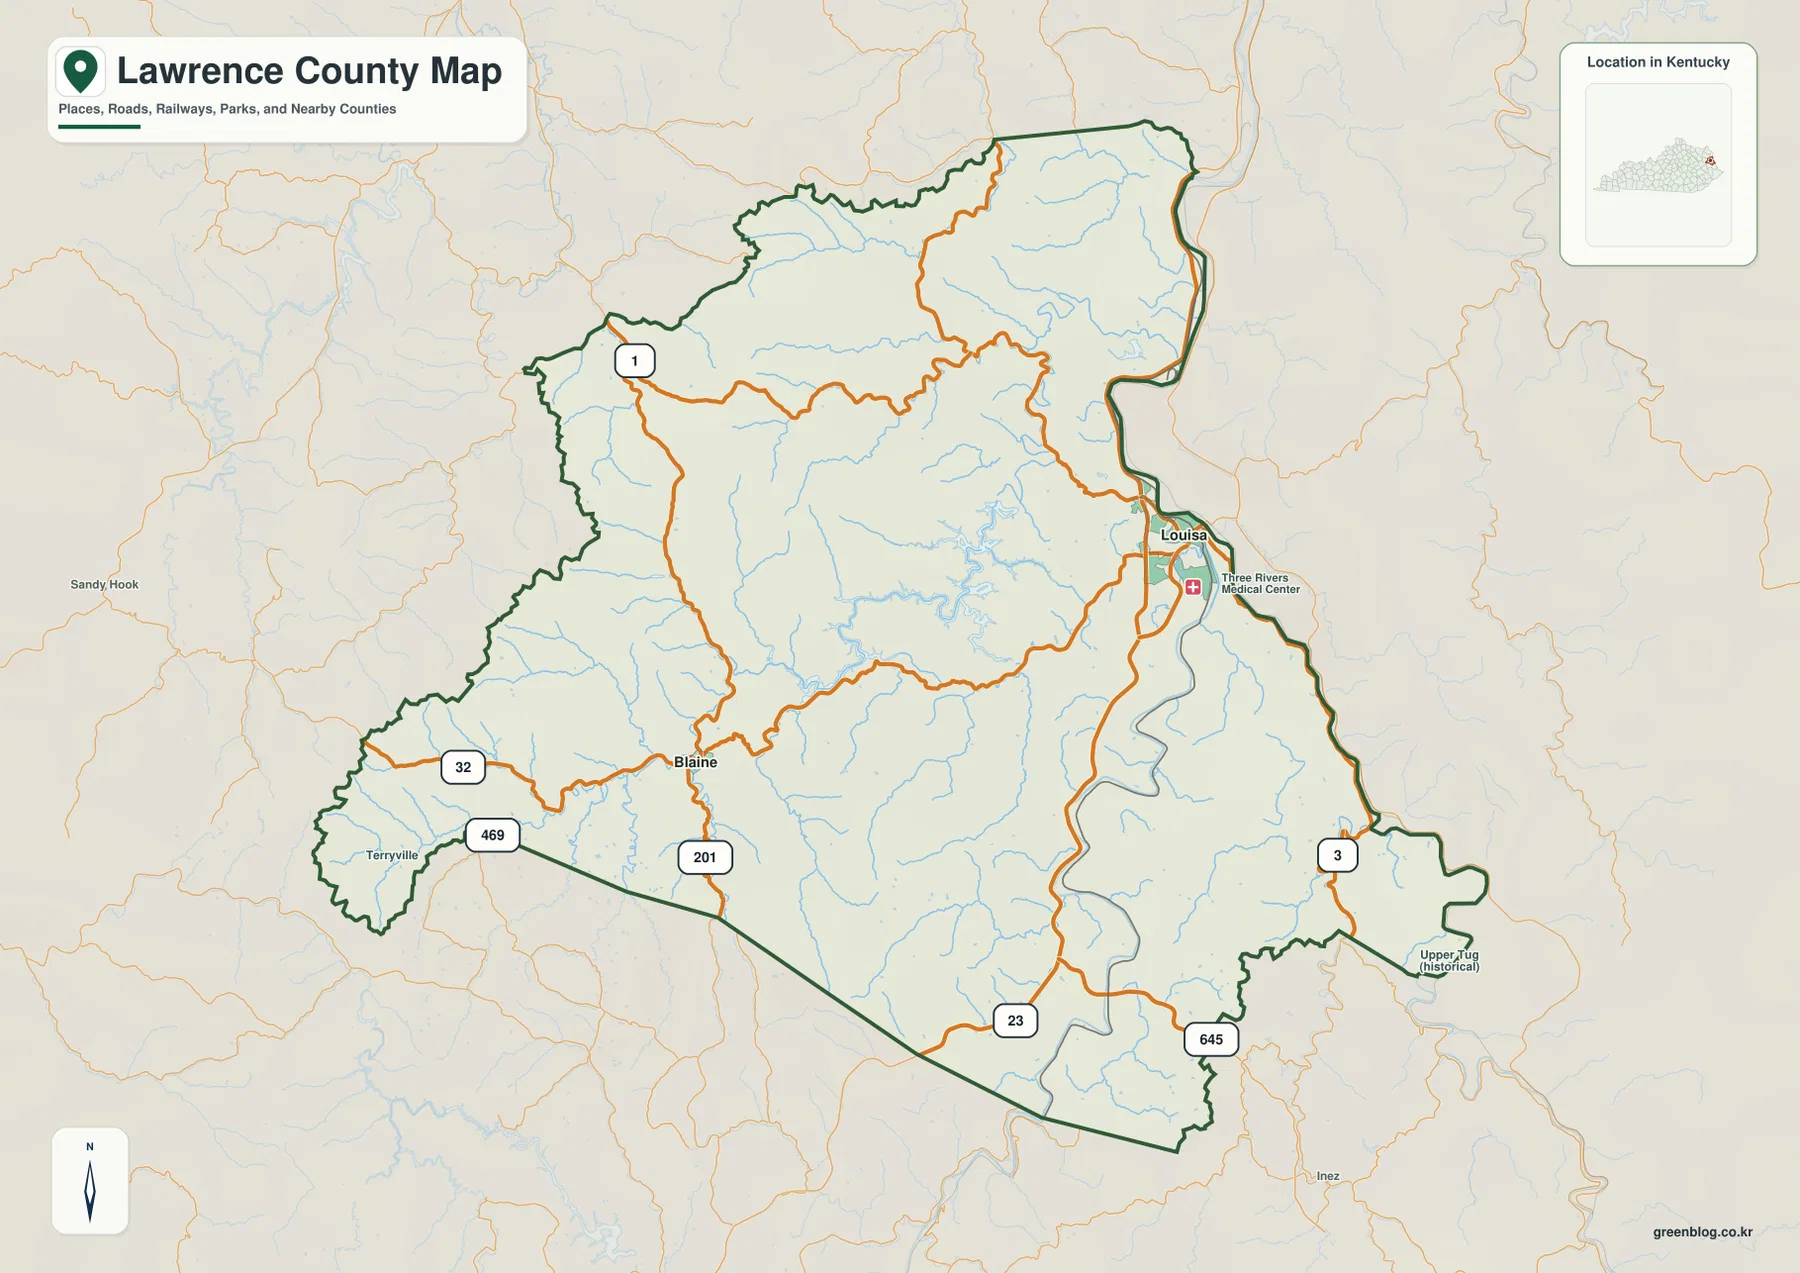
The general county map places Louisa close to the eastern edge, where the strongest cluster of roads and services appears. Route 23 and numbered routes 3, 32, 201, 469, 645, and 1 are visible in the map set, giving a quick sense of how the road network reaches from the river side of the county into the western hills. Blaine appears west of center, connected by roads that follow the terrain rather than cutting across it in a simple grid.
The county outline itself helps explain why orientation can be difficult without a map. The northern and western edges bend around a series of ridges and drainage divides, while the southern boundary stretches diagonally across a broad band of hill country. On the east, the Kentucky–West Virginia setting becomes especially important near Louisa. This is a reference map for county-scale orientation, not a parcel, zoning, property-line, or legal survey product.
Louisa and Blaine as two practical anchors inside the county
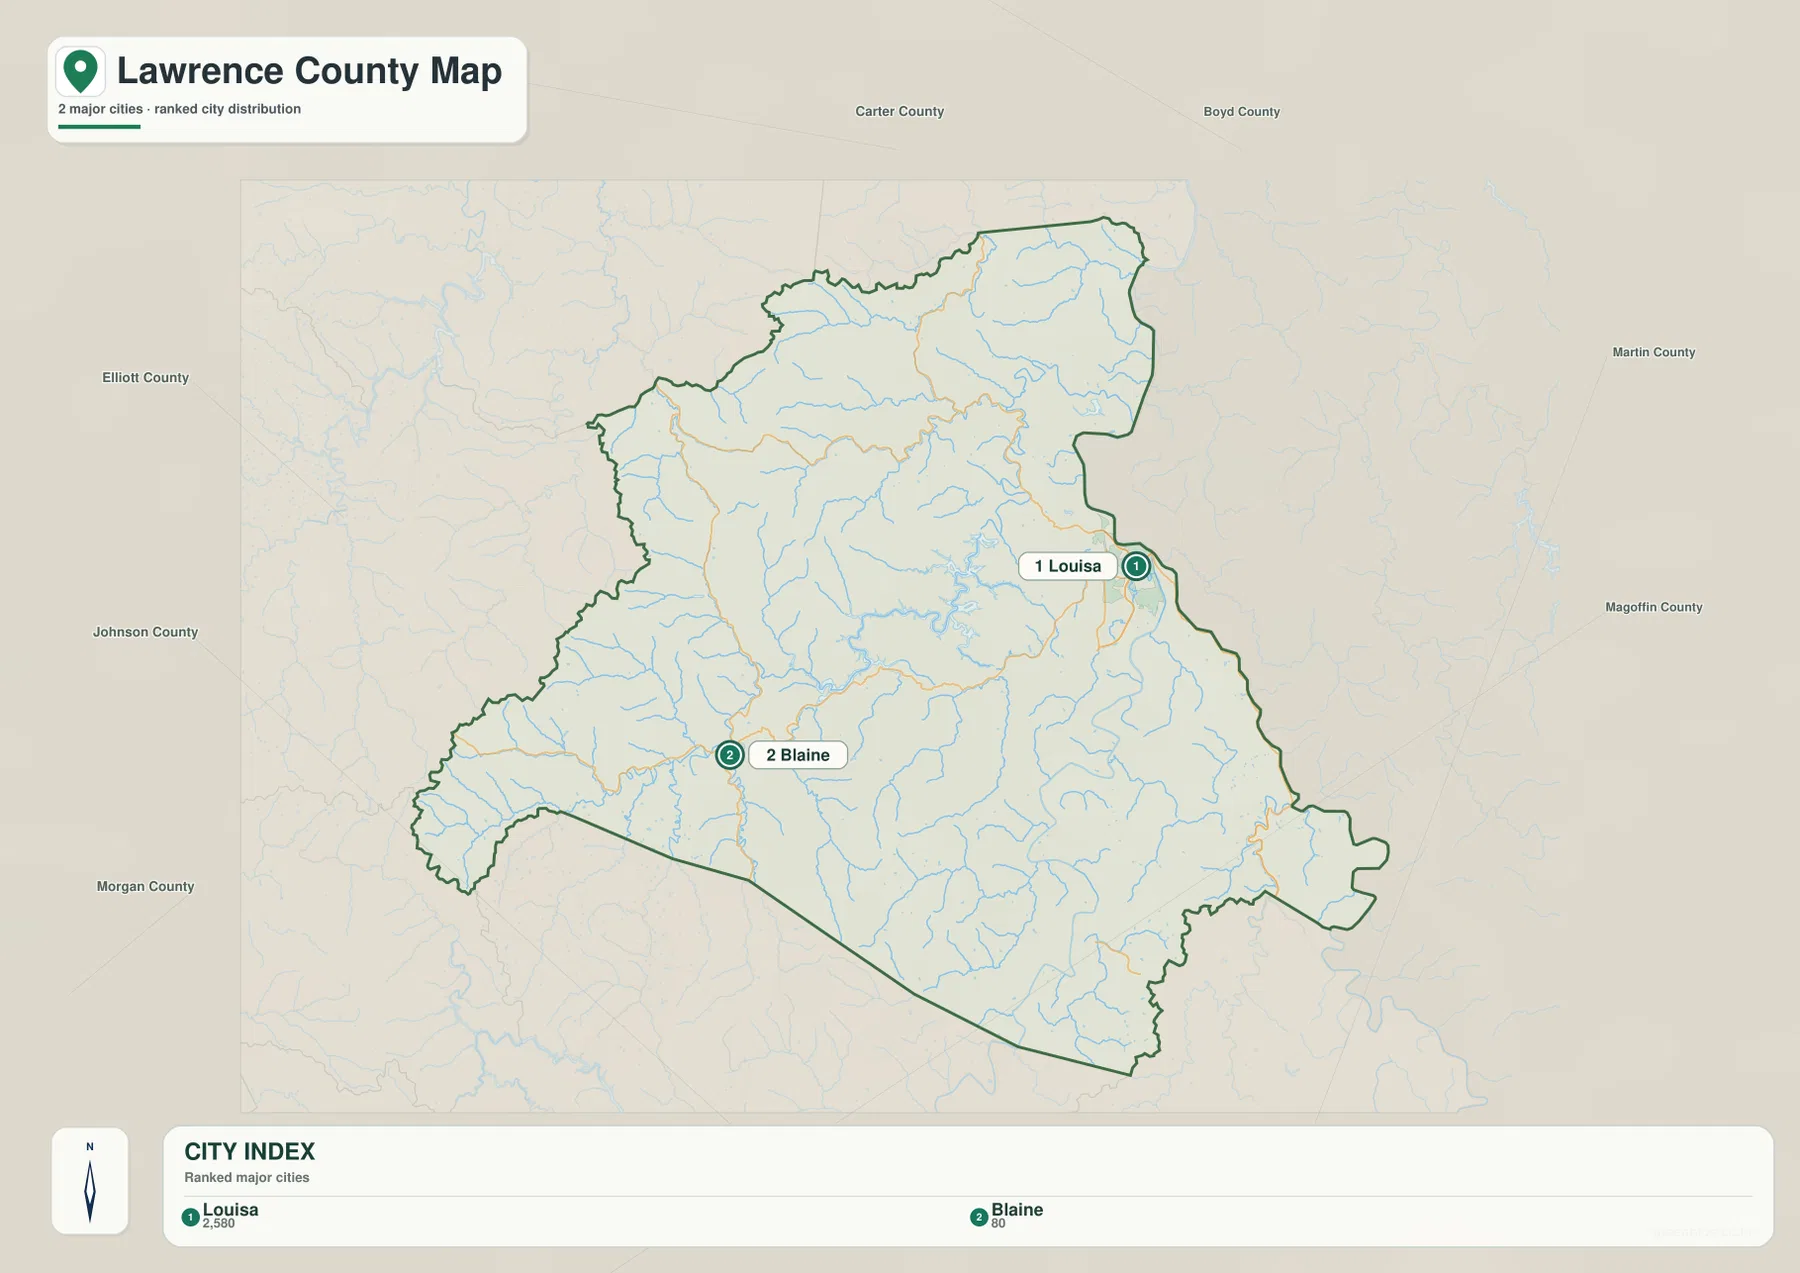
The city map deliberately keeps the settlement view simple. Its City Index ranks Louisa first and Blaine second, making the two places easy to locate without the heavier road labeling of the county map. Louisa is positioned on the east side beside the major river system, while Blaine sits well inland to the west. That contrast is useful for anyone trying to understand the county as more than a single river town.
Louisa is also the best place to connect the settlement map with the hydrography. The Kentucky Department of Fish & Wildlife explains that the Levisa Fork reaches Louisa and meets the Tug Fork there to form the Big Sandy River. This makes the city a natural reference point for the county’s eastern edge and for connections toward West Virginia. Blaine, by comparison, is tied more closely to the network of interior creeks and valleys that spread through the western half of the county.
The city index should be read as a locator built for this map package rather than as a substitute for current demographic tables. For population, housing, or economic comparisons, the latest Census products are the better source. For a classroom worksheet, travel orientation, or a quick answer to “where are Louisa and Blaine within Lawrence County,” this stripped-down view is much easier to scan.
Levisa Fork, Blaine Creek, and the smaller streams between the ridges
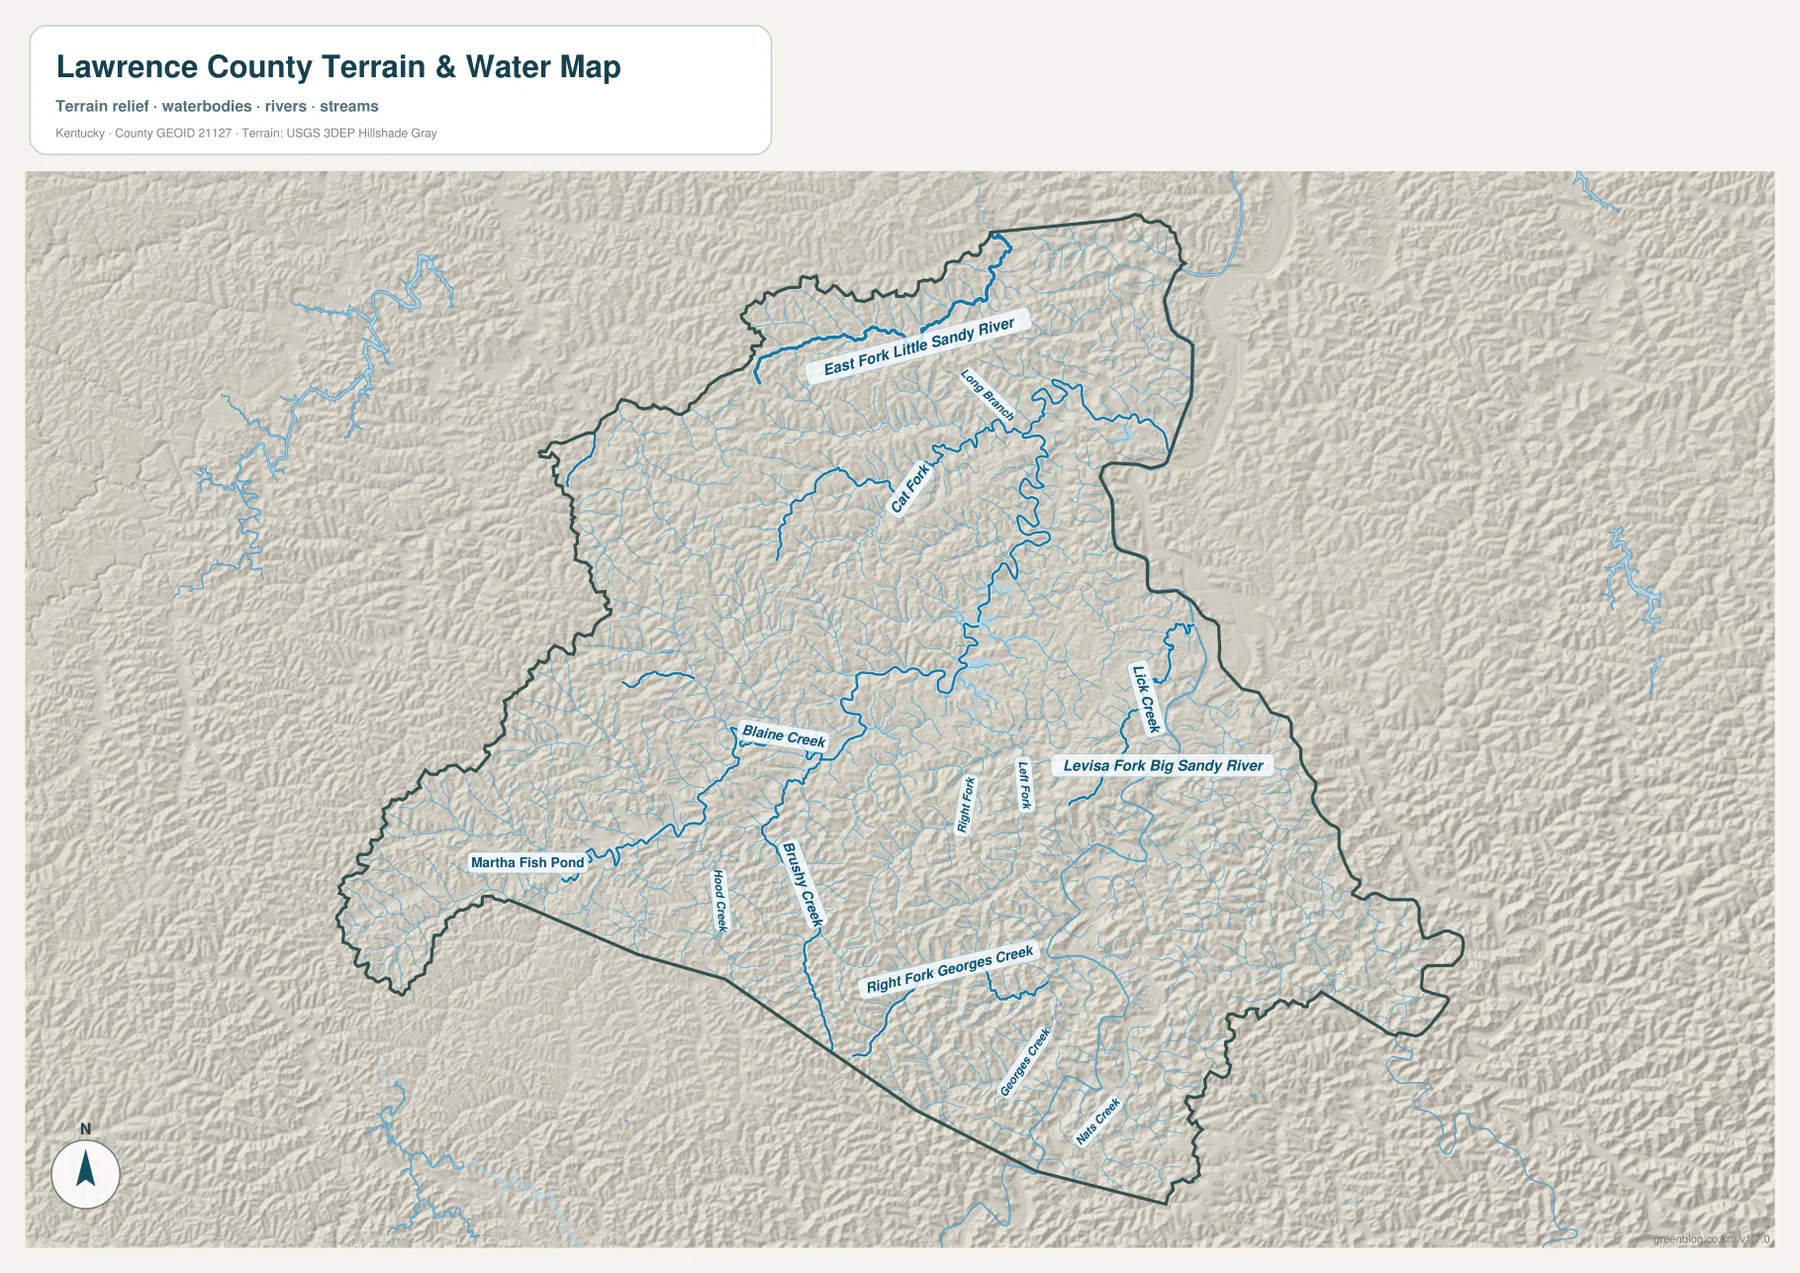
The terrain-and-water map shows why Lawrence County looks so dissected on the elevation view. The Levisa Fork of the Big Sandy River is labeled along the eastern side, while the East Fork Little Sandy River appears across the north. Inside the county, labels such as Cat Fork, Blaine Creek, Burchey Creek, Georges Creek, and other smaller forks trace narrow valleys that repeatedly divide the uplands.
Martha Fish Pond is marked in the western part of the county, and Blaine Creek provides an easy reference for following drainage east and west of the Blaine area. In the central and southern sections, short tributaries branch off in many directions. That pattern matters because roads and settlements in Appalachian terrain commonly follow the available valley floor; viewing the streams next to the road map helps explain bends that would otherwise look indirect.
This layer is a geographic reference for rivers, creeks, ponds, and terrain relief. It is not a flood-hazard map, it does not identify FEMA flood zones, and it should not be used to decide whether a stream is navigable or safe to cross. Anyone needing authoritative hydrography can use the USGS National Hydrography resources linked in the references section.
An elevation surface of narrow hollows and repeated ridge lines
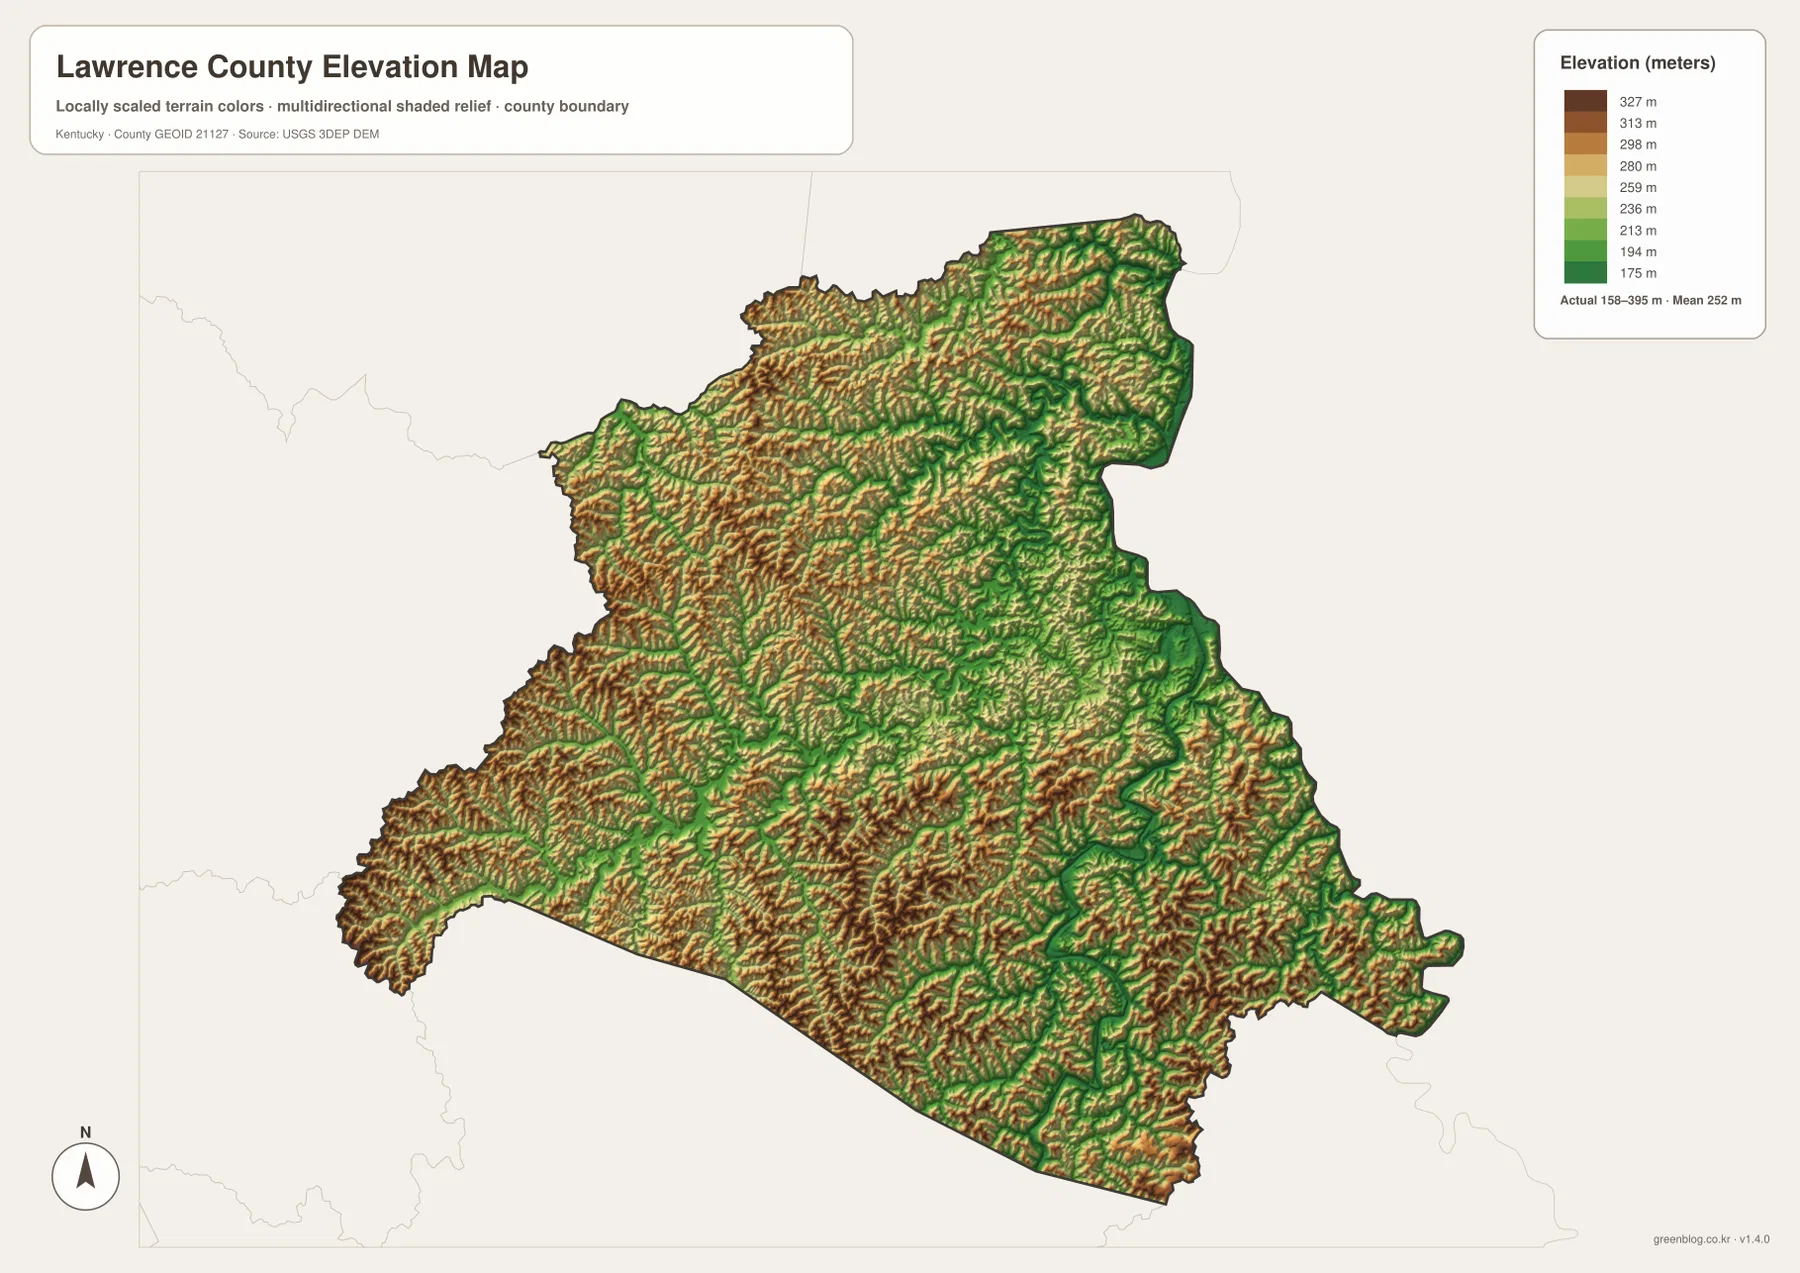
The supplied elevation map reports an actual range of about 158 to 395 meters and a mean elevation of about 252 meters. Rather than showing one dominant mountain mass, the surface is broken into many short ridge lines separated by lower creek valleys. The lower green corridors generally follow the drainage network, while browns and tan shades pick out higher ground on ridge tops and steeper slopes.
Around the eastern river corridor, lower elevations form a clearer linear path. Moving west and southwest, the terrain becomes a tight mix of rises and hollows, and the same kind of relief appears through much of the central county. The color transitions can be quite close together, which is a visual reminder that local travel distance and straight-line distance are not always equivalent in this landscape.
The elevation surface is generalized for county-scale viewing. It is useful for understanding where ridge country dominates, where valleys open along streams, and why roads curve around steep terrain. It is not a survey-grade elevation product and should not be used for engineering, construction staking, drainage design, or site-specific legal decisions. USGS 3D Elevation Program data are the appropriate starting point for more detailed elevation work.
Reading the road map together with water and elevation
The most useful way to interpret the four views is to compare them rather than treat them as unrelated illustrations. On the county map, Route 23 and several numbered state routes form the visible transportation framework. On the water map, many of those corridors can be traced near rivers or creek valleys. The elevation layer then shows the higher ridges that force those corridors to bend, split, or stay on narrow strips of lower ground.
Louisa is a good example because roads, settlement, and the river system crowd together near the eastern edge. Farther toward Blaine, the pattern becomes more dispersed, with roads following interior valleys and smaller waterways. The northern and southern parts of the county have fewer prominent city labels in this package, yet the water and elevation maps reveal that they are far from empty: they contain a dense arrangement of ridges, hollows, and tributaries.
Why the Big Sandy setting matters to Lawrence County
Lawrence County’s official history says the county was authorized by the Kentucky General Assembly in 1821 and formally established in 1822, with the name honoring U.S. Navy Captain James Lawrence. The same county history emphasizes the long importance of river transportation around Louisa. That background still makes sense when looking at a modern map because the eastern edge remains the place where major waterways, roads, and the principal town come together.
Kentucky’s county information page describes Lawrence County as part of the state’s Eastern Coal Field region and notes Yatesville Lake State Park among its local destinations. The map package is not a park or recreation map, but that official context helps explain the broader landscape: steep hills, reservoirs and streams, narrow valleys, and communities connected by routes that work with the terrain rather than against it.
Choosing the right Lawrence County view for a specific task
Start with the county map when you need boundaries, Louisa, Blaine, major roads, and quick regional orientation. Move to the city map when the goal is simply to compare the two main labeled settlement points without other features competing for attention. Use the water-and-terrain map to follow named rivers, creeks, and drainage corridors, especially if you are explaining why development and roads cluster in certain valleys.
The elevation map is the strongest choice when the topic is relief: ridge height, low creek corridors, or the rapid changes in terrain across short distances. For a printed handout, you can use only the view that matches the subject instead of forcing every layer onto one page. Keeping the layers separate also reduces the chance of confusing a general water reference with a flood map or a generalized elevation surface with a detailed survey.
Frequently Asked Questions
Which river feature is most useful for locating Louisa?
Louisa sits at the meeting point of the Levisa Fork and Tug Fork in the Big Sandy river system. The supplied water map labels the Levisa Fork of the Big Sandy River on the eastern side, so it provides a strong geographic reference for finding Louisa and understanding why the city is closely tied to the Kentucky–West Virginia river corridor.
What does the elevation map show about the county’s terrain?
The map reports an approximate county-wide elevation range of 158 to 395 meters, with a mean near 252 meters. Lower corridors follow rivers and creeks, while repeated ridges rise between them. The pattern is useful for broad terrain comparison, but the surface is generalized and should not be treated as a survey measurement for a specific property or construction site.
Can these maps be used for flood zones or property boundaries?
No. The package is designed for geographic orientation and printable reference. Flood risk should be checked with FEMA or other official hazard data, and property lines, zoning, ownership, or legal boundaries require the appropriate county and state records. The maps here help explain where places, roads, water, and relief are located, not make legal or safety determinations.
Map File Information
The archive contains the original high-resolution JPG versions of the Lawrence County boundary map, city map, terrain-and-water map, and elevation map. Each source image is 3638×2572 pixels, making the files better suited to printing and offline reference than the lighter WebP images used in the article.
- File Type: JPG files in a ZIP archive
Related Maps
Sources and references
For local background, see the official Lawrence County history and the Kentucky.gov Lawrence County page. The relationship between the Levisa Fork, Tug Fork, and Big Sandy River at Louisa is described by the Kentucky Department of Fish & Wildlife Levisa Fork guide.
For authoritative mapping data, use the U.S. Census Bureau TIGER/Line files for boundaries and road geography, USGS National Hydrography for water features, and the USGS 3D Elevation Program for elevation data. These sources are the appropriate places to verify details beyond the simplified county-scale maps on this page.
Green Map creates custom-edited map images using open geographic data sources such as geoBoundaries, Natural Earth, OpenStreetMap, and government open data. These maps are edited visual materials, not raw data files, and are provided for education, documents, presentations, and graphic reference.