Marshall County sits in northern Mississippi, where Holly Springs serves as the clearest reference point for roads, communities, and county services while Byhalia and Potts Camp pull the map in different directions. The supplied maps also show a landscape cut by the Coldwater River system in the north, separate southeastern waterways, and a broad elevation range from about 78 to 212 meters. You can use the WebP maps on this page for quick viewing and download the matching high-resolution A3 JPG files as one ZIP for printing, editing, or offline reference.
This is a county where a single town-centered map leaves out much of the story. The road network fans away from Holly Springs, the city-connection graphic places Byhalia northwest and Potts Camp southeast, and the terrain map shows narrow low valleys between repeated ridges. Reading those layers together makes it easier to understand why the county does not behave like one compact urban area even though Holly Springs is the county seat.
Table of Contents
Holly Springs as the road and county reference point
The general county map puts Holly Springs near the middle of the mapped road network and gives it the strongest cluster of civic labels. Byhalia and Victoria appear to the northwest, Red Banks sits between that side of the county and Holly Springs, and Potts Camp and Bethlehem mark the southeast. Waterford lies south of Holly Springs, while Mount Pleasant helps define the northern part of the county. These place names are spread far enough apart that the county boundary matters: the map is useful not simply for finding Holly Springs but for seeing how several smaller communities relate to it.
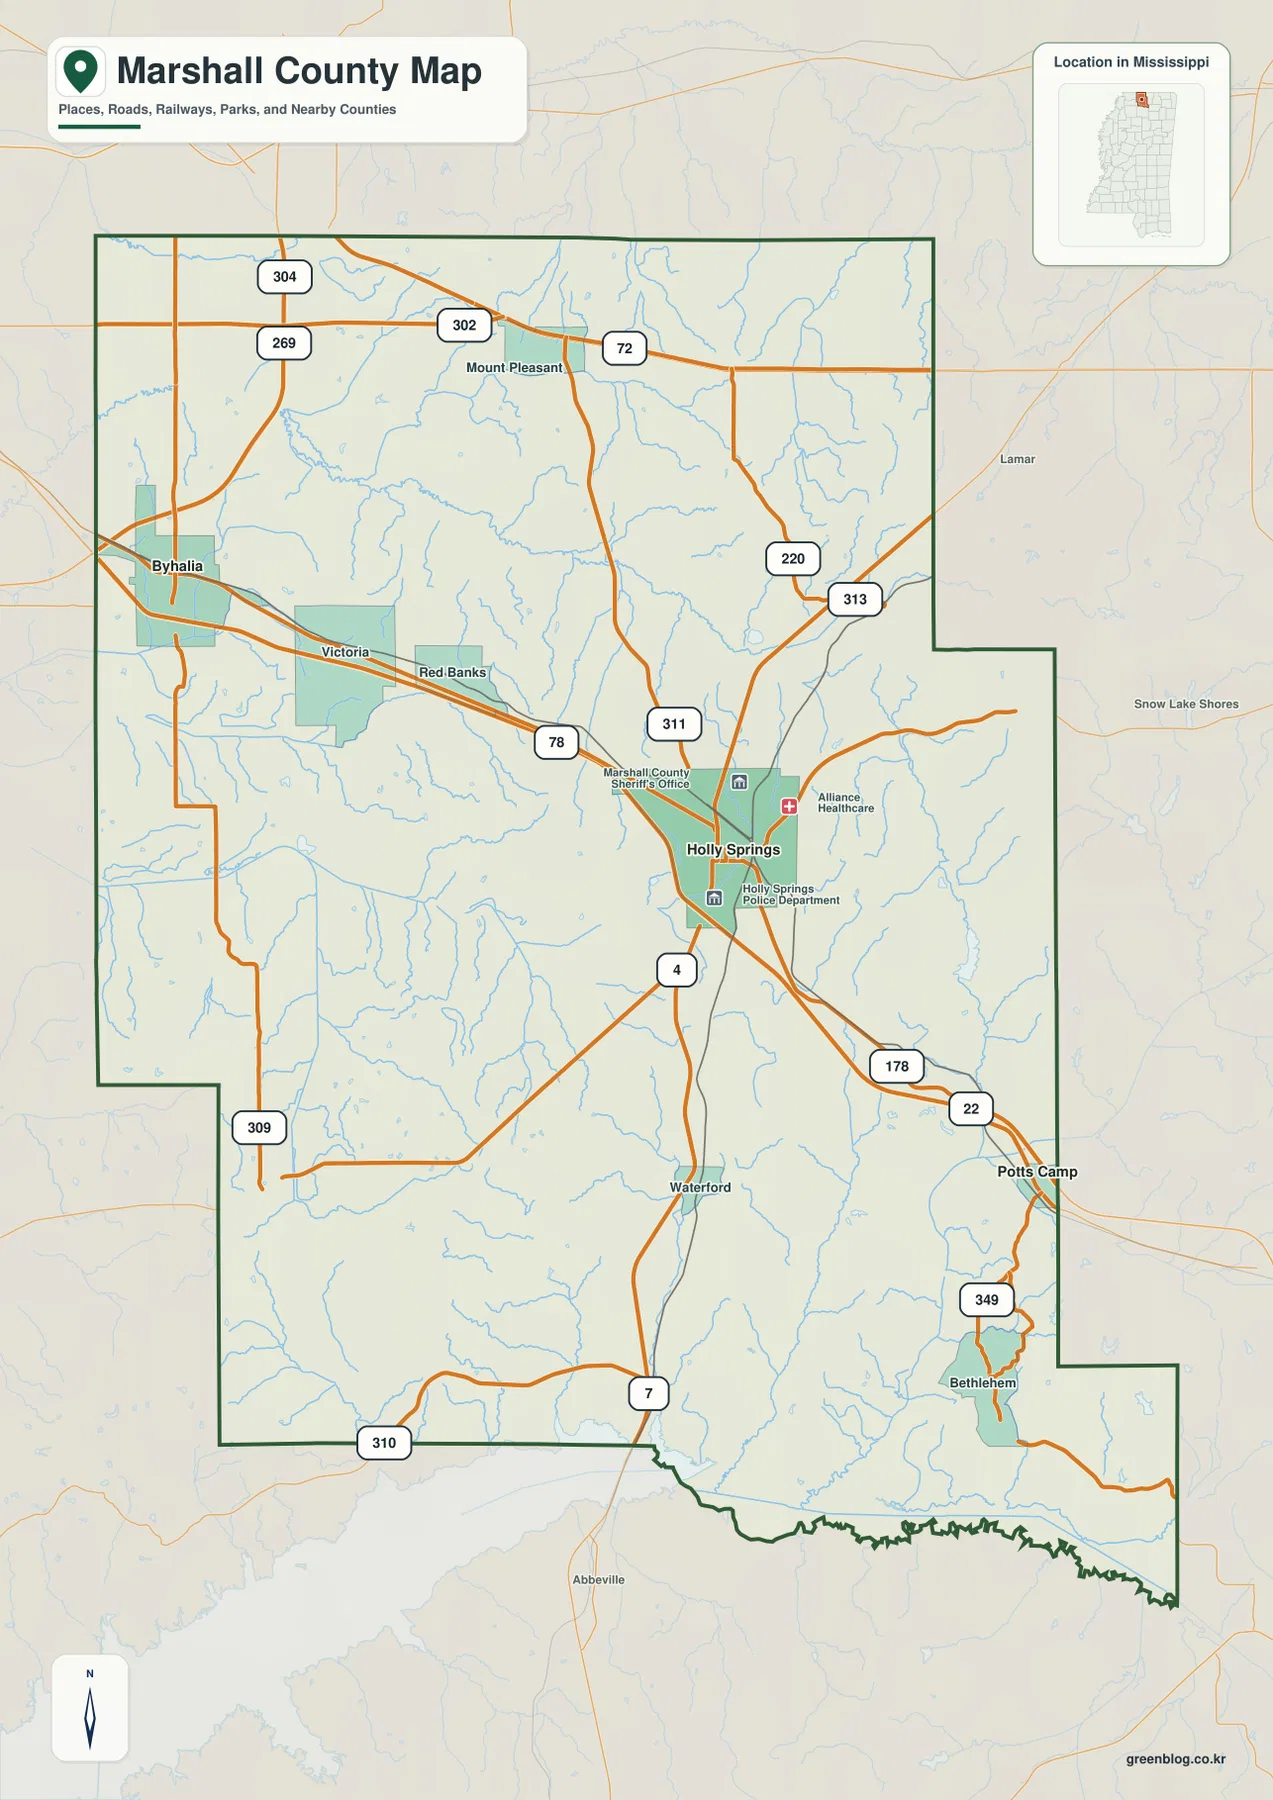
The main cross-county corridor is the I-22/US 78 route referenced in the supplied article, running through the part of the county that links the Byhalia side with Holly Springs and the Potts Camp direction. US 72 is shown farther north. Around Holly Springs, MS 4, MS 7, and MS 311 provide additional north-south and east-west choices. Farther out, shields such as 302, 220, 313, 178, and 349 help distinguish the smaller-road network. The map is intentionally generalized, so it is best for orientation and route relationships rather than turn-by-turn driving.
The supplied county statistics provide useful scale. Marshall County had 33,752 residents in the 2020 census, while the July 2025 estimate listed in the package is 34,654. Those figures come from different reference dates, but the difference is roughly nine hundred people. The 2025 Gazetteer figures in the source material list 706.192 square miles of land and 3.542 square miles of water. Together, those numbers help explain why the settlement pattern looks dispersed: a relatively large land area contains one main county seat, several smaller towns, and wide stretches where roads and waterways are more visually prominent than dense development.
Byhalia northwest, Potts Camp southeast: what the city map adds
The city-connection map simplifies the county to three labeled centers and uses Holly Springs as the hub. Byhalia is shown about 16 miles away to the northwest, while Potts Camp is about 11 miles to the southeast. These are straight-line distances, not road mileage. A trip by car follows the actual highway network and therefore may be longer, but the straight-line values are useful for comparing direction and relative separation without the distractions of every local road.
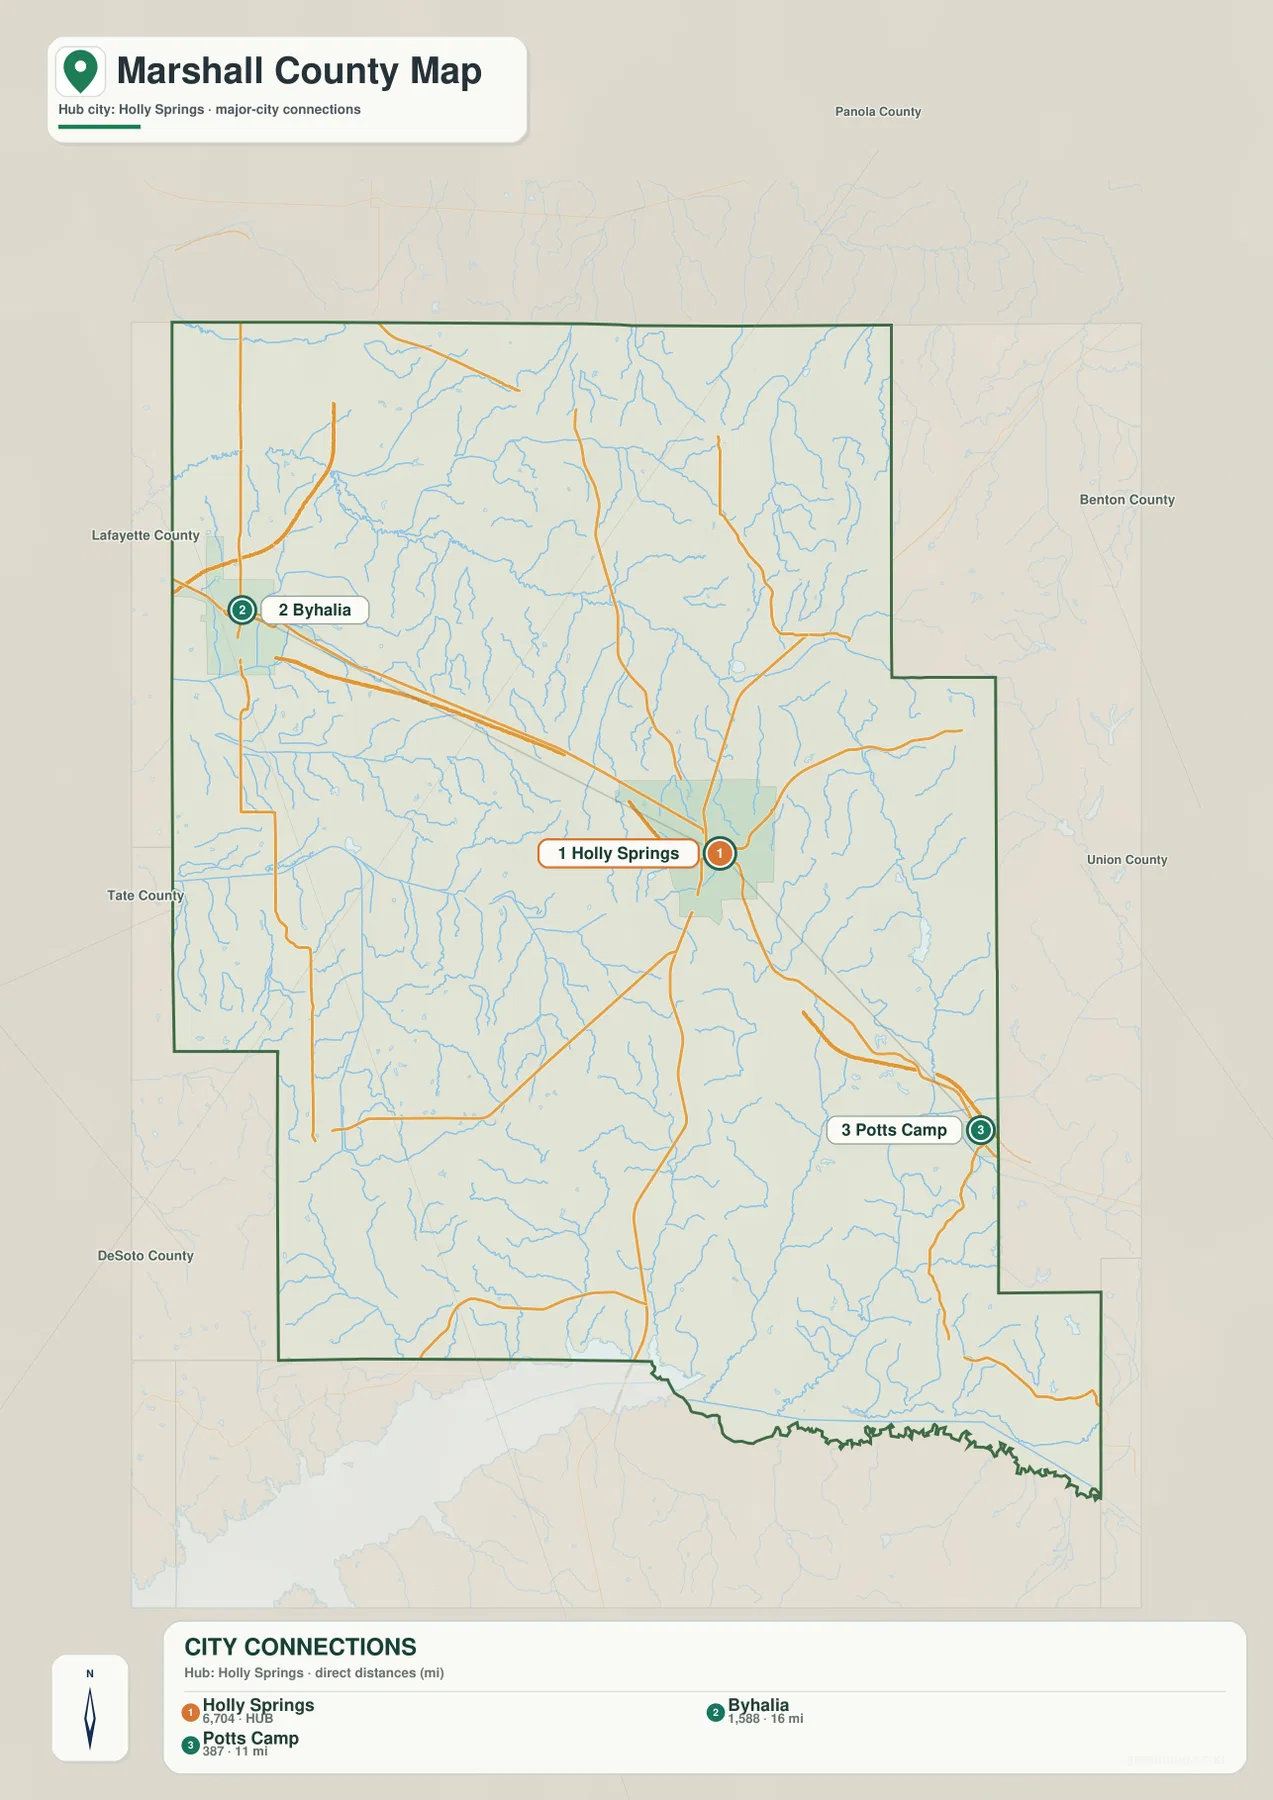
That simple diagram highlights a real contrast in county orientation. Byhalia occupies the side of Marshall County associated in the existing source material with access toward the Memphis area, while Potts Camp sits on the opposite side of Holly Springs along the southeastern direction. Holly Springs therefore works as more than a labeled county seat: it is the middle reference for comparing two different sides of the county. For classroom use or a presentation, this map is often clearer than the full road map when the question is simply “Which direction is each town from Holly Springs?”
The panel on the city map also displays population figures of 6,704 for Holly Springs, 1,588 for Byhalia, and 387 for Potts Camp. Those numbers are part of the supplied graphic and should not be treated as a substitute for a current city-level census table, because the graphic does not state the same reference date beside each label. They are most useful as visual context for why Holly Springs is presented as the hub rather than as a new population estimate.
Coldwater River in the north and a different water network in the southeast
The water map changes the emphasis completely. The Coldwater River is the strongest named channel across the northern half of the county, bending eastward through a dense web of smaller streams. Little Coldwater Creek appears above it, while Red Banks Creek and Pigeon Roost Creek are labeled farther west. Instead of treating the blue lines as decoration, this map makes it possible to follow named drainage routes through the same areas that look much simpler on the road map.
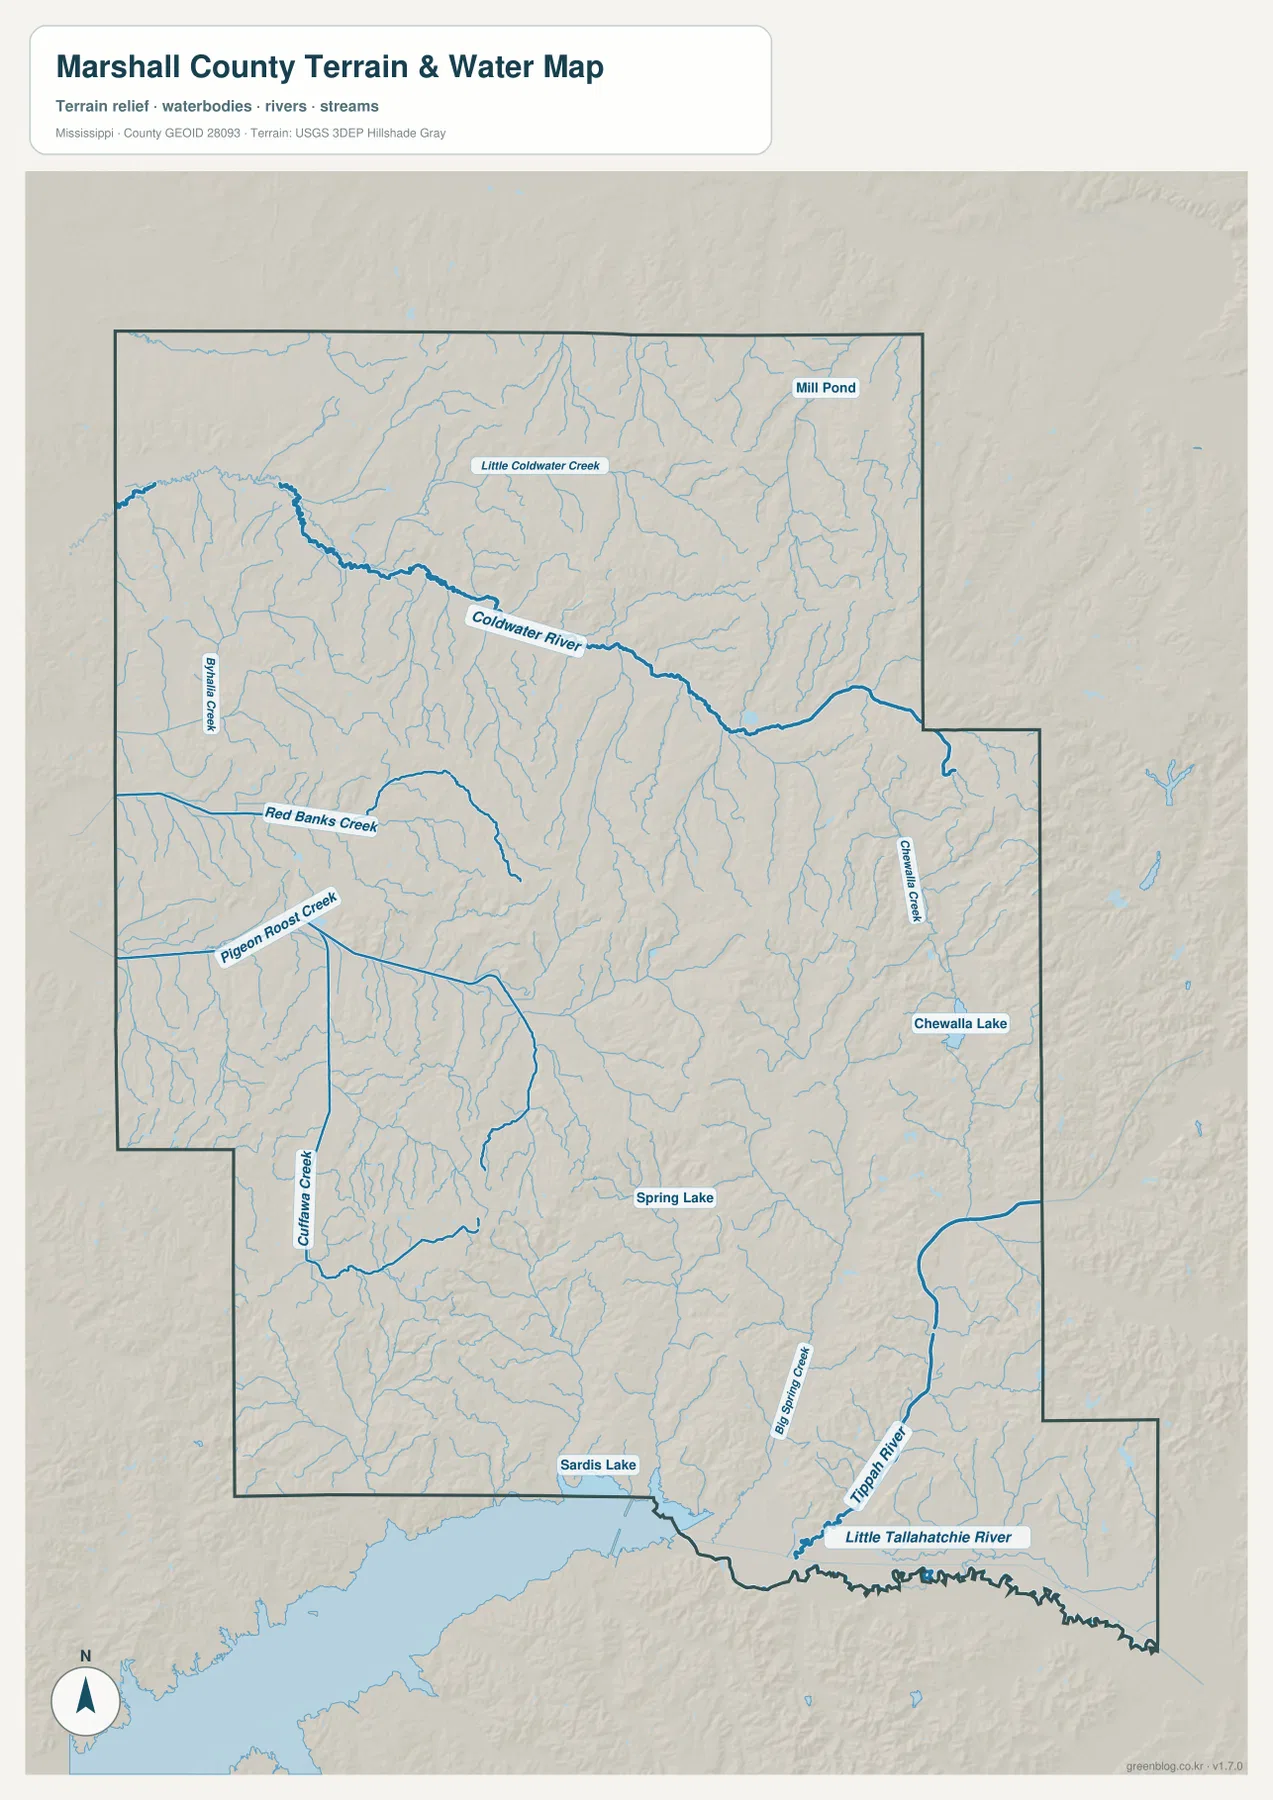
The southeastern corner belongs to a visibly different set of named waters. Tippah River and Little Tallahatchie River are labeled close to the lower-right edge of the county, with Big Spring Creek nearby. Chewalla Lake appears in the east-central area, Spring Lake farther south, and Mill Pond near the northeast. Sardis Lake is visible near the southwestern edge of the map. Seeing these names together helps prevent the common mistake of assuming that every stream in the county belongs to one obvious river corridor.
This layer is a location reference, not a flood-hazard map, navigation chart, or parcel product. A dense cluster of stream lines does not by itself identify a regulated floodplain or predict where water will rise during a storm. Its value is more basic and more reliable: it tells the reader which named rivers, creeks, ponds, and lakes appear in the supplied data and where they sit relative to the county outline.
From 78 to 212 meters: ridges, valleys, and the county’s strongest relief
The elevation map reports an actual range of about 78 to 212 meters and a mean of 131 meters. Darker greens mark lower ground, while yellow, orange, and brown tones mark higher ridges. The color changes are not confined to one isolated hill. Instead, narrow valleys repeatedly cut between elongated higher areas, creating a broken, rolling surface across much of the county.
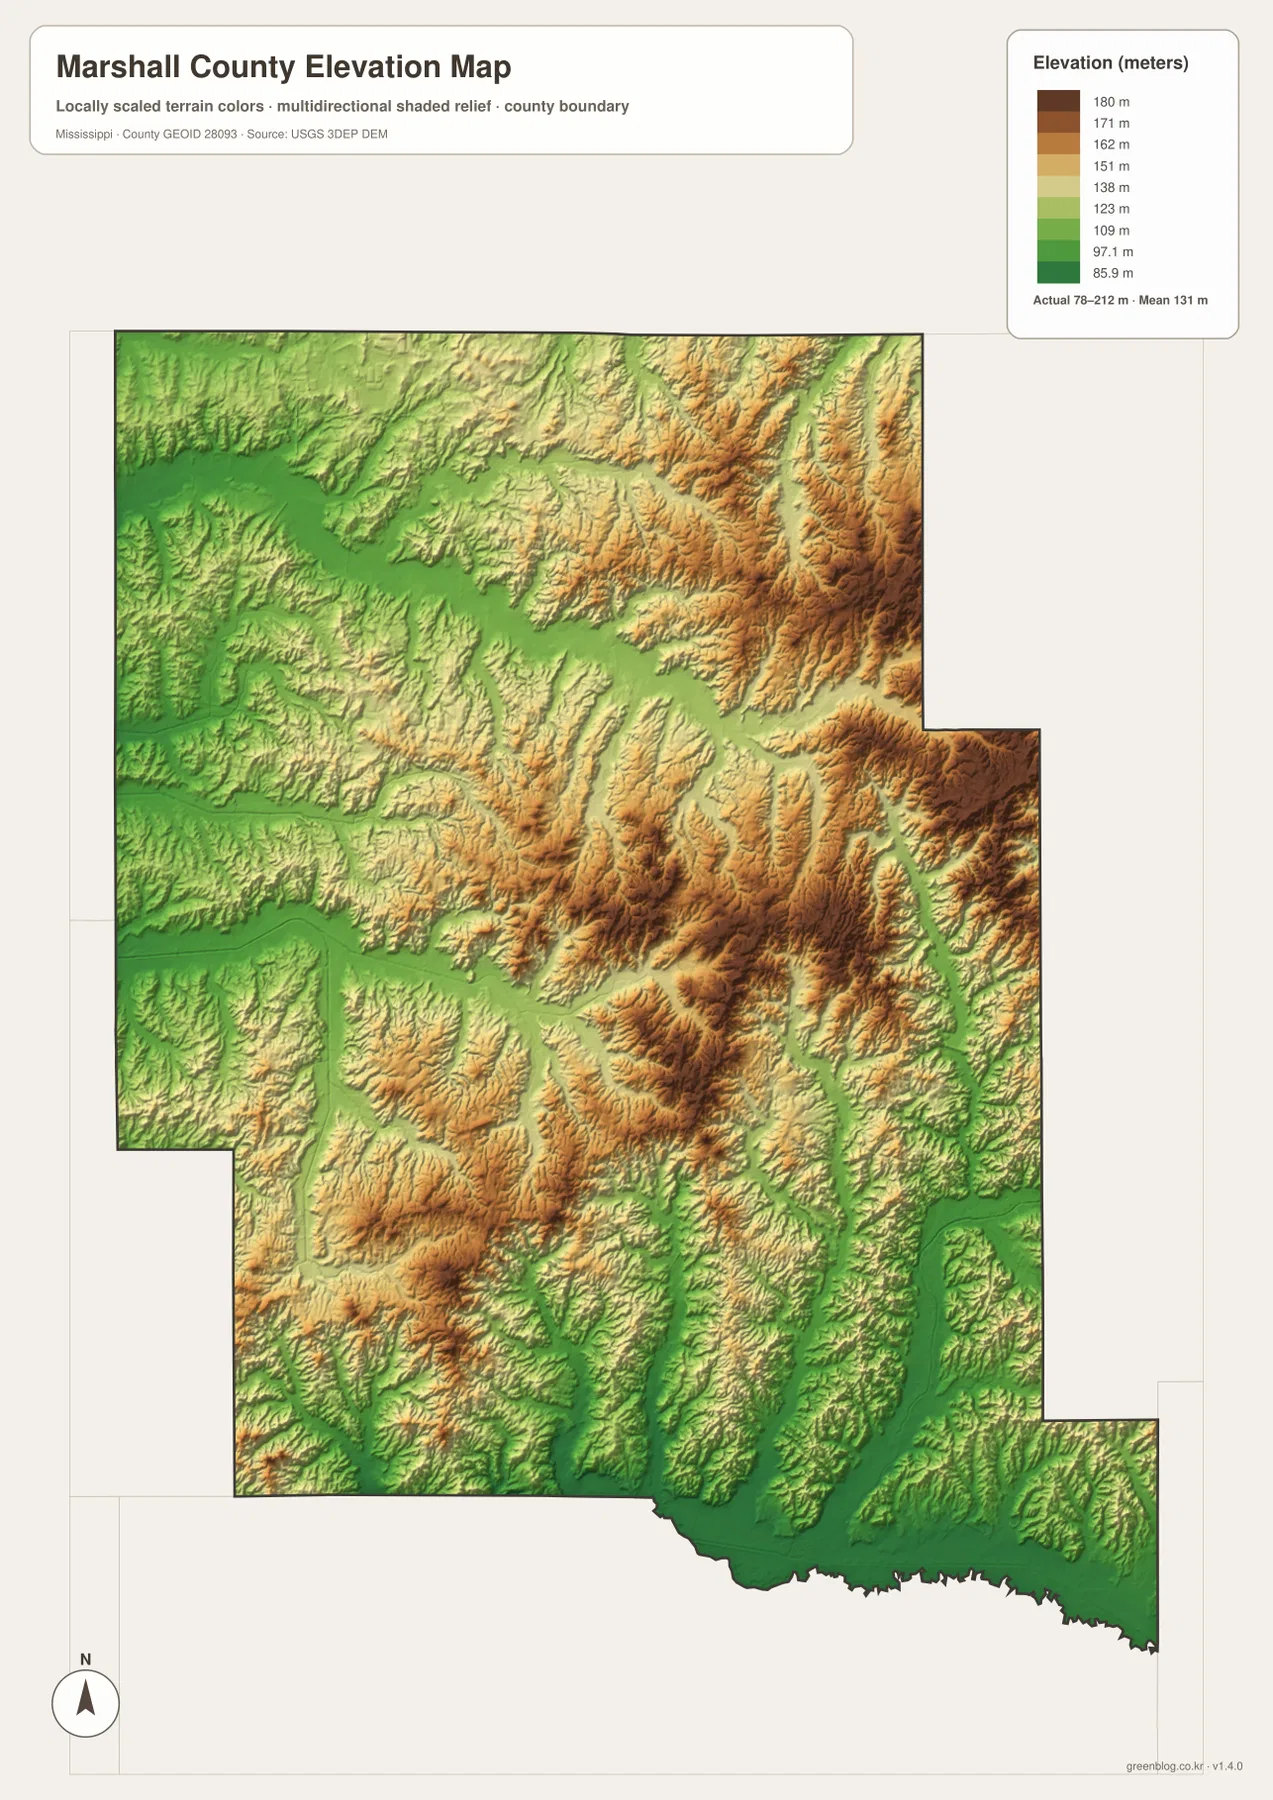
The most conspicuous higher terrain is concentrated in the eastern and northeastern parts of the mapped county, where orange and brown ridges stand out above branching green valleys. The center also contains high ground, but it is divided by lower drainage corridors. In the southeast, the lower green terrain becomes especially clear near the Little Tallahatchie River side. When this map is compared with the water layer, many of the low corridors correspond to the same places where streams and rivers thread through the hills.
The map should be used for county-scale terrain comparison, not survey work. It does not claim that a particular house lot, bridge, or construction site has an exact elevation based on the color beneath it. For that kind of decision, a user would need higher-resolution elevation data and appropriate professional measurement. Here, the useful message is the relative one: Marshall County contains substantial relief, and the river valleys form lower passages through the hills.
Forest context around Holly Springs without confusing land ownership and terrain
The source catalog included with this package contains the USDA Forest Service page for Holly Springs National Forest, and the current article uses the forest as regional landscape context. That is useful background for a county known for wooded hill country, but the four supplied maps are not a land-ownership or national-forest boundary set. Green on the elevation map means lower elevation, not “national forest,” and the pale background on the road map should not be read as a legal ownership layer.
Keeping that distinction clear makes the maps more useful. The road layer answers where communities and routes are located; the water layer identifies rivers, creeks, and lakes; the elevation layer shows relative height. The Forest Service reference can then provide separate context about recreation and forest lands in the Holly Springs region. Combining those sources is informative, but assigning a legal boundary to a color that was designed for terrain would create information the supplied maps do not actually contain.
What the population and area numbers do—and do not—tell you
The 2020 census count and the July 2025 estimate are useful for understanding county scale, but neither tells us where every resident lives. The maps themselves show why: Holly Springs is the primary labeled center, yet Byhalia, Potts Camp, Victoria, Red Banks, Waterford, Mount Pleasant, and other places are distributed across a wide area. Streams and ridges fill much of the space between them. A single countywide density figure would flatten those differences, so the map is more helpful when population totals are read alongside the actual settlement pattern.
The area figures have a similar limitation. The package separates land and water area, but the road map does not classify farms, forests, subdivisions, or wetlands as separate land-cover categories. Those questions belong to other datasets. On this page, the area figures simply give scale to the boundary, while the four map layers explain where the named communities, routes, waterways, and elevation differences appear inside that boundary.
Choosing the most useful Marshall County map for the task
Start with the general county map when you need an overview of Holly Springs, neighboring communities, road numbers, and the full county outline. Switch to the city-connection map when relative direction matters more than small road detail. Use the water map to locate the Coldwater River, Tippah River, Little Tallahatchie River, named creeks, and lakes. The elevation layer is the best choice when the question is why some corridors appear low and narrow while adjacent parts of the county rise into more rugged ridges.
For printed handouts, large-screen presentations, or offline annotation, the original JPG files preserve more detail than the page previews. The ZIP below contains the high-resolution A3 JPG counterparts to the four supplied WebP maps. Because each file serves a different purpose, it is usually better to choose the layer that answers the question rather than trying to force every feature into one crowded image.
Frequently Asked Questions
Why does the city map show 11 miles to Potts Camp and 16 miles to Byhalia?
Those numbers are straight-line distances from Holly Springs. They compare the direction and separation of the three labeled cities without following every road bend. Actual driving mileage can be longer, so the figures should not be used as a substitute for route planning.
What is the clearest terrain contrast on the Marshall County elevation map?
The eastern and northeastern ridges stand out as higher orange-brown terrain, while branching green valleys mark lower ground. The southeastern side near the Little Tallahatchie River also contains a distinct low corridor. The map reports an overall range of about 78 to 212 meters and a mean near 131 meters.
Can the water map be used to identify flood-risk property?
No. It is designed to show named waterways and their approximate location within the county, including the Coldwater River system and southeastern rivers and creeks. Flood-zone, parcel, insurance, or engineering decisions require dedicated authoritative products that are not included in this package.
Map File Information
The download includes the high-resolution A3 JPG originals corresponding to the county, city-connection, water, and elevation maps shown on this page.
- Included Files: County map, city-connection map, water map, elevation map
- File Type: ZIP containing 4 JPG files
Related Maps
Sources and References
- U.S. Census Bureau QuickFacts for Marshall County – population and county statistics
- U.S. Census Bureau 2025 Gazetteer Files – land and water area reference
- Mississippi Department of Transportation Official Highway Map – route reference
- USDA Forest Service: Holly Springs National Forest – regional forest and recreation context
- USGS National Hydrography – hydrography reference
- USGS 3D Elevation Program – elevation reference
Green Map creates custom-edited map images using open geographic data sources such as geoBoundaries, Natural Earth, OpenStreetMap, and government open data. These maps are edited visual materials, not raw data files, and are provided for education, documents, presentations, and graphic reference.