Monroe County lies along the eastern side of Mississippi, where Aberdeen and Amory provide two useful reference points for reading the county. The map set shows roads and communities, the ranked city pattern, the Tombigbee River and connected water bodies, and the county’s elevation. High-resolution A3 JPG versions of all four maps are also available to download in one ZIP file for printing, classroom work, presentations, or closer comparison.
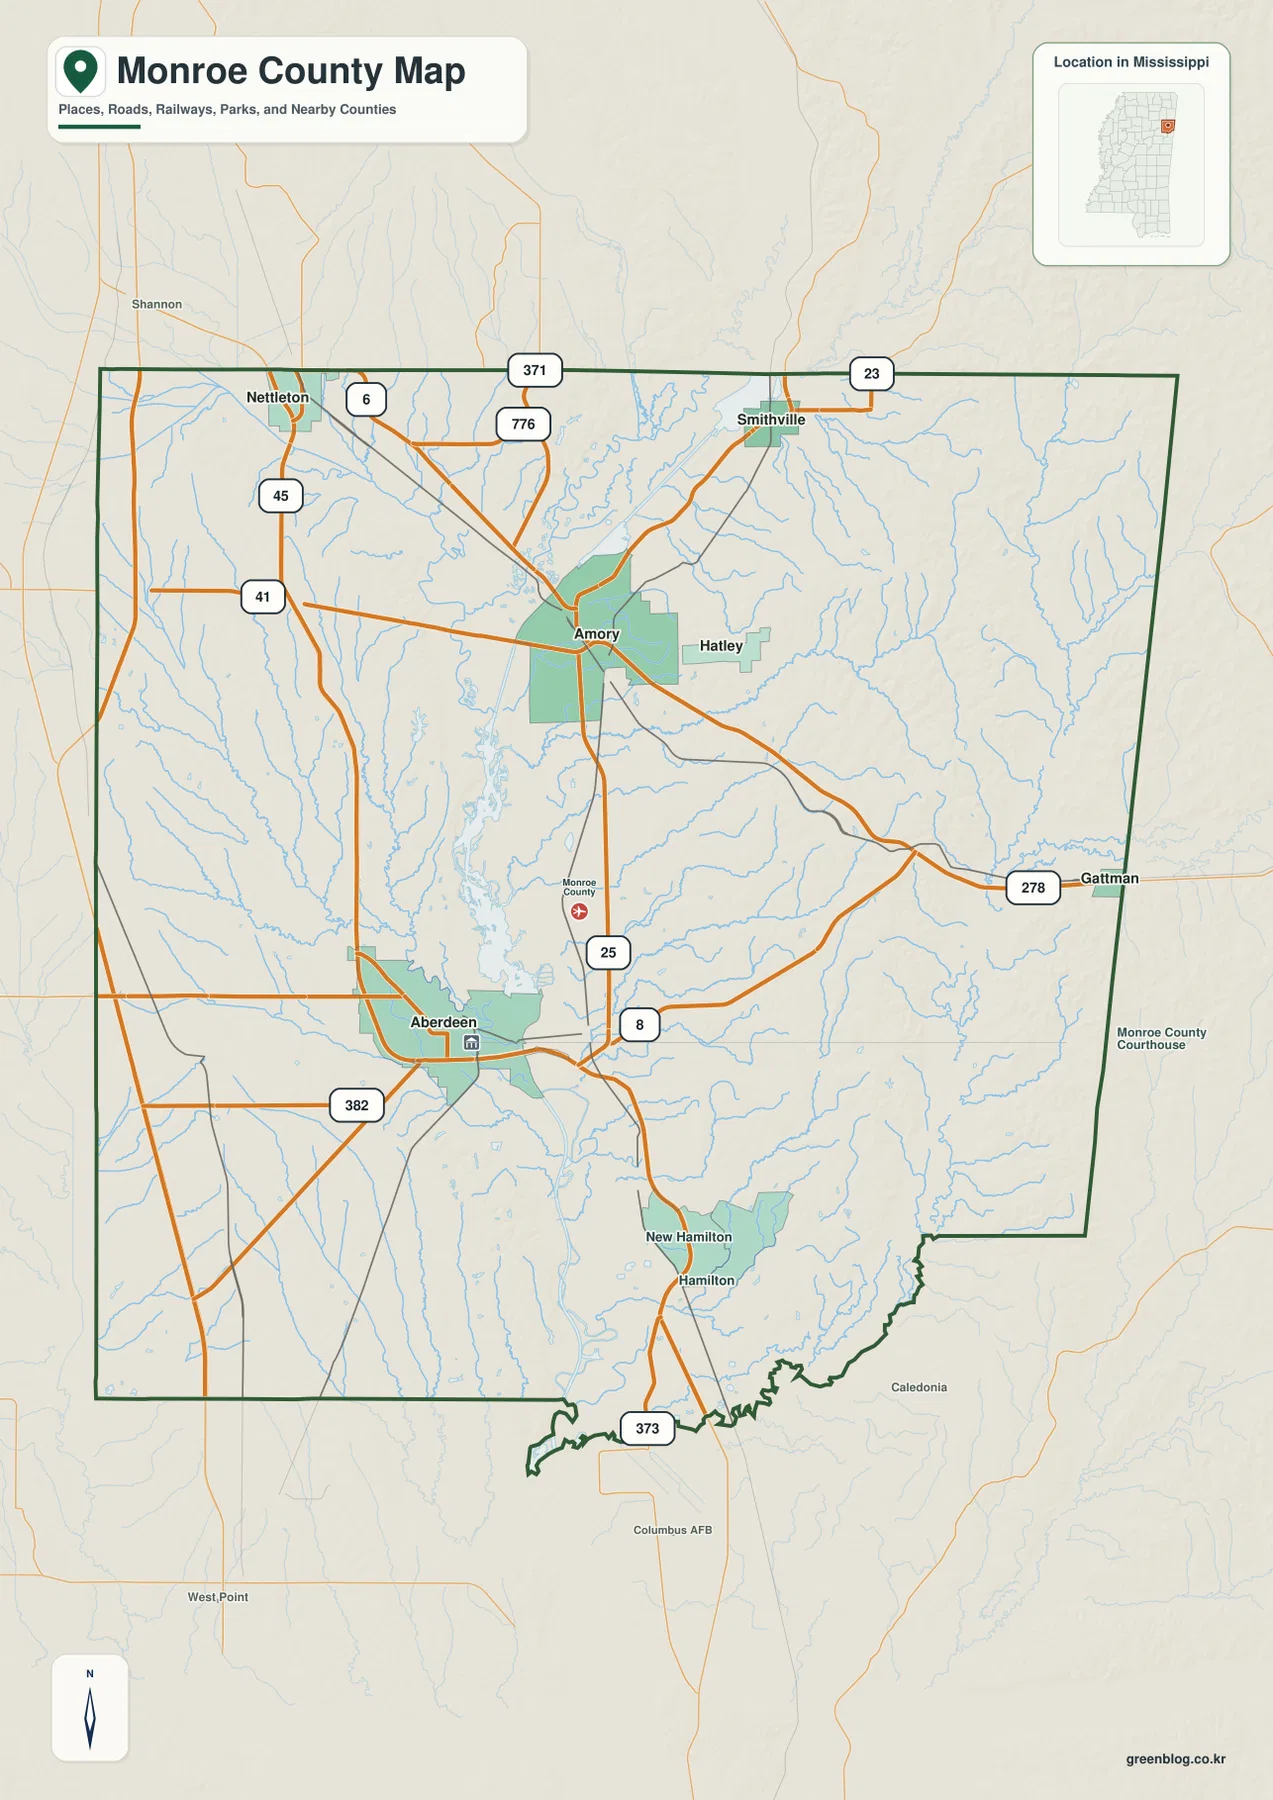
The county makes more sense when water and terrain are viewed together rather than treated as background details. Aberdeen sits beside the broad Tombigbee and Aberdeen Lake system in the central-southern part of the county, while Amory is farther north where several routes and communities converge. US 45 runs along the western side, MS 25 follows a more central north-south path, and other numbered routes spread toward Smithville, Gattman, and the eastern edge. On the elevation map, the low central river corridor stands out against higher, more dissected ridges to the east.
Table of Contents
Start with Aberdeen, Amory, and the central water corridor
Aberdeen is the county seat and appears slightly south of the county’s midpoint, beside the broad water area associated with Aberdeen Lake. Amory is north of Aberdeen and is easy to recognize because several roads meet around the city. Nettleton appears near the northwestern side of the mapped county, Smithville is toward the northeast, and Hatley lies just east of Amory. Farther south, New Hamilton and Hamilton provide additional references, while Gattman marks the far eastern side of the county map.
This arrangement is useful because Monroe County does not read like a county with a single dominant point surrounded by evenly spaced towns. Aberdeen is the administrative reference and a river-lake city, whereas Amory anchors the northern cluster of roads and settlements. A reader trying to locate a place can first decide whether it is closer to Aberdeen or Amory, then use nearby highways, streams, or smaller communities to narrow the position. The smaller labels matter because they break a large county into practical sections that are easier to recognize on paper.
County facts that help put the maps in context
- Location: Monroe County, Mississippi; FIPS 28095
- County seat: Aberdeen
- 2020 census population: 34,180
- July 2025 population estimate: 33,318
- 2025 Gazetteer area: 765.128 square miles of land and 6.932 square miles of water
- Reference density: about 44.7 residents per square mile when the 2020 population is compared with the 2025 land-area figure
- City-map labels: Amory, Aberdeen, Nettleton, Hatley, Smithville, and Gattman
- Named water features: Tombigbee River, Aberdeen Lake, Lock A Pool, Lock B Pool, Buttahatchee River, and several creeks and smaller lakes
- Elevation shown on the map: about 49 to 176 meters, with a mean of about 86 meters
The population figures use different dates, so they should not be treated as a single trend line without that context. The 2020 number is a census count, while the July 2025 figure is an estimate. The land and water figures come from the 2025 Gazetteer. The density value is best used as a countywide reference rather than as a description of every part of the map, because the settled areas around Aberdeen and Amory are clearly different from the broad rural areas, stream valleys, and reservoir margins.
US 45 on the west and MS 25 through the middle
The county map gives several road shields that make orientation easier. US 45 forms the clearest long north-south reference on the western side of the county. Around Amory, routes spread in several directions, and MS 25 continues south toward the Aberdeen area. MS 8 is labeled near Aberdeen, creating an east-west reference across the central-southern part of the county. North of Amory, MS 6 and other numbered roads appear near Nettleton, while MS 23 helps orient the Smithville side. US 278 is visible near Gattman on the eastern side.
The road layout becomes more meaningful when the water map is kept in mind. A wide river-lake corridor occupies the center of the county, so the road network is not simply a regular grid. Around Aberdeen, roads, rail lines, and water lie close together. Around Amory, the land-route pattern is more prominent, with several roads branching away from the city. US 45 provides a more continuous western alternative, staying well away from the broadest part of Aberdeen Lake. These differences help explain why two places that look close on a county outline can require different approaches on the ground.
What the six-place city index shows
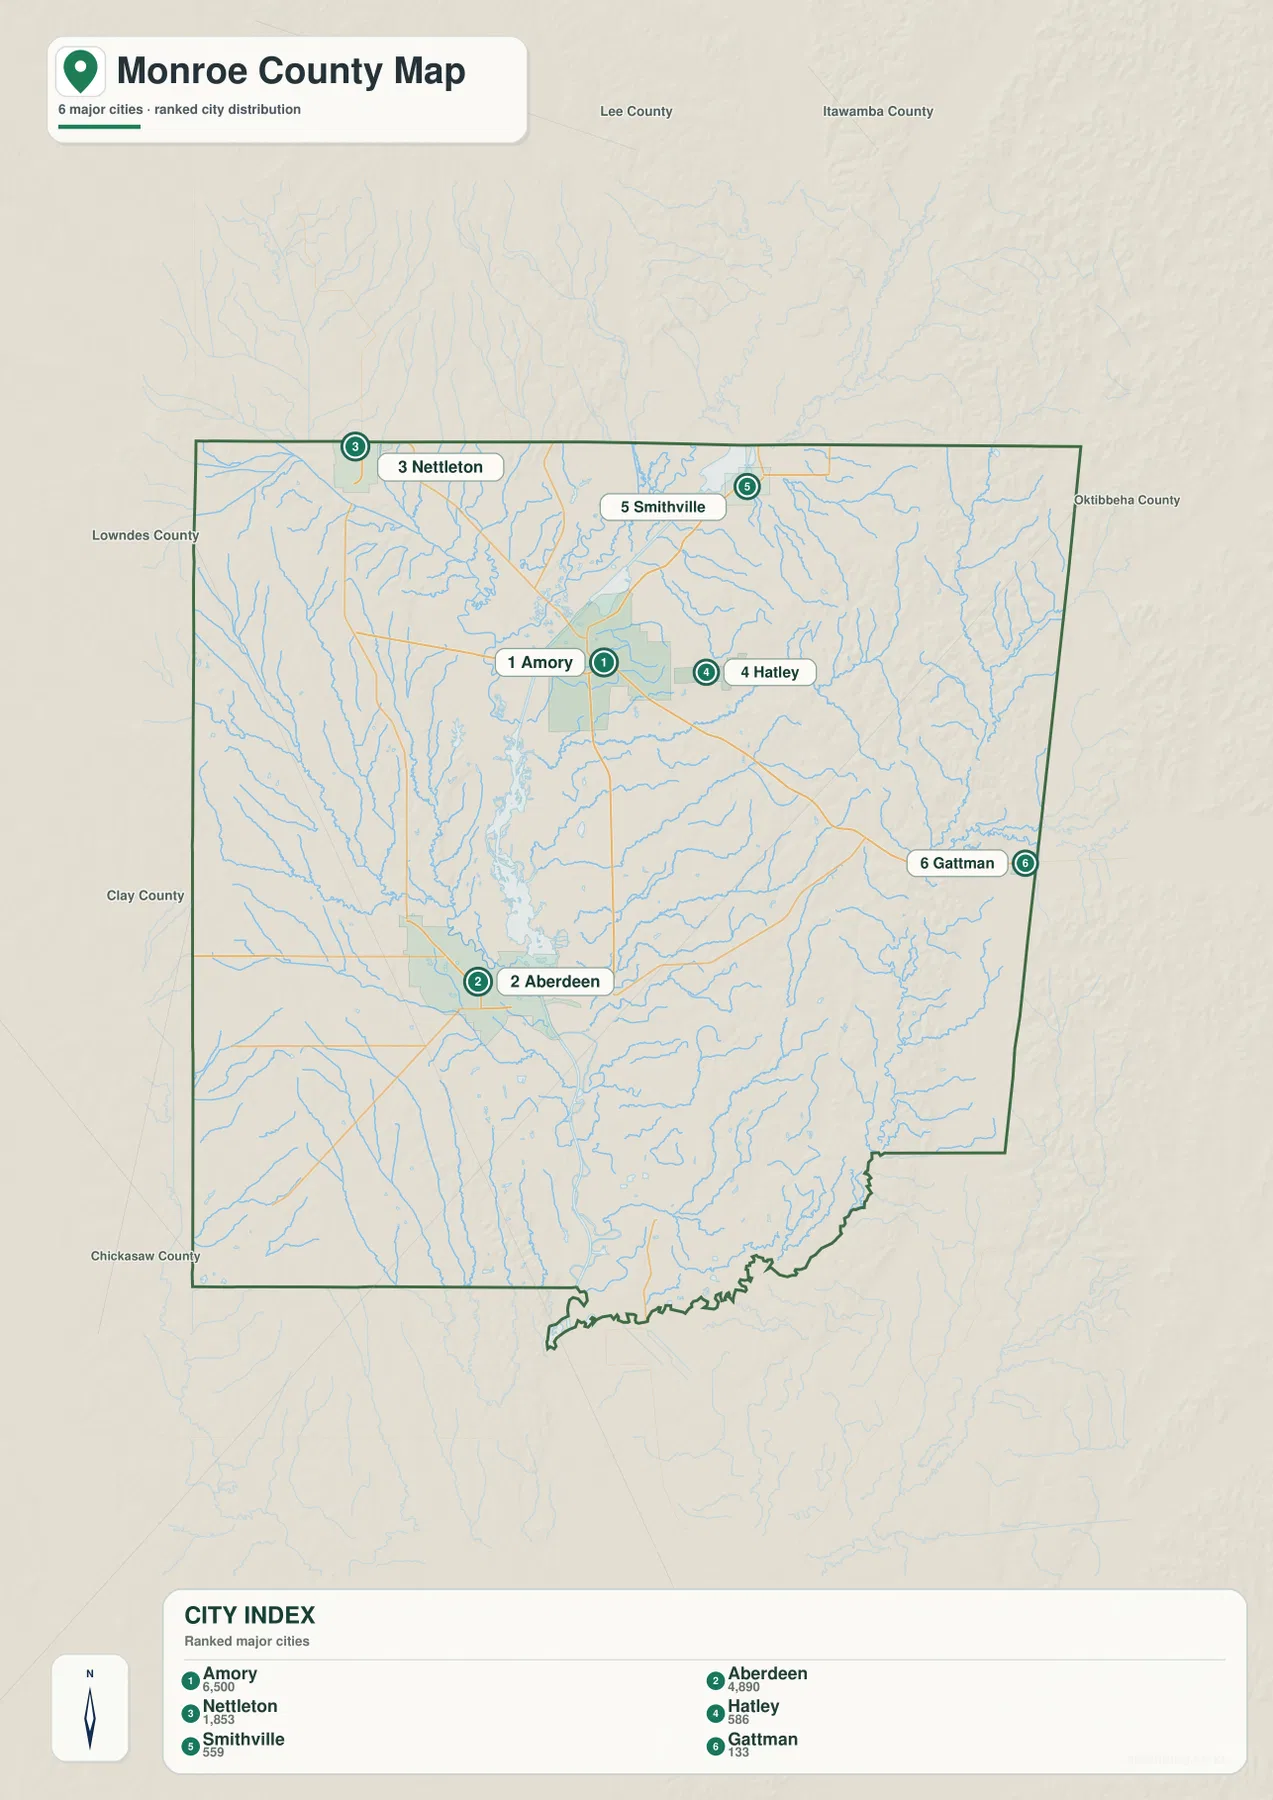
The city map strips away much of the road detail and emphasizes six labeled places. Its CITY INDEX ranks Amory first and Aberdeen second, followed by Nettleton, Hatley, Smithville, and Gattman. The values printed on the map are 6,500 for Amory, 4,890 for Aberdeen, 1,853 for Nettleton, 586 for Hatley, 559 for Smithville, and 133 for Gattman. Those numbers belong to the map’s city index and should be kept separate from the countywide population figures listed above.
The distribution is just as useful as the ranking. Amory and Aberdeen are separated north to south by the broad central water system. Nettleton and Smithville sit toward opposite sides of the northern county, which makes them helpful for distinguishing northwest from northeast. Hatley is close to Amory on the east, while Gattman is far enough to the east that it becomes an excellent edge reference. If the goal is simply to explain where the main communities lie relative to one another, this map is cleaner than the general county map. If the goal is to plan a route, the road map should be used alongside it.
Aberdeen Lake, the Tombigbee River, and the lock pools
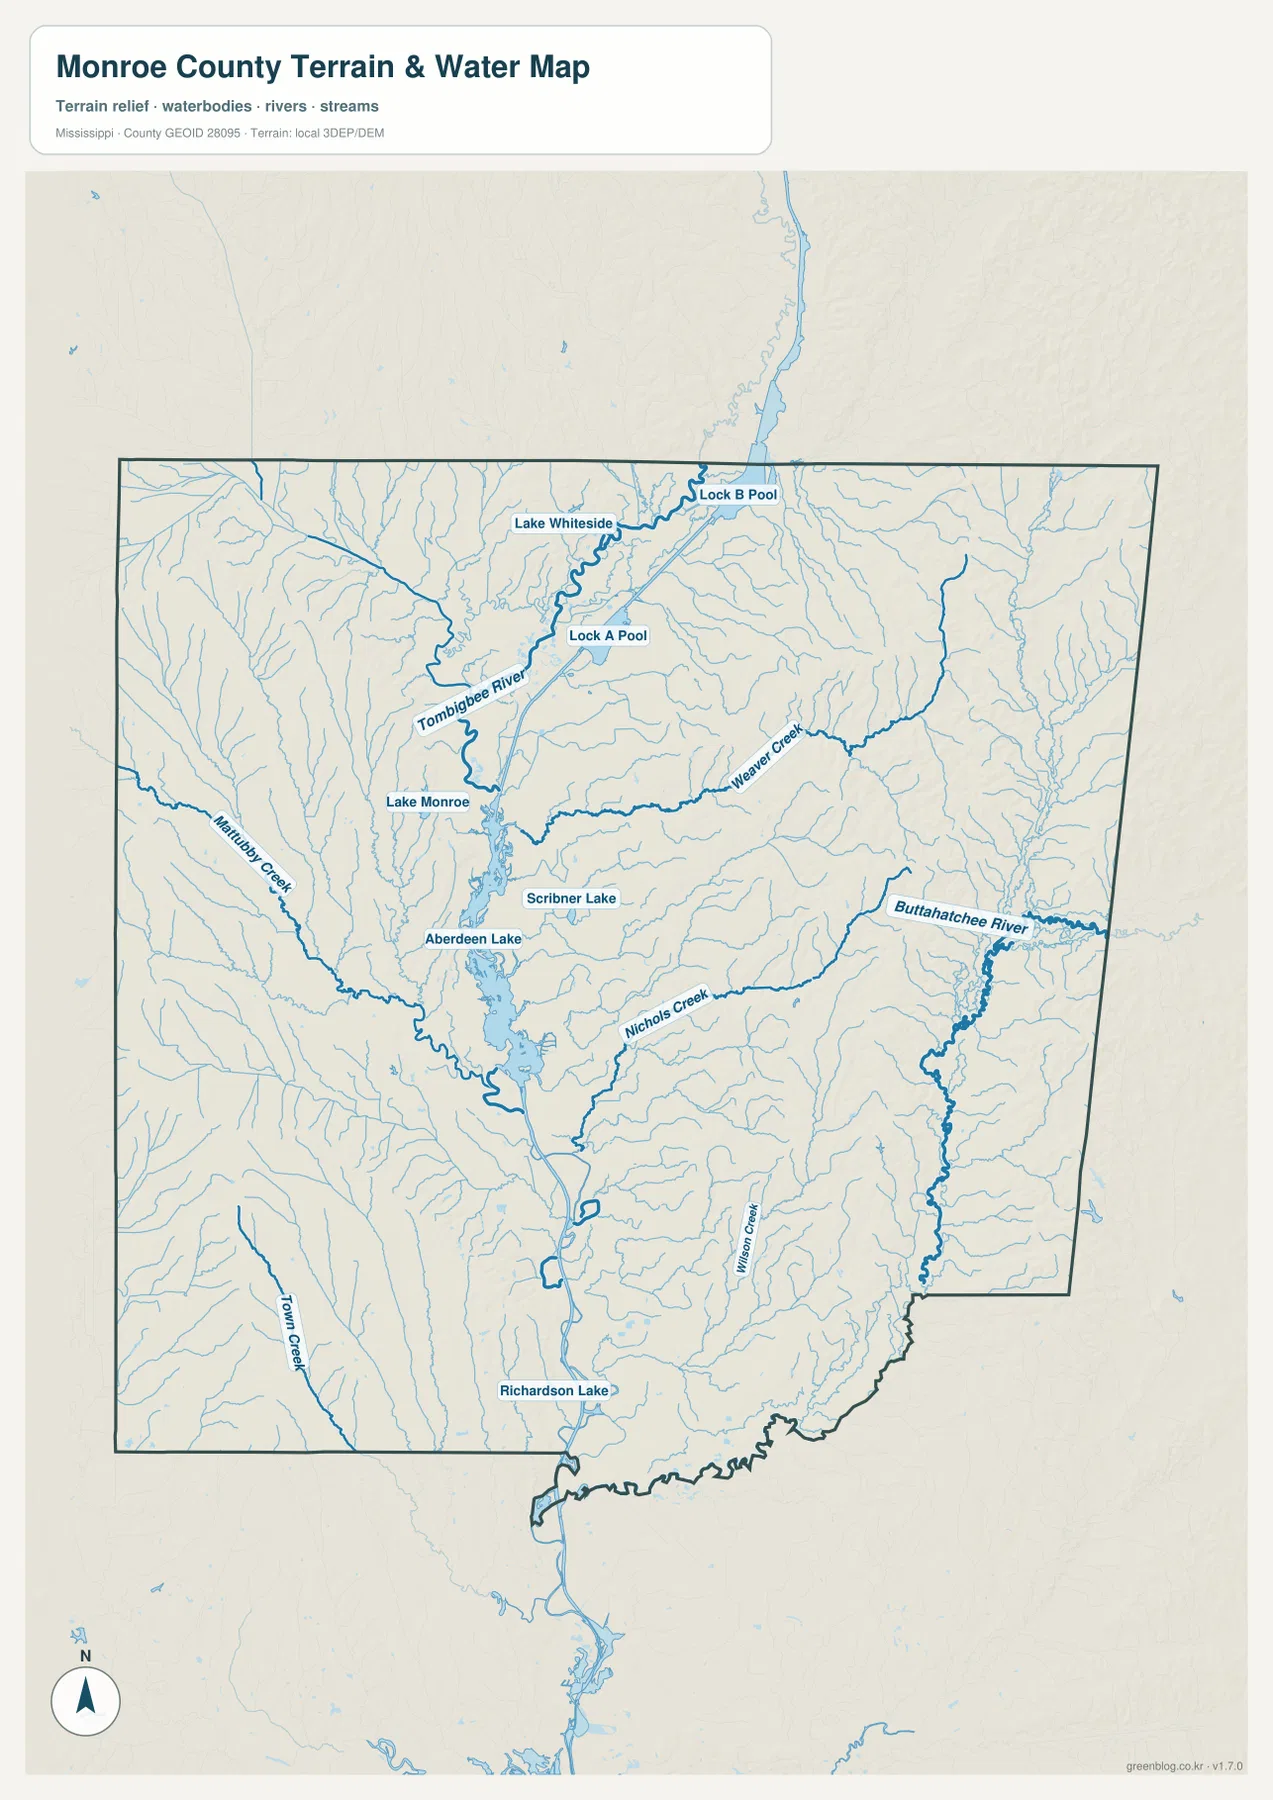
The water map changes the visual emphasis completely. The Tombigbee River forms the main north-south water line, while Aberdeen Lake creates a broad water body in the middle of the county. North of the lake, Lock A Pool and Lock B Pool are labeled along the same corridor. Lake Monroe and Lake Whiteside appear nearby, and Scribner Lake is labeled close to the eastern side of the Aberdeen Lake area. Richardson Lake appears farther south, separated from the larger central water body.
Several named tributaries and streams show how much more complex the drainage is than the basic county map suggests. The Buttahatchee River is prominent on the eastern side. Weaver Creek and Nichols Creek extend across the eastern half toward the central system. Mattubby Creek is labeled on the west, Town Creek appears in the southwest, and Wilson Creek is shown in the southeast. Numerous smaller blue lines fill the spaces between the named features, especially on the ridged eastern side. The result is a county where waterways are not confined to one channel even though the Tombigbee corridor remains the dominant feature.
Aberdeen’s position becomes especially clear on this map. The city lies beside the southern part of the broad lake-and-river complex, so it works as a practical reference for locating the central waterway. Amory, farther north, is closer to the upper part of the system where the river and managed pools continue toward the county’s northern side. Looking at both cities on the water map helps separate their roles without relying on a generic description of “river towns.” One is closely associated with the broad Aberdeen Lake area, while the other helps orient the upper water corridor and northern road network.
From the low Tombigbee corridor to the higher eastern ridges
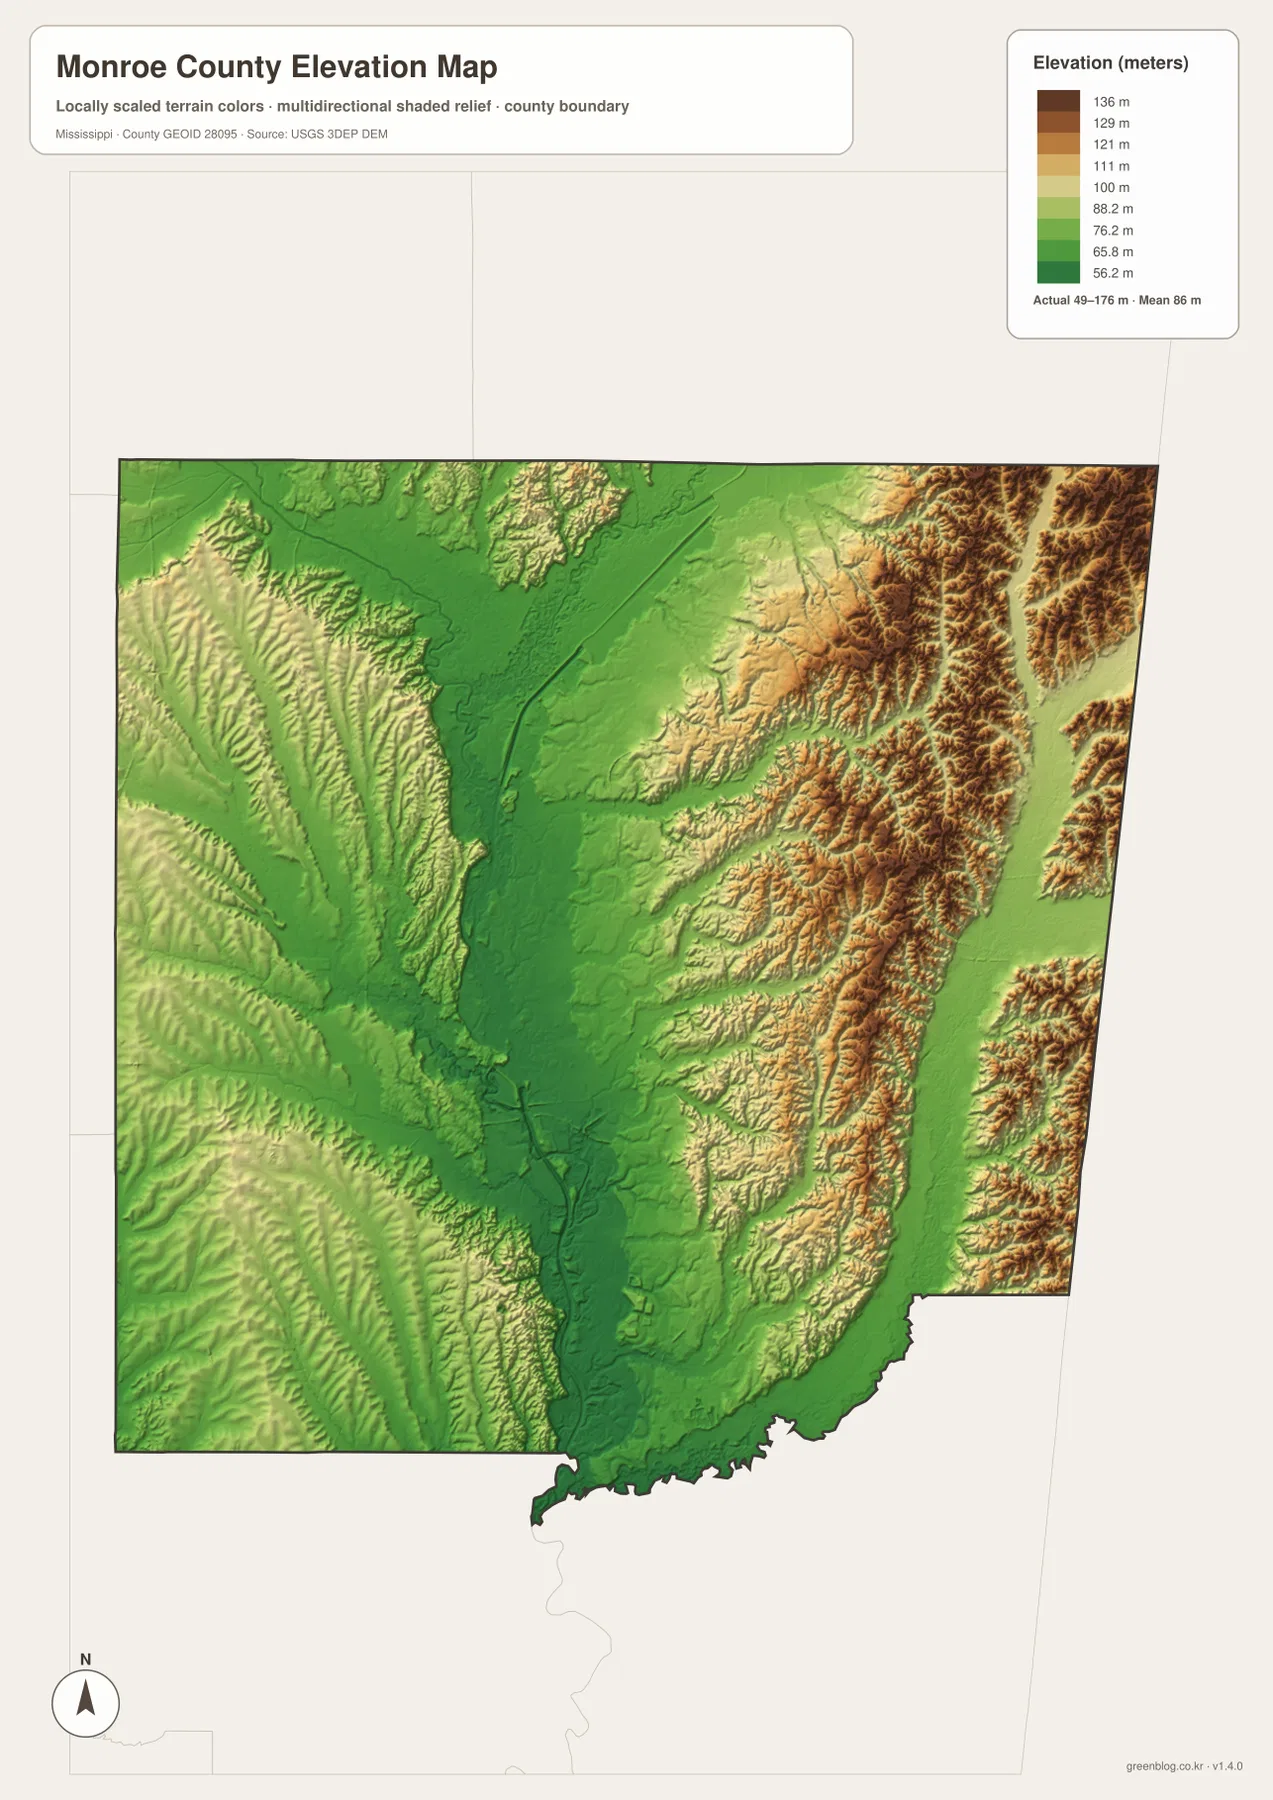
The elevation map gives an actual county range of about 49 to 176 meters and a mean of about 86 meters. The lowest broad area appears in green through the center, following the Tombigbee River and Aberdeen Lake corridor. Higher yellow, tan, and brown terrain becomes much more common toward the east and northeast. The western side is not flat; it contains long rolling ridges and narrow valleys, but the eastern relief is generally more tightly dissected and visually stronger.
Comparing the elevation and water maps is the easiest way to see how these features fit together. The central river corridor forms a long low strip. On the east, tributaries such as the Buttahatchee River and Weaver Creek occupy lower cuts between higher ridges. The elevation colors also show that the county does not simply rise in one direction. Higher ground occurs on both sides of the central lowland, while some southern sections return to lower green terrain. That variation is why the shaded-relief image is more useful than a single countywide average elevation.
The legend is important when interpreting the colors. Darker brown does not mean alpine or mountainous terrain; it means higher ground within Monroe County’s own elevation range. The map is locally scaled, so a reader should use the meter values in the legend before attaching a terrain label. For classroom or planning illustrations, a good approach is to point out the low green Tombigbee corridor first, then compare it with the ridged eastern area and the rolling western uplands.
Choose the map that matches the question
Use the general county map when roads, towns, boundaries, and water need to be seen together. It is the best starting point for finding Aberdeen, Amory, Nettleton, Smithville, Hamilton, Gattman, and the main road shields on one page. The city map is better when the purpose is to compare the relative positions of the six indexed places without extra road detail. For water-focused questions, the terrain-and-water map adds the Tombigbee River, Aberdeen Lake, lock pools, named lakes, and multiple creeks that are difficult to distinguish on the basic map.
The elevation map answers a different set of questions. It is the clearest choice for comparing the low central corridor with the higher eastern ridges, or for showing that stream valleys cut through land that is higher on either side. In a report or presentation, one map may be enough if the question is narrow. For a fuller geographic explanation, using the city, water, and elevation maps together makes the connection between settlement, waterways, and terrain much easier to demonstrate without crowding every detail onto one image.
Frequently Asked Questions
How do Aberdeen and Amory differ on the Monroe County maps?
Aberdeen is the county seat and is shown beside the broad Aberdeen Lake and Tombigbee River area in the central-southern county. Amory lies farther north where several roads and communities come together. Using both cities as references makes it easier to separate the administrative center from the northern settlement and transportation cluster.
Why is the Tombigbee corridor so low on the elevation map?
On the supplied elevation map, the Tombigbee River and Aberdeen Lake line up with a broad green lowland through the middle of the county. When the same area is compared with the water map, the low corridor follows the main river-and-lake system, while higher ridges are more common to the east and northeast.
What is included in the Monroe County map download?
The ZIP contains four high-resolution JPG files: a county reference map, a ranked city map, a terrain-and-water map, and an elevation map showing an actual range of about 49 to 176 meters. The files are prepared in an A3 print layout.
Map File Information
The download ZIP contains the Monroe County reference map, city map, water map, and elevation map as high-resolution JPG files. They use an A3 print layout and provide larger originals than the WebP previews shown on this page.
- Included Files: county map, city map, water map, elevation map
Related Maps
Sources and references
The population, area, road, and water references below provide official context for the county. The map descriptions in this article prioritize features actually visible in the four Monroe County images supplied with the rewrite package.
- U.S. Census Bureau QuickFacts for Monroe County
- U.S. Census Bureau Gazetteer Files
- Mississippi Department of Transportation official highway map
- U.S. Army Corps of Engineers Tennessee-Tombigbee Waterway information
Green Map creates custom-edited map images using open geographic data sources such as geoBoundaries, Natural Earth, OpenStreetMap, and government open data. These maps are edited visual materials, not raw data files, and are provided for education, documents, presentations, and graphic reference.