Thomas County’s 2025 land-cover pattern is not dominated by a single rural class. Forest leads at 37.77%, agriculture accounts for 27.33%, and wetlands cover 21.96%, while developed land makes up 8.92%. The largest built cluster sits around Thomasville, the county seat, and it stands out sharply against a county where farm fields are more common toward the north and east and broader forest and wetland areas appear through much of the south and west.
This page compares four views of the same county: current land cover, forest and farmland, impervious surface with developed land, and mapped class differences from 1985 to 2025. The body uses WebP previews, and the four original JPG maps are available together in one download. They can be used to compare the Thomasville area with surrounding rural land, separate farm and forest patterns, locate hard-surface concentrations, or check where long-term classifications differ.
Table of Contents
Thomasville creates a concentrated built center inside a mostly rural county
The most immediate contrast is between the large developed cluster near the west-central to southwestern part of the county and the much lighter rural landscape around it. Thomas County’s Board of Commissioners identifies Thomasville as the county seat and places the county in southwest Georgia along the Florida state line. That official context supports reading the largest red concentration as the Thomasville area, although the land-cover map does not draw municipal boundaries. The edge of the red class should therefore not be treated as the legal city limit.
Thin developed lines extend outward from the main Thomasville cluster, and smaller built patches occur in several other parts of the county. The county’s courthouse directions reference U.S. 19, U.S. 84, and U.S. 319 as major approaches through Thomasville. Those routes help explain why a separate road layer would be useful when studying the linear pattern, but the land-cover image itself does not label highways. A narrow red or orange trace should not be assigned a route number without checking TIGER/Line or another road dataset.
Official county materials also reference communities such as Boston, Coolidge, Meigs, Ochlocknee, Pavo, and Metcalfe. Small developed nodes are visible away from Thomasville, yet the map does not include town labels or incorporation lines, so matching each node to a specific community would go beyond what the supplied image proves. For a countywide overview, it is enough to note that one dominant built center is accompanied by smaller settlement and road-related clusters.
Developed cover totals 8.92% across Thomas County, but that percentage should not be imagined as an even layer spread across the entire county. Thomasville contains a much denser concentration, while large areas beyond it are primarily forest, agriculture, or wetlands. This difference between an average county share and a localized built center is one of the most useful things the map communicates.
Forest leads the 2025 total, but farms and wetlands occupy nearly half the county together
Forest is the largest 2025 class at 37.77%, yet the green areas do not form one uninterrupted block. Large forest patches are especially noticeable in the southern half and southwest, while narrower wooded areas weave through farm and wetland zones farther north. Agriculture is the second-largest class at 27.33%. Yellow farm patches are frequent across the northern and eastern parts of the map and continue around the outer edges of the Thomasville area.
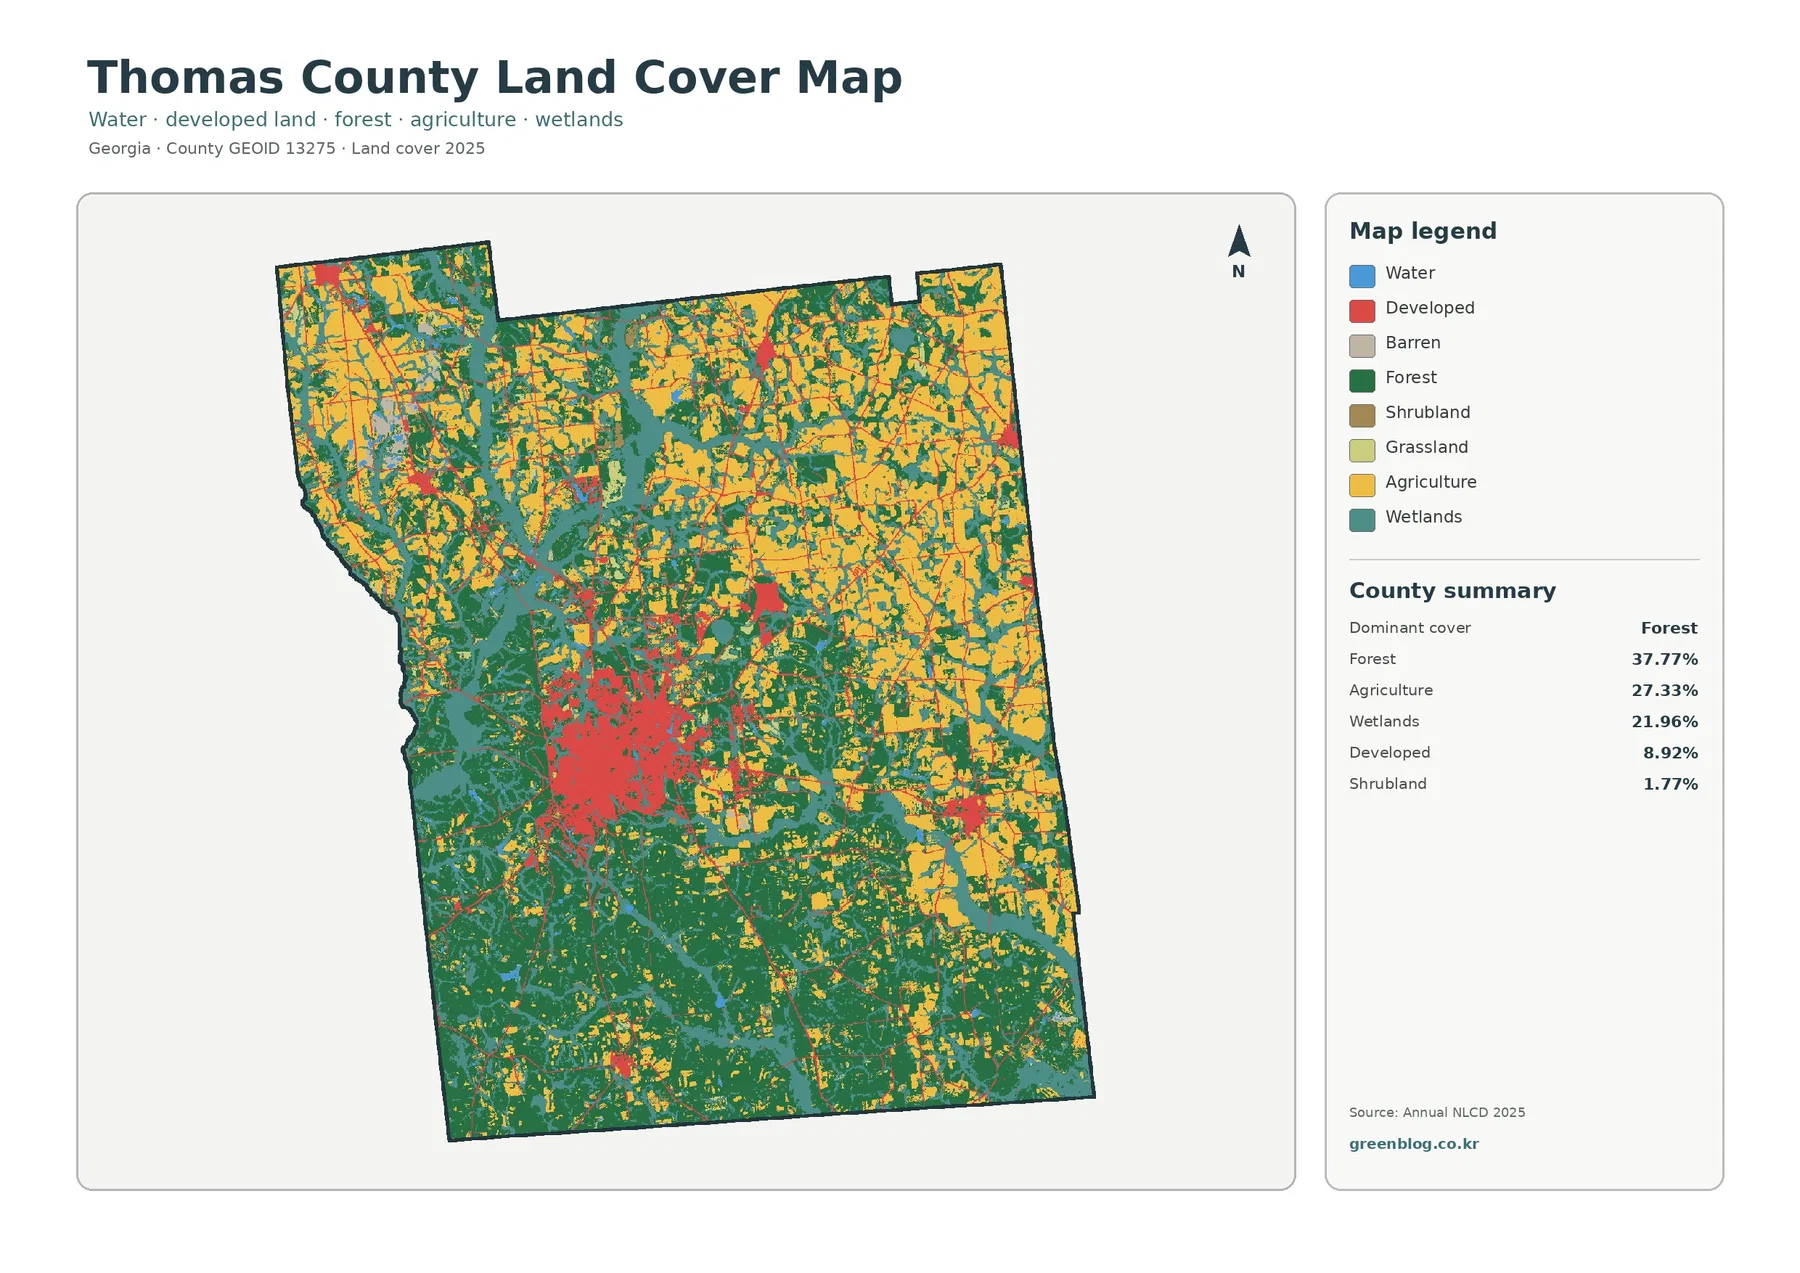
Wetlands account for 21.96%, a substantial share that is easy to miss if the map is described only as forest and farmland. Teal areas form broad and narrow ribbons along several winding corridors, including portions of the western side and multiple interior branches. Open water is only 0.84%, so the wetland percentage should not be reported as surface water. Vegetated wet ground and open water are separate land-cover classes in this map.
Shrubland is listed at 1.77% and grassland at 1.06%. Barren land appears in the legend but does not have a separate percentage in the supplied county summary. Rather than subtracting the listed values and calling the remainder barren land, this article leaves the unreported share unassigned. That approach follows the package rule to use only verified map values instead of creating a statistic that the source image does not provide.
| 2025 map summary | Share |
|---|---|
| Forest | 37.77% |
| Agriculture | 27.33% |
| Wetlands | 21.96% |
| Developed | 8.92% |
| Shrubland | 1.77% |
| Grassland | 1.06% |
| Water | 0.84% |
These categories describe what covers the ground as classified from satellite-based data. They do not show zoning, parcel ownership, tax status, or whether a site is legally available for development. A tract can be legally used for agriculture while its visible surface is partly forested, and a developed classification can include lawns or trees around buildings. Land cover and land use are related concepts, but they are not interchangeable.
The forest-and-farmland view makes the north–south contrast easier to see
Removing most of the developed detail from the foreground changes the way Thomas County reads. On the forest-and-farmland map, yellow cropland is frequent in the north and east, while dark green forest becomes more continuous through much of the south and southwest. The bright Thomasville area interrupts those rural classes near the center-left of the county. Wetlands remain visible as teal corridors that cut through both farm and forest areas rather than belonging to only one side of the county.
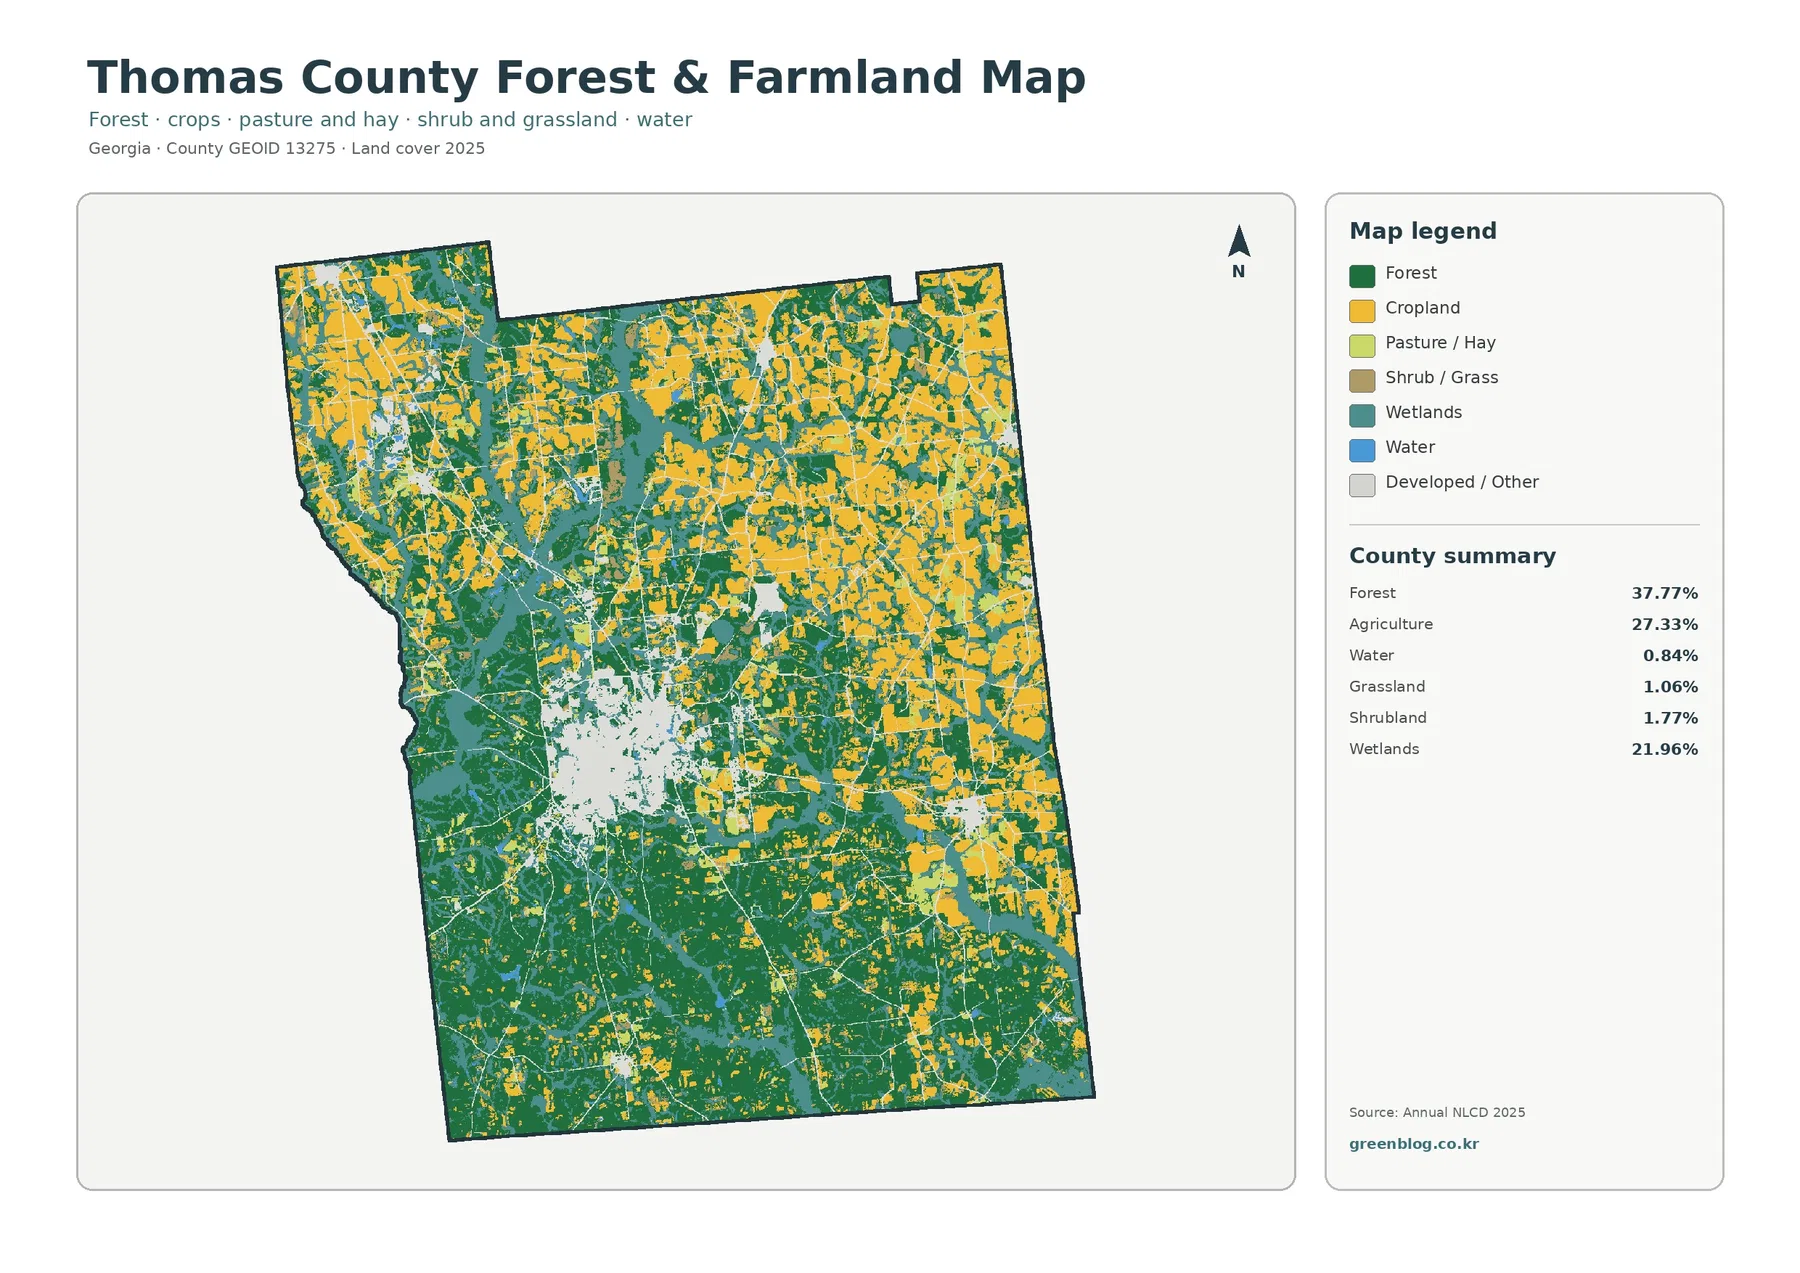
Local agricultural information adds useful context without changing what the map can prove. UGA Extension’s 2026 Thomas County annual report lists peanuts, cotton, and timber among the county’s top commodities. That supports the broader point that working agriculture and forestry are important local activities. It does not mean a yellow cell can be identified as a peanut or cotton field, because the Annual NLCD agriculture class is much broader than crop-specific mapping.
The same caution applies to the forest class. A dark green area indicates tree-dominated cover, not ownership, conservation status, or management purpose. A mapped forest could be privately managed timberland, unmanaged woodland, a narrow wooded corridor, or another tree-covered setting. A separate parcel, forestry, or conservation layer would be needed to answer those questions.
Wetlands frequently sit beside or between forest and agricultural patches. The pattern is useful for showing where the rural landscape is broken into smaller pieces, but proximity alone does not establish cause. The map cannot show that wetlands caused fields to stop at a certain line, or that forest remained in place because of wet conditions. Soil, drainage, topography, ownership, and historical land use would need separate evidence.
Only 1.94% mean impervious cover is concentrated heavily in a few places
Impervious surface means hard cover such as rooftops, paved roads, and parking areas where water does not readily soak into the ground. Thomas County’s mean impervious value is 1.94%, and only 0.84% of the county falls in cells that are at least 50% impervious. Those values are much lower than the 8.92% developed-land share because developed classes can include lawns, trees, bare soil, and other permeable surfaces around buildings and roads.
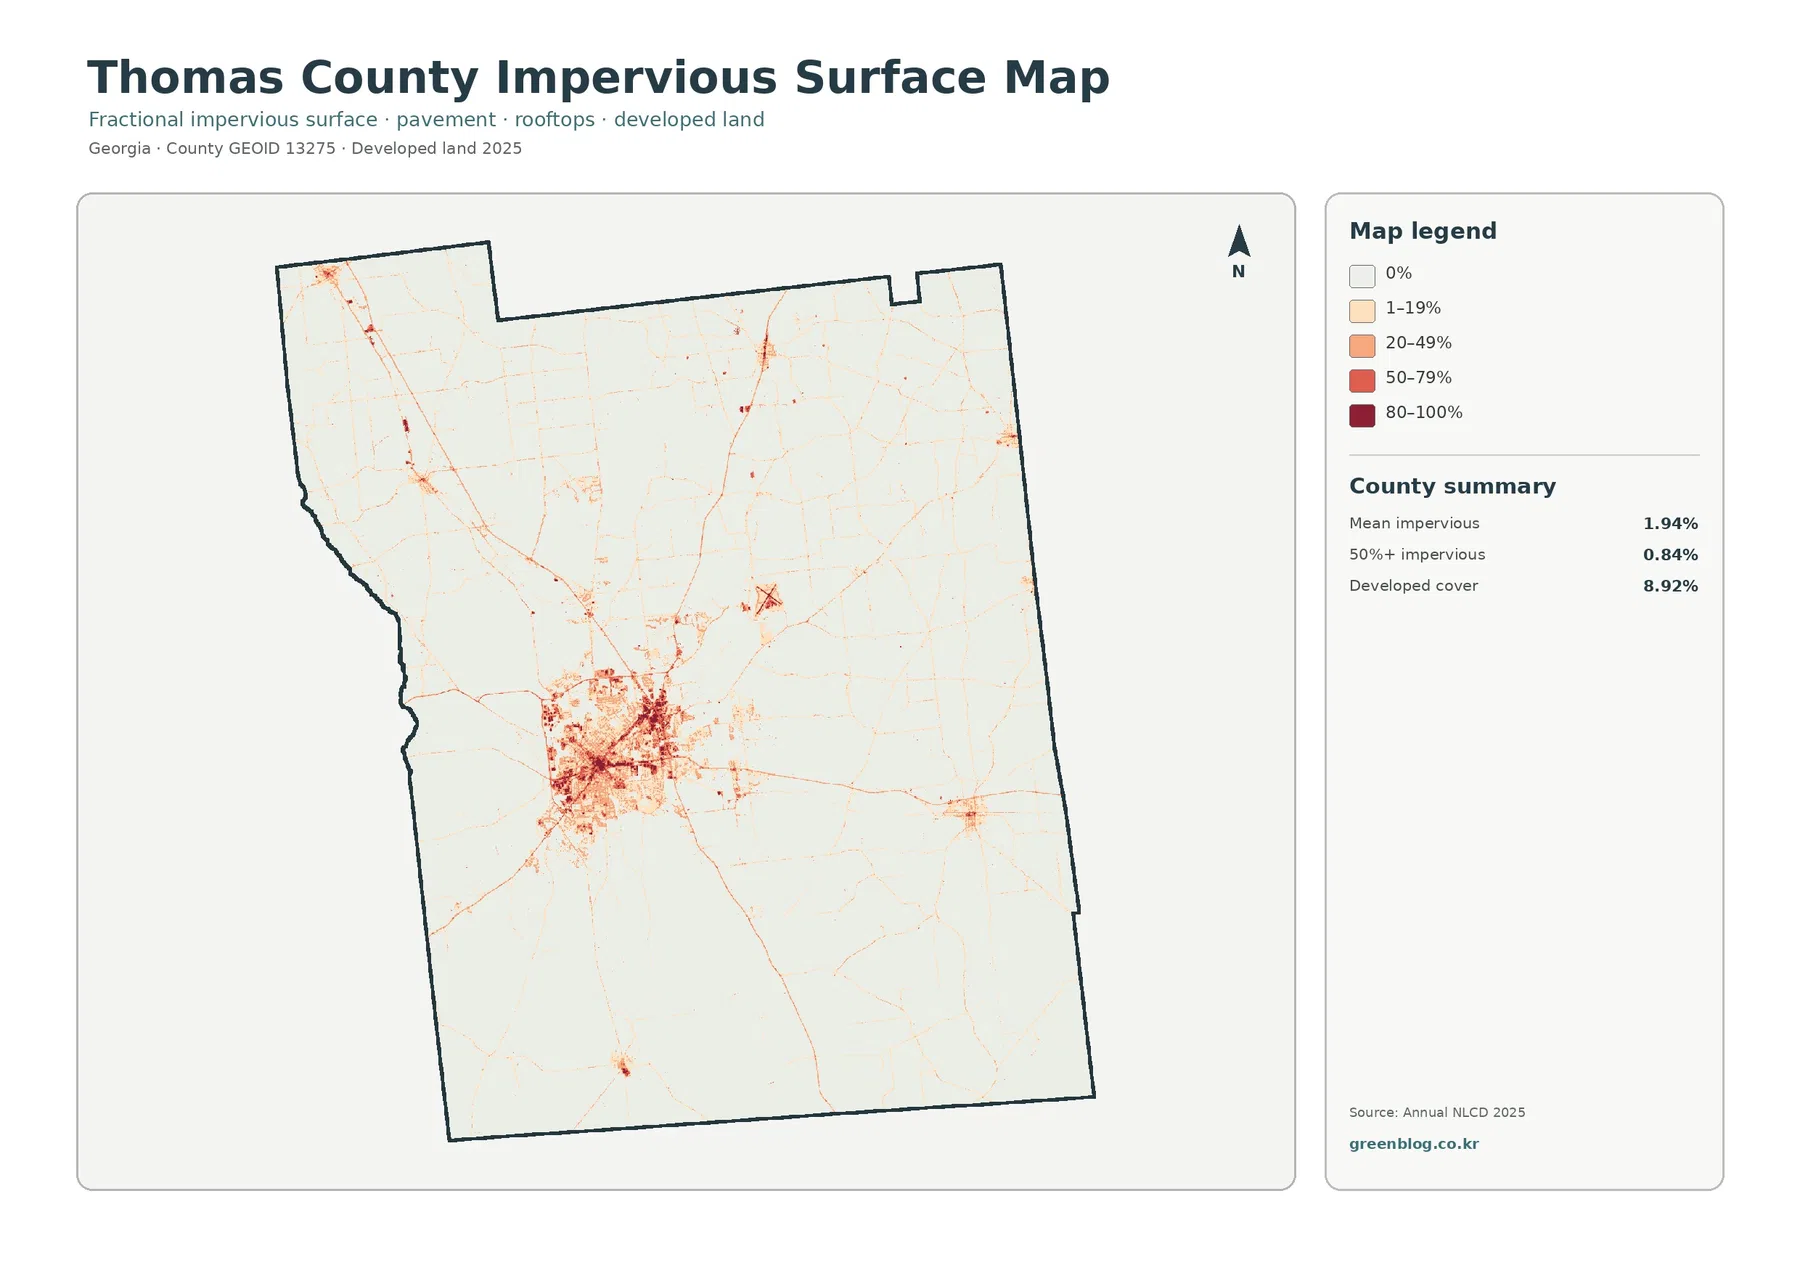
Most of the county appears in the 0% or 1–19% ranges, which gives the map a very light background. Around Thomasville, the pattern changes abruptly: 20–49%, 50–79%, and some 80–100% cells cluster together. Thin lines extend from the built center and connect to smaller concentrations elsewhere. The map is therefore better at showing where hard surfaces concentrate than at describing the county with one average number.
The largest hard-surface cluster corresponds closely with the major Thomasville developed area seen on the general map. Outside that center, high impervious values become sparse even where some land is still classified as developed. This is a useful reminder that “developed” and “paved” are not synonyms. A low-intensity residential area may contain considerable vegetation, while a commercial block can have a much higher impervious fraction within a small footprint.
For stormwater or heat-related discussions, location matters more than treating 1.94% as a uniform condition. Large forest, farm, and wetland areas include many cells with little or no mapped hard surface, whereas the Thomasville core contains compact high values. Detailed engineering analysis would still require local drainage, building, pavement, and elevation data, but this map provides a clear county-scale screening view.
The 1985–2025 map records 15.05% class difference, not 15.05% new development
The change map compares classifications from 1985 with those from 2025. Its county summary reports 15.05% total class difference. Within the listed categories, agricultural loss is 4.51%, other class difference is 4.36%, forest loss is 3.06%, and areas classified as developed are 1.88%. Wetland difference appears in the legend but is not given a separate summary percentage, so no additional rate is calculated here.
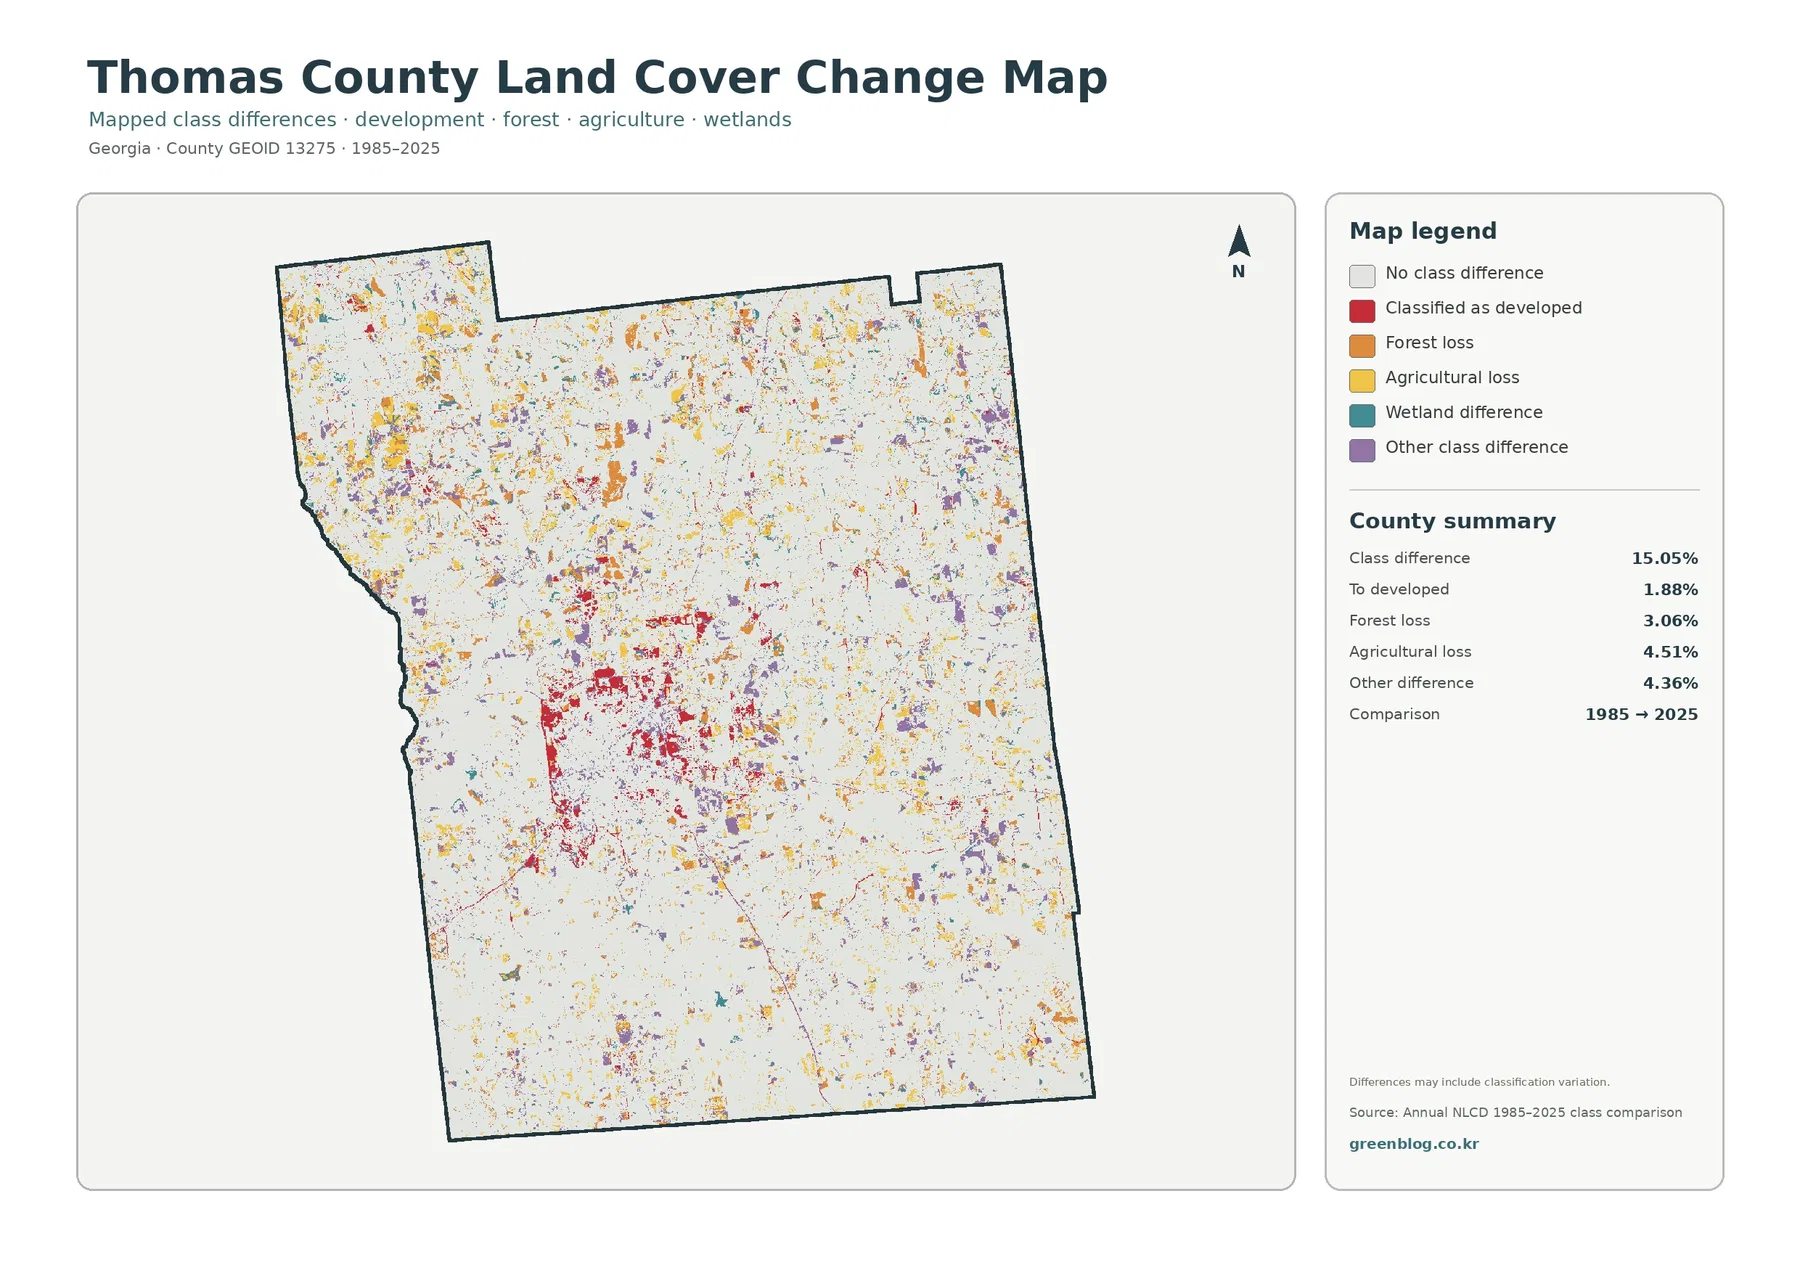
Red developed-change cells are more concentrated around the Thomasville area than in most of the county, while orange forest-loss, yellow agricultural-loss, and purple other-difference patches are scattered much more widely. That visual pattern does not support saying that 15.05% of Thomas County was urbanized. The mapped-to-developed category is 1.88%; the larger total combines several kinds of class differences.
Agricultural loss should not be read as a 4.51% decline in farm output, and forest loss is not automatically a 3.06% measure of permanent clearing. These categories mean cells differed between the two classification dates. Crop rotation, fallow periods, vegetation recovery, timber harvest, development, moisture conditions, or classification behavior can all affect what appears in a two-date comparison. Confirming a specific cause would require intermediate imagery or other records.
The map itself notes that differences may include classification variation. Satellite observations and classification methods simplify a complex landscape into raster cells, so some change can reflect how the surface was recorded and categorized rather than a single physical event. The change layer is most useful for locating areas that deserve a closer look, not for assigning causes from color alone.
Choosing one map first can make a report or presentation much clearer
For a quick description of Thomas County in 2025, start with the general land-cover map. It places the leading forest share, the large farm and wetland components, and the Thomasville built area in one view. If the main question concerns working land and wooded cover, the forest-and-farmland map reduces visual clutter and makes the north/east agricultural pattern and southern forest blocks easier to explain.
The impervious map is the better choice when the topic is settlement intensity, paved surface, or the contrast between Thomasville and rural surroundings. It shows why an 8.92% developed-land share can coexist with a countywide mean impervious value of only 1.94%. For historical comparison, use the change map instead of the current developed map, because current location and long-term classification change are different questions.
In a classroom, one effective sequence is to read the legend on the general map, simplify the rural pattern with the forest-and-farmland view, then compare human-made hard surfaces on the impervious map. The change map can come last, once students understand that a class difference is not automatically a documented cause. In planning or research material, city boundaries, roads, parcels, soils, or flood-related layers can be added depending on the question.
County-to-county comparisons should also keep the measures separate. Thomas County is unusual enough to need more than one label: forest leads, yet agriculture and wetlands together account for nearly half the mapped area; development is concentrated around Thomasville; and high impervious values occupy a much smaller footprint than developed cover. Comparing only the largest category would miss those distinctions.
The download contains four 2480×1754 JPG maps
The page previews are 1800-pixel WebP images, while the download package contains the four original JPG maps: current land cover, forest and farmland, impervious surface with developed land, and the 1985–2025 class-difference map. The asset manifest records each JPG at 2480×1754 pixels. Because all four use the same county outline and a consistent layout, they work well as a matched set for on-screen comparison or document use.
The manifest does not mark these JPGs as meeting an A3 high-resolution reference. They are suitable for many screen and document uses, but a large-format print should be tested before final production. Fine impervious lines and small change cells may look coarse when enlarged substantially, and the legend text needs to remain readable at the intended print size.
Keep the legend and date visible when cropping the maps. Red on the 2025 general map means currently developed land, while red on the 1985–2025 change map means cells classified as developed in the comparison. Removing the legend can make the 8.92% current developed share look interchangeable with the 1.88% mapped-to-developed change, which they are not.
A presentation usually works better when the map is selected for the question rather than shrinking all four onto one slide. Use the impervious view to discuss Thomasville’s hard-surface concentration, the forest-and-farmland view to show the rural north–south contrast, and the change map only when the subject is the two-date comparison. A short note about classification variation is especially useful whenever the change layer is shown.
Raster classification is useful at county scale but not a substitute for parcel or regulatory data
Annual NLCD uses raster cells of roughly 30 meters. A raster divides the landscape into small square cells, and one cell can contain a road edge, trees, lawn, a building, a ditch, and part of a field at the same time. The classification assigns a representative cover type or an impervious percentage, so pixel edges will not always match the exact boundary seen on the ground.
The 21.96% wetland class should not be treated as a legal wetland jurisdiction figure. Satellite-based land cover and regulatory wetland delineation are different products with different purposes. The same is true for property ownership. Thomas County’s tax-assessment system provides parcel-related information separately; the land-cover maps do not identify owners, parcel lines, tax status, or development rights.
Dates also matter. The current maps summarize 2025, while the change layer compares 1985 and 2025. Construction, clearing, farming changes, or vegetation recovery after 2025 are outside this map set. When a decision depends on the present condition of a specific site, recent aerial photography, field inspection, and the appropriate county or state records should be checked in addition to these countywide maps.
Used at the intended scale, the set is strong for broad comparison. It shows where forest, farms, wetlands, and development are concentrated; where hard surfaces form compact clusters; and where two classification dates differ. It is less appropriate for measuring a parcel, naming an individual crop, locating a regulatory boundary, or proving why a particular land-cover change occurred.
Frequently Asked Questions
What is the largest 2025 land-cover class in Thomas County?
Forest is the largest class at 37.77%. Agriculture follows at 27.33%, wetlands at 21.96%, and developed land at 8.92%. The forest-and-farmland summary also lists shrubland at 1.77%, grassland at 1.06%, and water at 0.84%.
Why does Thomasville stand out more strongly on the impervious map than the county average suggests?
High impervious values are concentrated around the main Thomasville built area rather than spread evenly across Thomas County. Mean impervious cover is 1.94%, while only 0.84% of the county is mapped at 50% impervious or higher.
Does the 15.05% class difference from 1985 to 2025 mean that much of the county became developed?
No. The mapped-to-developed category is 1.88%. The 15.05% total also includes agricultural loss, forest loss, wetland differences, and other class differences, and the source map warns that classification variation may be included.
Related Maps
- Appling County Georgia Land Cover Map
- Atkinson County Georgia Land Cover Map
- Bacon County Georgia Land Cover Map
Sources and references
- MRLC Annual NLCD Data – official access point for the land-cover and impervious-surface datasets used for the supplied maps.
- USGS Annual NLCD Land Cover Classification – explains the Annual NLCD classes used for forest, agriculture, developed land, wetlands, and other cover types.
- U.S. Census Bureau TIGER/Line Shapefiles – official boundary and road data for adding geographic reference to a county-scale land-cover map.
- UGA Extension Thomas County – research-based agriculture and natural-resources information for Thomas County residents and producers.
- UGA Extension Thomas County Annual Report – county-specific agricultural context, including leading commodity information.
- Thomas County Board of Commissioners – Courthouse Location – identifies Thomasville as the county seat and references U.S. 19, 84, and 319 as major approaches.
Green Map creates custom-edited map images using open geographic data sources such as geoBoundaries, Natural Earth, OpenStreetMap, and government open data. These maps are edited visual materials, not raw data files, and are provided for education, documents, presentations, and graphic reference.