Mississippi County is one of the clearest farm-dominated landscapes in Arkansas in the 2025 map set. Agriculture accounts for 82.12% of the county, yet that broad yellow field is broken by a large wetland-and-water complex in the northwest, a winding river boundary on the east, and compact developed clusters in several settled areas.
This page pairs four views of the same county: current land cover, forest and farmland, impervious/developed land, and mapped class differences from 1985 to 2025. The article uses WebP previews for quick viewing, while the four original JPG maps are available together in one ZIP download below.
Table of Contents
A Delta County Where Agriculture Covers 82.12%, but Water and Development Still Reshape the Pattern
The general 2025 land-cover view is dominated by agriculture from the straight western edge almost to the Mississippi River side of the county. Large blocks of farmland connect across most of the interior rather than appearing as isolated openings. The summary lists agriculture at 82.12%, far ahead of every other mapped class.
Wetlands account for 7.36%, developed cover for 7.05%, water for 2.97%, and barren cover for 0.34%. Forest is so limited that the forest-and-farmland summary reports only 0.15%. Those countywide percentages describe classified raster cells across the whole county; they are not parcel statistics and should not be assigned to a particular farm or city block.
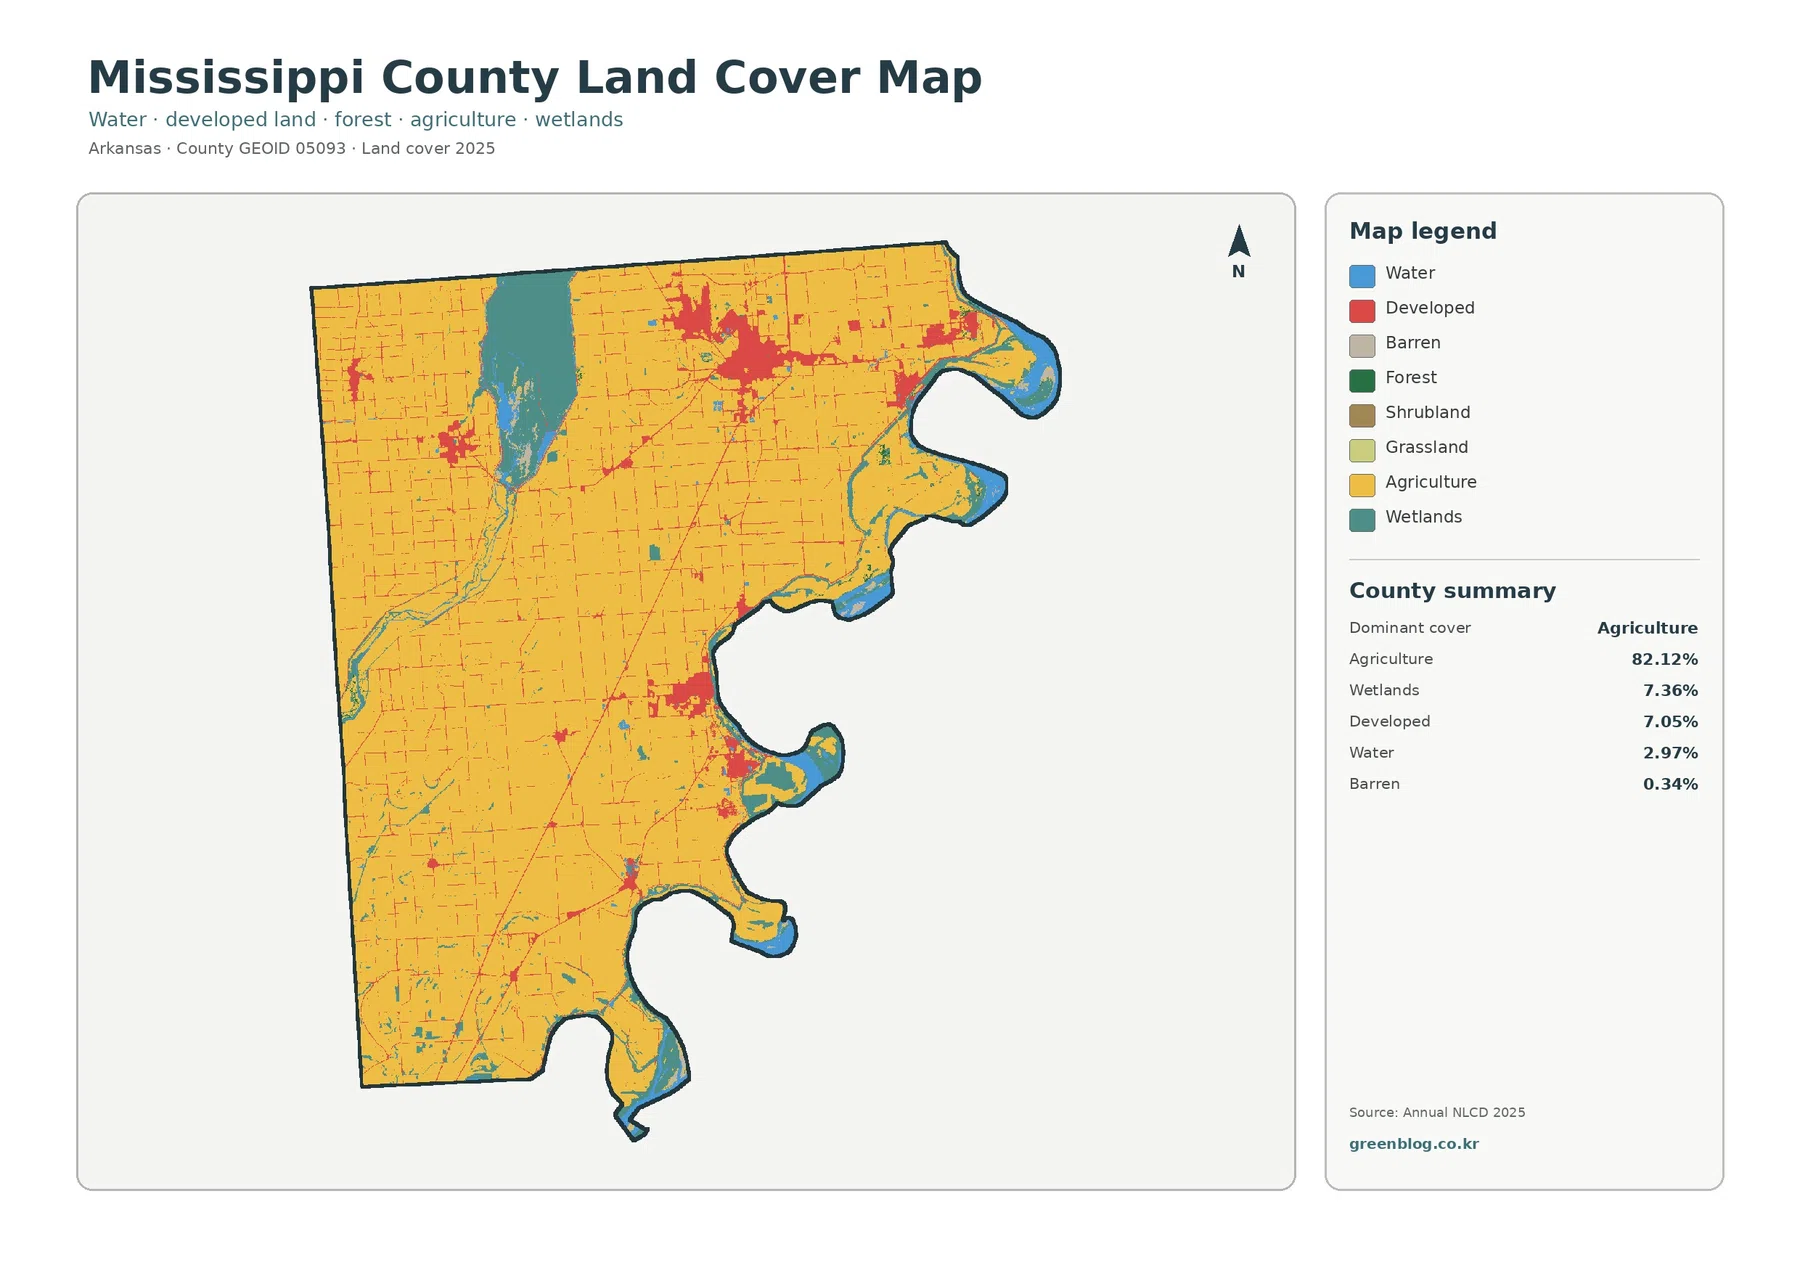
The northwest immediately interrupts the farm-dominated pattern. A large teal-and-blue area stands out against the surrounding cropland. The U.S. Fish and Wildlife Service identifies Big Lake National Wildlife Refuge in Mississippi County west of Manila, providing a verified local context for this broad lake-and-wetland landscape. The map is not a refuge-boundary map, so its wetland colors should not be treated as the legal outline of protected land.
The eastern boundary is different again. Instead of a straight county line, it bends around large curves and narrow protrusions. Encyclopedia of Arkansas notes that the Mississippi River forms the county’s eastern boundary. Agriculture often reaches close to that edge, while water and wetland cells recur along the river side, creating a much more irregular pattern than the large rectangular farm blocks inland.
The 1985–2025 Difference Map Is Sparse Compared with the Strong Current Farm Pattern
The change map answers a different question from the 2025 land-cover view. It highlights cells whose representative class differs between 1985 and 2025. Mississippi County’s overall class-difference figure is 4.55%, which is small next to the 82.12% current agricultural share. Most of the county therefore appears without a highlighted class difference in this two-date comparison.
Within the 4.55% total, 2.34% is summarized as change to developed, 0.45% as agricultural loss, 0.01% as forest loss, and 1.37% as other difference. The legend also includes wetland difference, but the printed summary does not provide a separate percentage for that category. It is better to use the values that are explicitly supplied rather than calculate an unsupported number from the remainder.
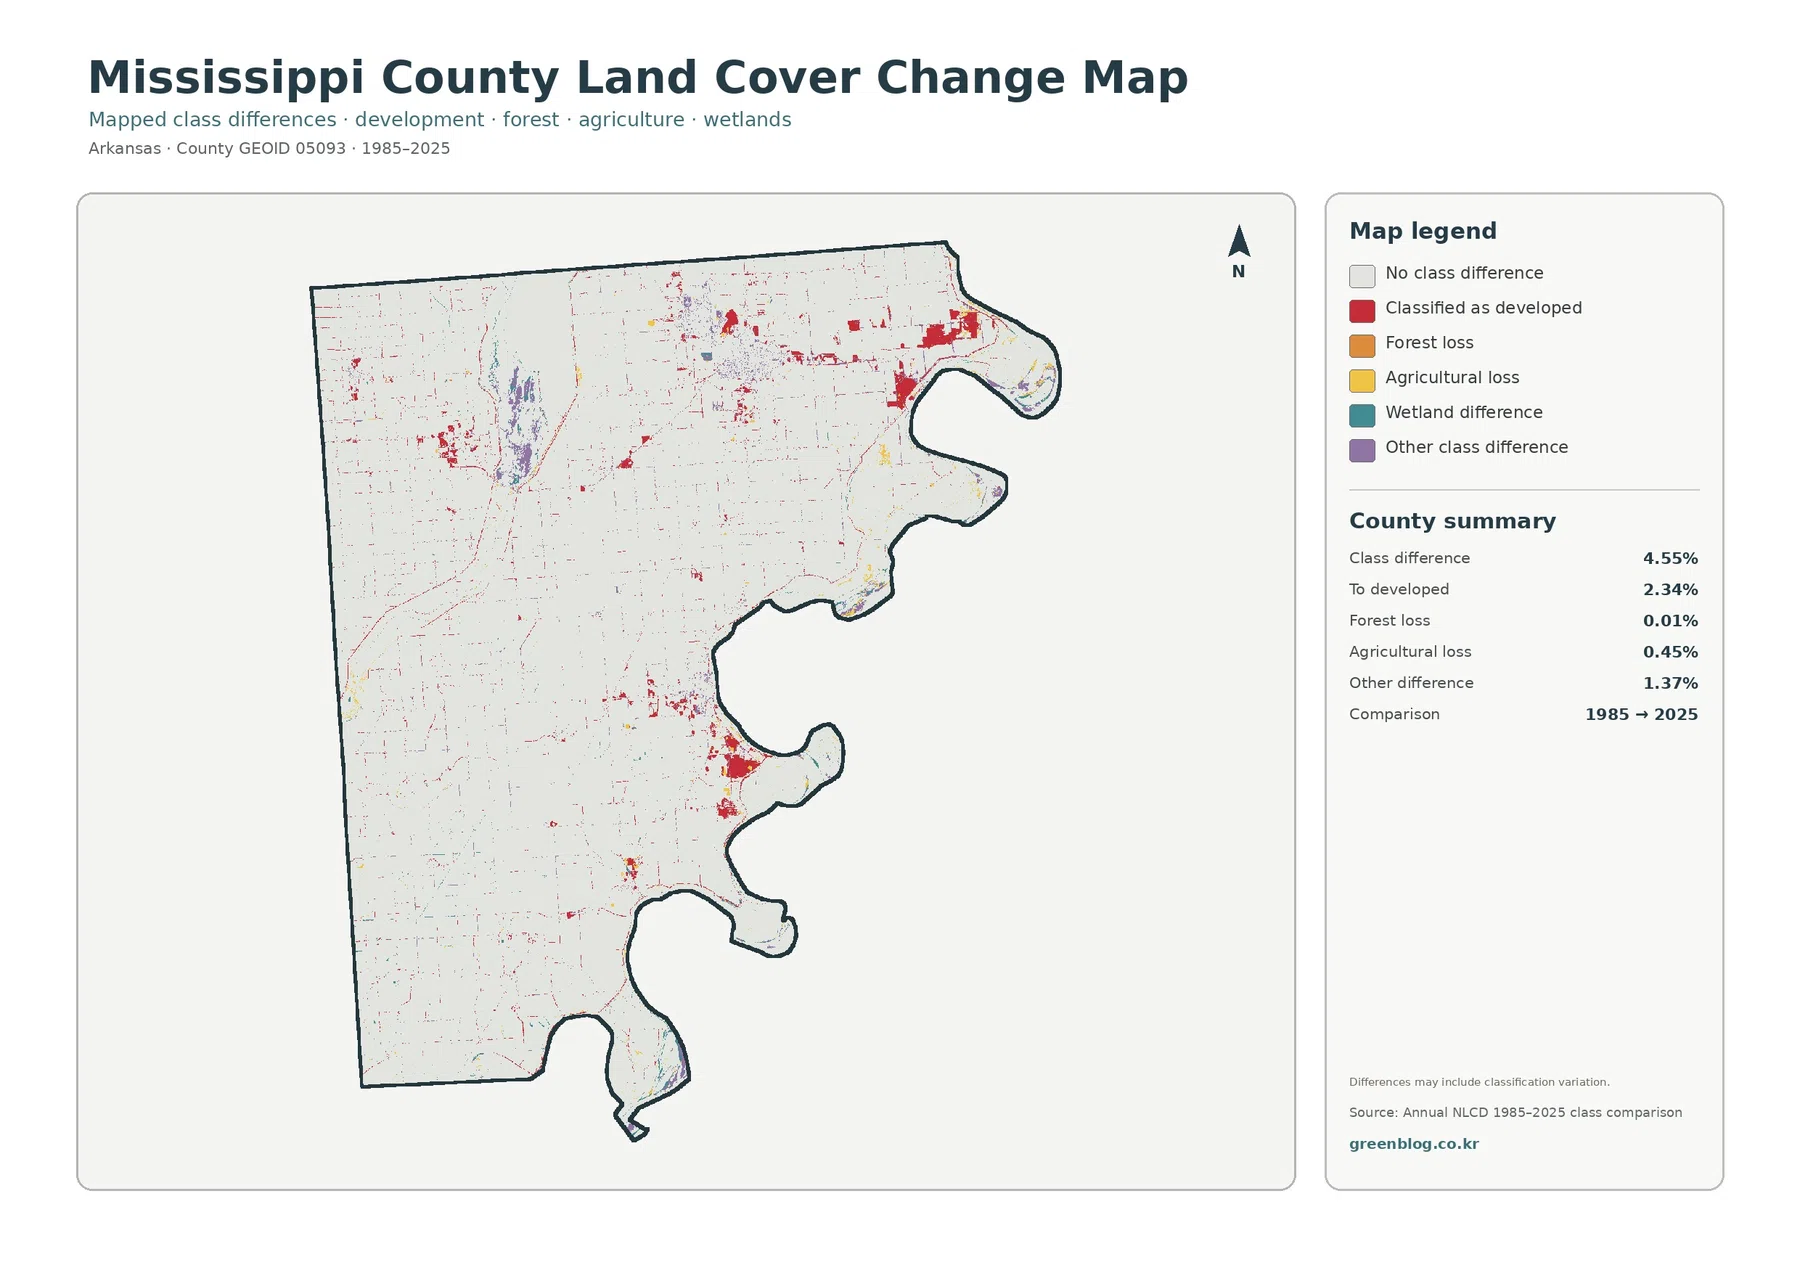
Red change patches are most noticeable around places that are already developed in the current map, especially in the northern part of the county and around an east-central cluster. Smaller marks appear along thin corridors and scattered rural locations. Around the northwest wetland complex, other class-difference colors also appear, while extensive portions of the agricultural interior remain unhighlighted.
A class difference is not automatically a documented land-use conversion. The map records a different classification at two dates, not the cause. Construction, crop-field boundaries, water conditions, vegetation changes, or classification behavior in mixed cells can all affect the result. Confirming a specific change requires additional imagery, records, or field information.
Mean Imperviousness Is 2.53%, with Hard Surfaces Concentrated in Compact Clusters
Impervious surface means pavement, rooftops, parking areas, and other hard surfaces that do not readily absorb rainfall. The countywide mean is 2.53%, while cells with at least 50% impervious surface account for 1.62%. That low average makes sense in a county where agriculture covers more than four-fifths of the mapped area, but the distribution is far from uniform.
The darkest impervious colors gather in several developed concentrations rather than spreading broadly through farm country. A large northern cluster and another prominent east-central cluster are easy to distinguish. Smaller developed spots occur elsewhere, and thin lines link some of the settled areas. Those lines can resemble transportation corridors, but the map does not identify road numbers or traffic volume.
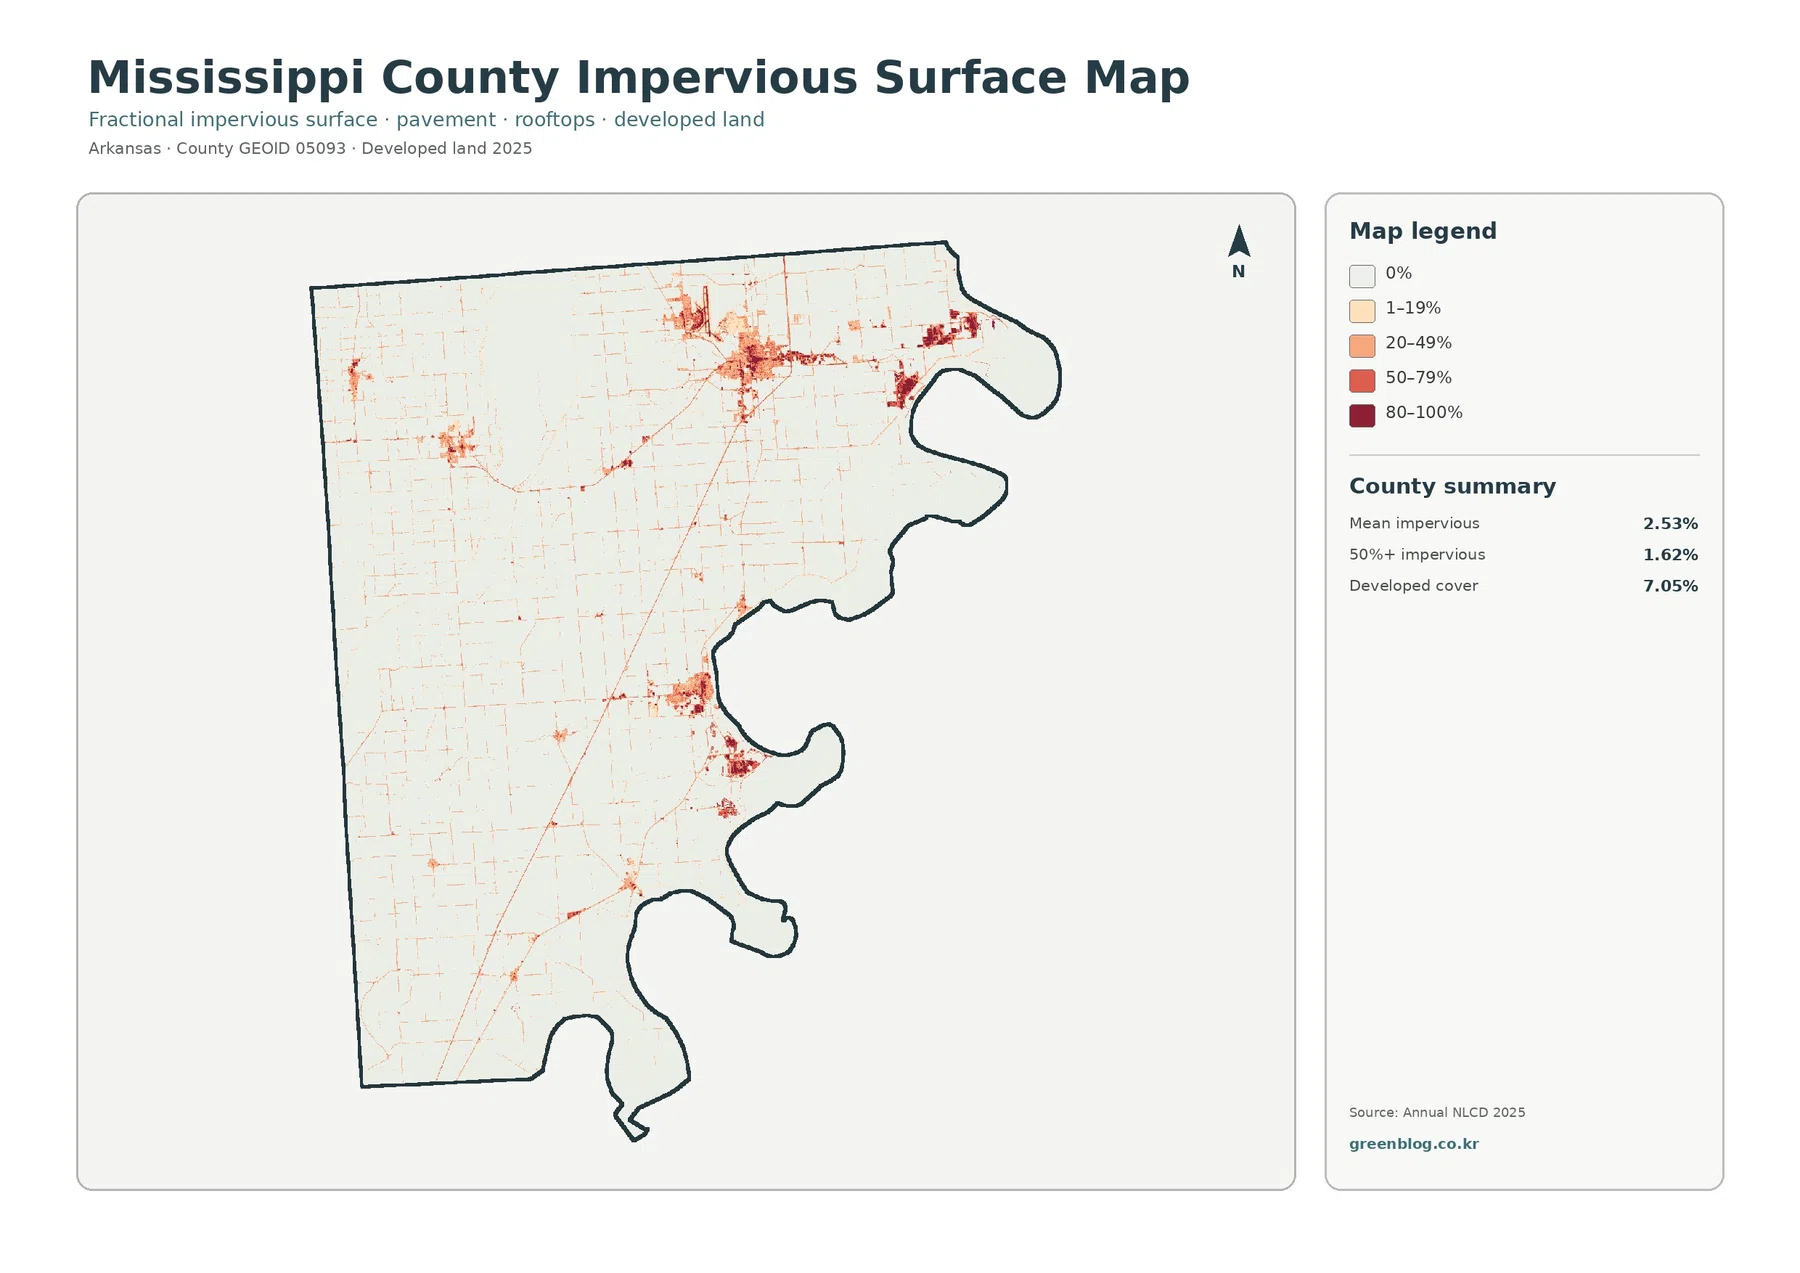
Developed cover at 7.05% and mean imperviousness at 2.53% describe related but different things. A developed land-cover class can include lawns, trees, drainage areas, and other permeable surfaces mixed with structures and pavement. Fractional impervious data instead estimates how much of each cell is hard surface. A suburban or low-density edge can therefore be classified as developed without appearing in the darkest impervious category.
The University of Arkansas System Division of Agriculture lists Osceola, Blytheville, Manila, and other towns among the communities served by the Mississippi County Extension office. That local reference helps explain why several developed clusters appear within an otherwise rural map. It does not, however, make the red raster boundaries equivalent to municipal limits. City boundaries require a separate administrative map.
Removing Most Urban Detail Makes the Farm–Wetland Contrast Even Clearer
The forest-and-farmland map simplifies the county into categories that are easier to compare across rural areas. Cropland fills most of the map, while the legend also distinguishes pasture/hay, shrub/grass, wetlands, water, forest, and developed/other. The county summary keeps agriculture at 82.12%, water at 2.97%, wetlands at 7.36%, and forest at just 0.15%.
Forest is not a broad background class here. Small green pieces are scattered and easily overshadowed by cropland, especially when compared with forest-heavy counties in the Ozarks or Ouachitas. The larger natural interruption is wetland cover. Teal areas occupy a substantial block in the northwest and reappear in smaller patches near water and along parts of the eastern side.
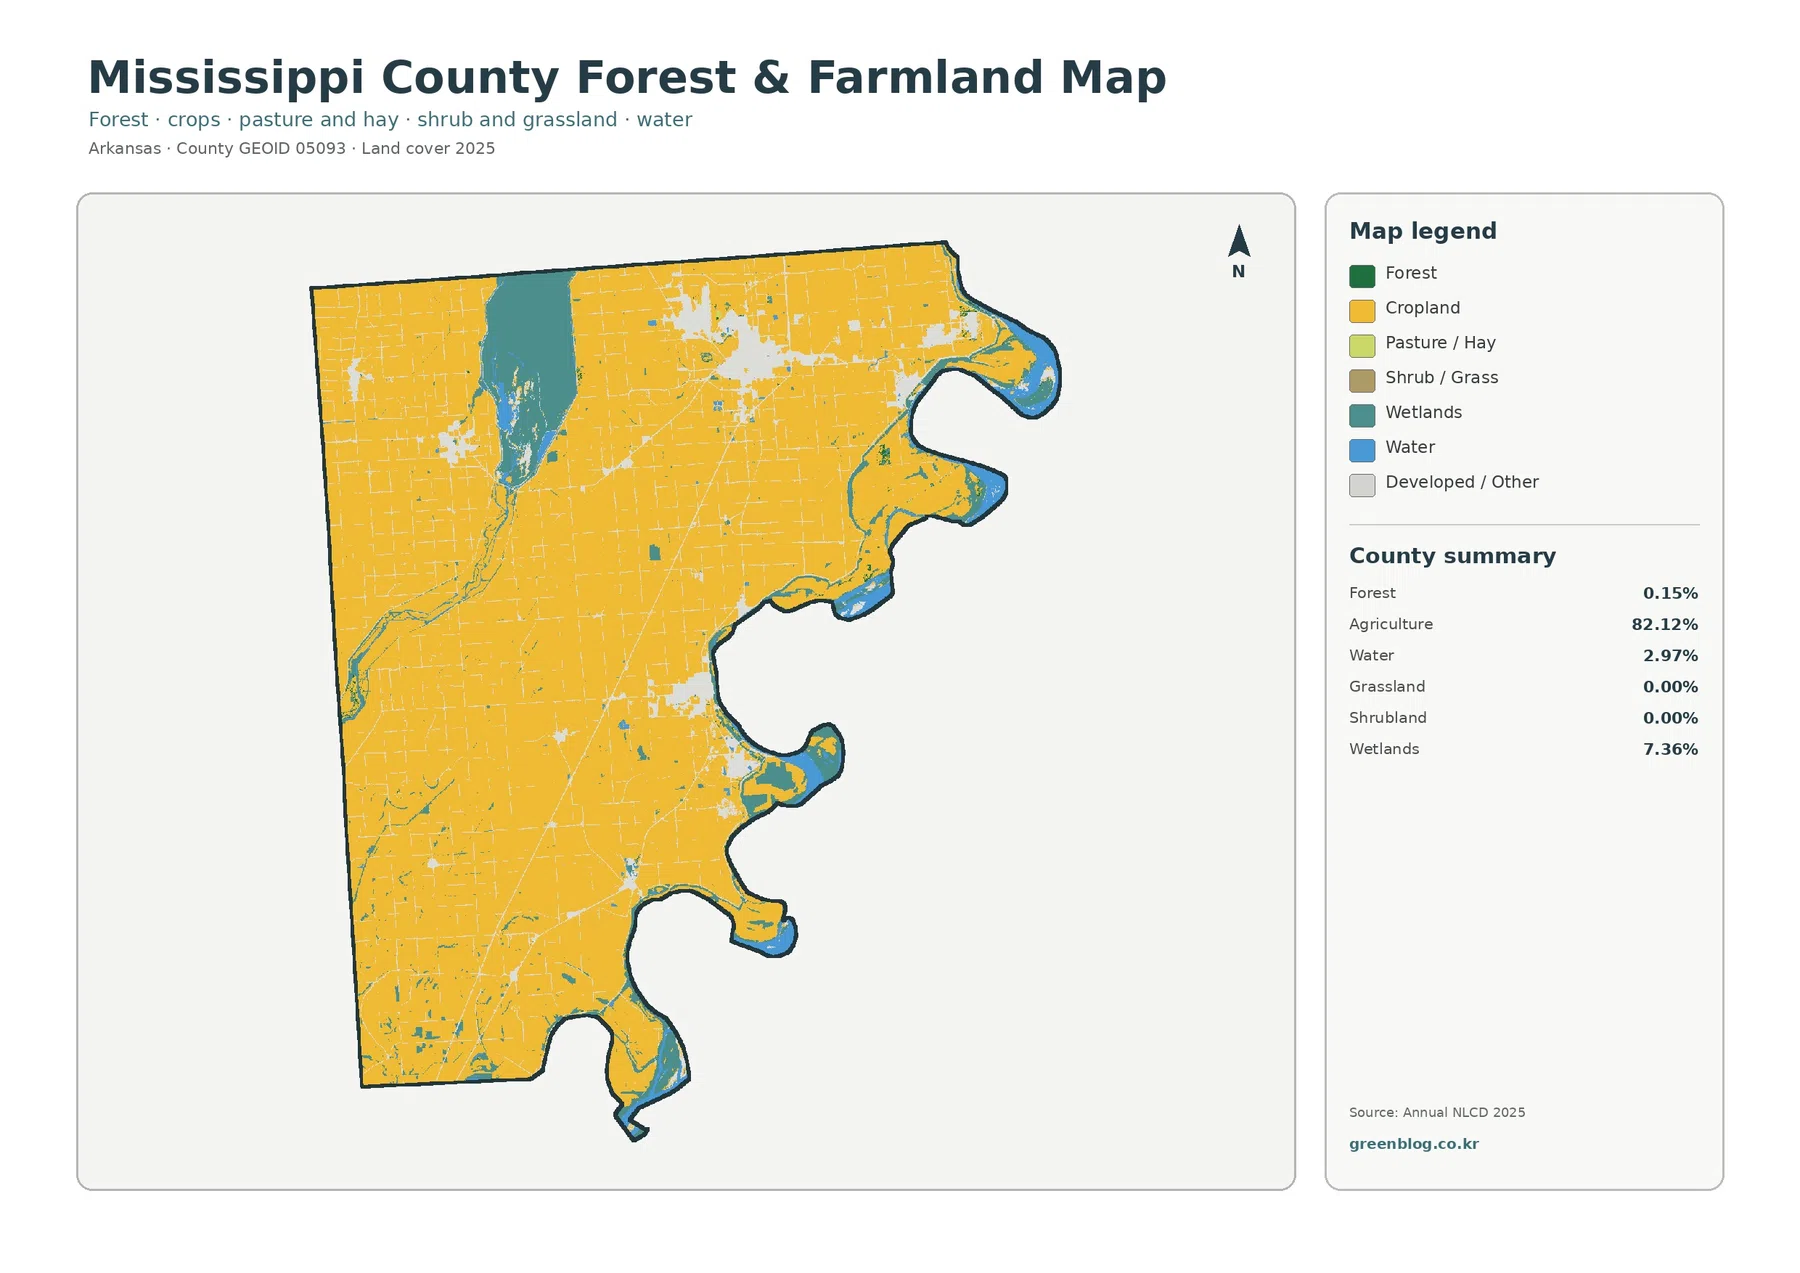
Local agriculture sources support the importance of row crops without turning the land-cover map into a crop map. The Mississippi County Extension program has documented work involving corn, cotton, soybeans, rice, wheat, and peanuts. The yellow agricultural class cannot tell which of those crops occupies a particular field, and it does not provide planting dates, yields, irrigation methods, or ownership.
Wetland cover needs similar caution. The 7.36% figure is a land-cover classification, not a legal wetland inventory or floodplain designation. A planning, permitting, or conservation decision may depend on boundaries and criteria that are not represented here. The map is strongest when the question is simply where wet-looking or wetland-classified surfaces form large concentrations at county scale.
The Mississippi River and Big Lake Give the County Two Very Different Water Edges
Mississippi County sits in the northeastern corner of Arkansas, with the Mississippi River shaping its eastern side. Encyclopedia of Arkansas describes the county as a major agricultural area known especially for cotton, soybeans, rice, and corn. That background fits the 2025 classification, where agriculture dominates the interior while river-related water and wetland cover becomes more visible toward the east.
Big Lake creates a second water-focused landscape far from the main river edge. The U.S. Fish and Wildlife Service describes Big Lake National Wildlife Refuge as an 11,038-acre refuge in Mississippi County with lake, swamp, and bottomland habitat. On the land-cover map, the northwest water-and-wetland block stands out sharply because the surrounding landscape is so heavily agricultural.
These two settings are useful for reading shape as well as color. The river side has long bends and narrow strips where agriculture, wetland, and water sit close together. The Big Lake area appears as a broader interior concentration. Similar colors can therefore represent very different landscape arrangements, which is why a county-specific reading is more useful than a generic list of legend classes.
U.S. Census Bureau QuickFacts reports 902.09 square miles of land area for Mississippi County in the 2020 geography statistics. Compressing an area of that size into one page is valuable for seeing regional contrasts, but it necessarily removes parcel-scale detail. A farm boundary, drainage ditch, narrow tree line, or single commercial property can be smaller than the mapped pattern suggests.
Use Each Map for a Different Question Instead of Treating the Four Views as Duplicates
For a quick overview, begin with the general land-cover map. It establishes the overwhelming agricultural background and locates the largest wetland, water, and developed exceptions. A classroom or presentation can use this first view to explain why percentages matter: 82.12% agriculture produces a very different county appearance from a place where forest or water is dominant.
Next, use the forest-and-farmland view when the goal is to compare open agricultural land with the much smaller natural-cover categories. The northwest wetland block becomes easier to isolate, and the scarcity of forest is more obvious. This map is particularly useful when discussing the contrast between Delta farming and wetland habitat without the stronger urban colors of the general map.
The impervious map should be consulted for built surfaces. It reveals where hard surfaces concentrate inside the broader 7.05% developed class and prevents a common mistake: assuming every developed cell is mostly pavement. Finally, the change map adds the time dimension. Its 4.55% class-difference figure should be interpreted alongside the current maps so that a small highlighted patch is not mistaken for a dominant present-day land cover.
These maps can support environmental education, county comparison, watershed discussion, printing, and presentation graphics. They can also help a reader choose where to look for more detailed information. They should not be used to decide ownership, zoning, wetland jurisdiction, tax status, building permissions, or exact field acreage, because those questions require different records and finer-scale data.
Download the Four Original Mississippi County JPG Maps
The ZIP contains four separate JPG files matching the maps shown on this page: 2025 general land cover, forest and farmland, impervious/developed land, and 1985–2025 land-cover change. The supplied asset manifest lists each original JPG at 2480×1754 pixels and each article WebP preview at 1800×1273 pixels. The manifest does not mark the originals as meeting its A3 high-resolution reference, so the files are described at their supplied size rather than as upscaled print products.
Thirty-Meter Raster Cells Generalize Fields, Ditches, Roads, and River Edges
USGS describes Annual NLCD as raster data derived from Landsat imagery at 30-meter spatial resolution. A raster divides the landscape into grid cells, and each cell receives a representative land-cover class or a fractional impervious value. That structure is excellent for regional comparison, but it simplifies boundaries that are more complicated on the ground.
The limitation matters in Mississippi County because narrow drainage features, straight field edges, rural roads, scattered buildings, and wetland margins can occur close together. A 30-meter cell may contain parts of more than one surface. Small features can disappear into the dominant neighboring class, while edges can look stepped rather than following a survey line.
The current maps are labeled 2025, and the comparison uses 1985 and 2025. Construction, crop rotation, vegetation recovery, flood conditions, or other changes after the observation period may not appear. When a decision depends on current conditions, pair these maps with recent aerial imagery, local government information, field observations, and the specialized agency data appropriate to the question.
Frequently Asked Questions
What is the dominant 2025 land-cover class in Mississippi County?
Agriculture is dominant at 82.12%. Wetlands account for 7.36%, developed cover for 7.05%, water for 2.97%, and barren cover for 0.34%. The forest-and-farmland summary lists forest at only 0.15%, which matches the visual impression of a county where cropland covers most of the interior.
What is the large wetland and water concentration in the northwest?
Big Lake National Wildlife Refuge provides the main verified local context for that part of Mississippi County. The U.S. Fish and Wildlife Service places the refuge west of Manila and describes its lake, swamp, and bottomland habitat. The land-cover colors are not the legal refuge boundary, but they clearly show a broad water-and-wetland landscape in the same part of the county.
Does the 4.55% class difference mean 4.55% of the county was physically converted by people?
No. It means the representative class differs between the 1985 and 2025 comparison for 4.55% of the mapped area. The change product does not record the cause. Development, agricultural shifts, water conditions, vegetation, and classification variation can all require additional evidence before a specific explanation is assigned.
What files are included in the Mississippi County download?
The ZIP contains four original JPG maps: 2025 general land cover, forest and farmland, impervious/developed land, and 1985–2025 land-cover change. They match the topics previewed in the article and can be opened separately for printing, lessons, presentations, or side-by-side county comparisons.
Sources and Reference Material
- MRLC Annual NLCD Data — official access to Annual NLCD land-cover and related products.
- USGS Annual NLCD Collection 1.2 Land Cover — describes the 2025 extension of the annual product series and its 30-meter raster data.
- University of Arkansas Extension: Mississippi County — county-specific agriculture and community information.
- U.S. Fish and Wildlife Service: Big Lake National Wildlife Refuge — official information about the refuge and its lake, swamp, and bottomland habitat in Mississippi County.
- Encyclopedia of Arkansas: Mississippi County — trusted county background on the Mississippi River boundary and agricultural economy.
- U.S. Census Bureau QuickFacts: Mississippi County — official county geography and population statistics.
Map File Information
The ZIP includes four original JPG maps for Mississippi County: 2025 land cover, forest and farmland, impervious/developed land, and 1985–2025 land-cover change.
- Included Files: land cover, forest/farmland, impervious/developed land, and land-cover change maps
- File Type: one ZIP containing four JPG files
Related Maps
- A Craighead County Arkansas Land Cover Map
- Arkansas County Arkansas Land Cover Map
- Ashley County Arkansas Land Cover Map
Green Map creates custom-edited map images using open geographic data sources such as geoBoundaries, Natural Earth, OpenStreetMap, and government open data.
These maps are edited visual materials, not raw data files, and are provided for education, documents, presentations, and graphic reference.