Graham County is easiest to understand as a broad landscape organized around a lower central corridor rather than as one evenly settled block of southeastern Arizona. Safford, Thatcher, and Pima cluster along the US 70 corridor, while Bylas and Fort Thomas continue that line farther west. This page includes four map views of the county, and the original high-resolution JPG versions are available together in a downloadable ZIP farther down the article, so you can browse the lighter WebP images first and save the larger files when you need them.
The maps answer different practical questions without pretending to provide the same information. The county map is best for roads, named places, and the boundary. The city view reduces the scene to Safford, Thatcher, and Pima and labels their straight-line spacing. The terrain-and-water map brings the Gila River, Black River, lakes, reservoirs, and creeks forward, while the elevation map shows how sharply the low central country differs from the high ground in the northeast and south-central part of the county.
Table of Contents
US 70 carries the main chain of communities through the county
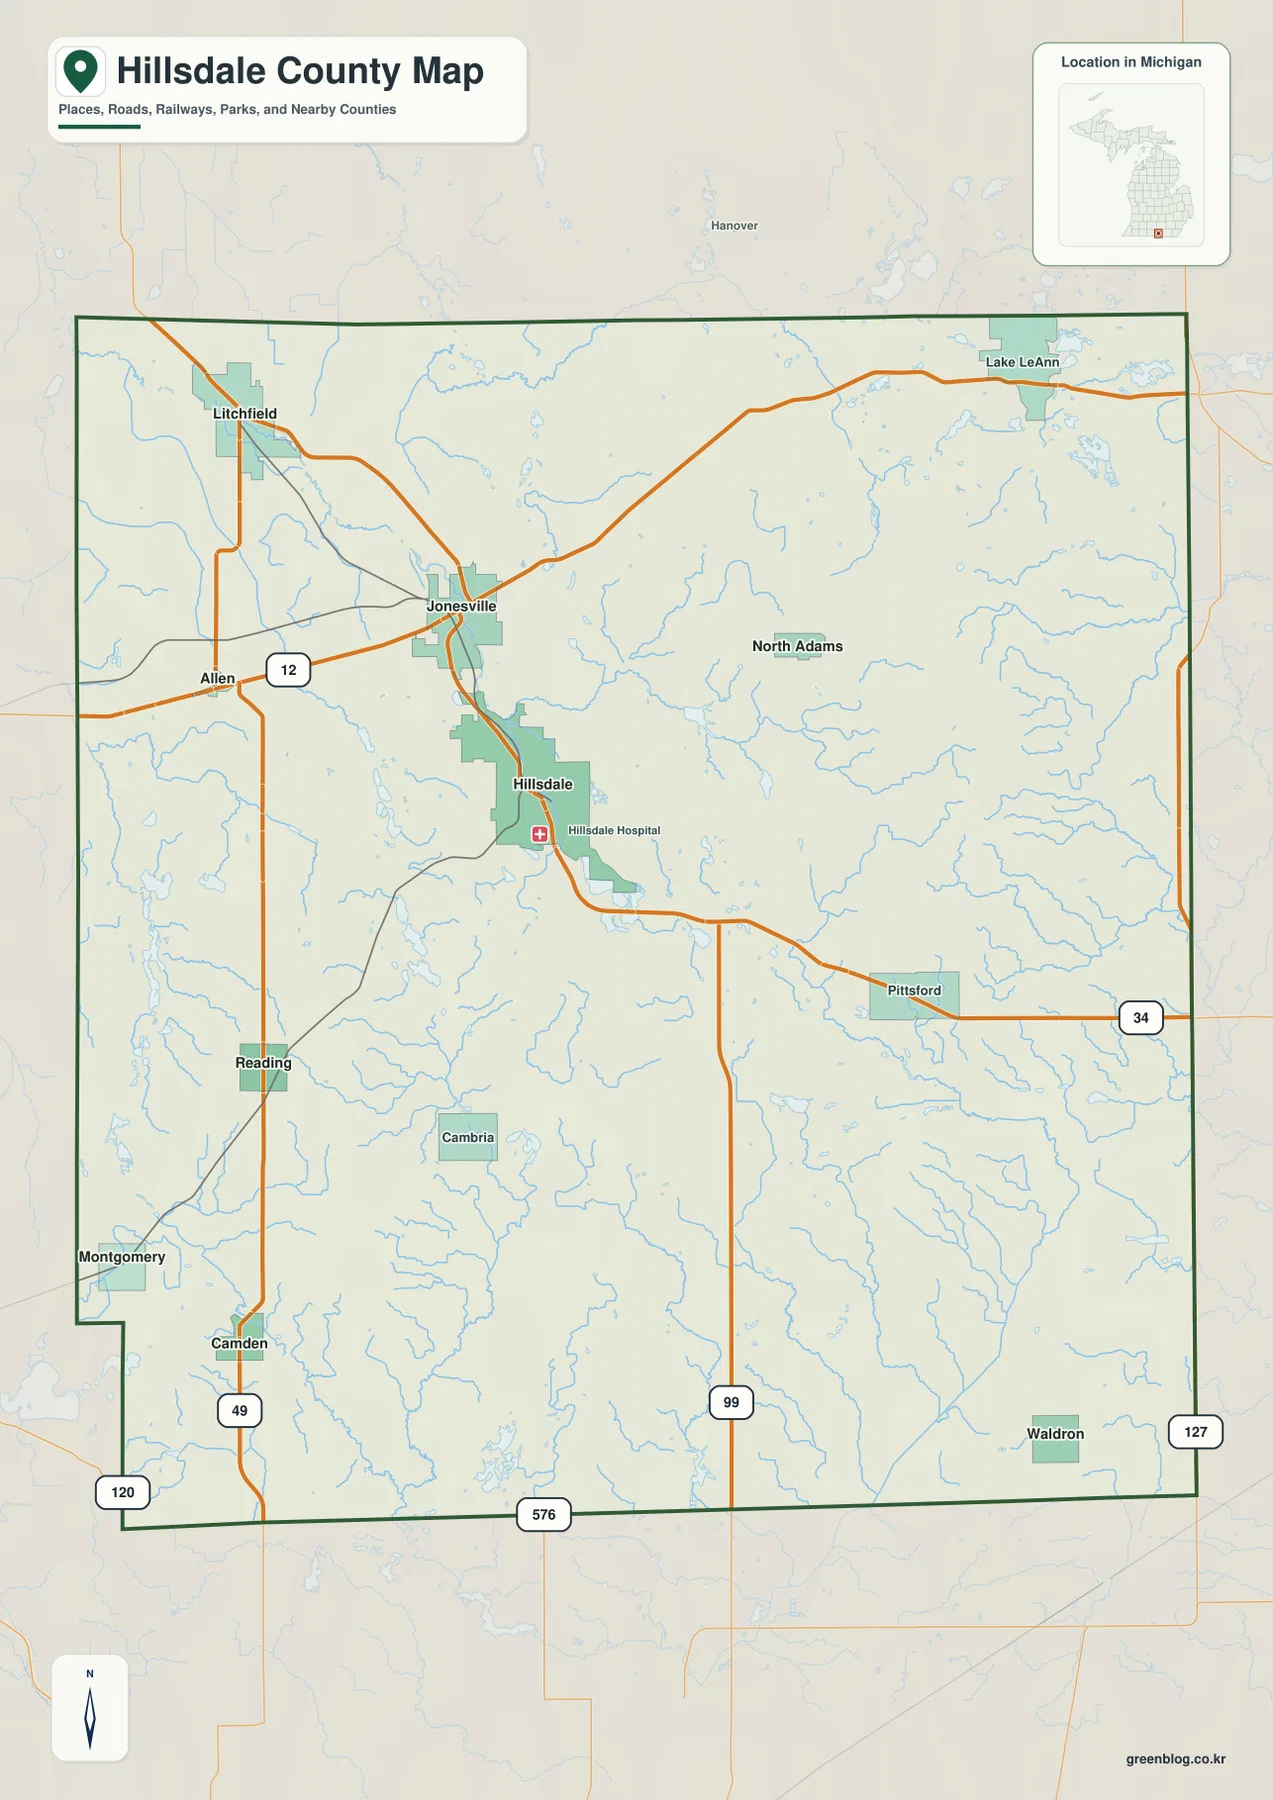
On the county map, the most continuous string of named places follows US 70 from the western side toward the Safford area. Peridot appears near the western edge as an outside reference, then Bylas, Fort Thomas, Bryce, Pima, and Thatcher form a clear sequence across the interior. Safford is the hub on the city-connections map and lies in the same central corridor, where road lines and place labels are much denser than they are across the broad northern half of the county.
US 191 adds the important north-south connection near the central settlements and continues southward out of the most populated part of the map. Routes 366 and 266 enter rougher country to the southwest, where their curves contrast with the simpler highway pattern around Thatcher and Safford. That difference matters because the road network is not spread evenly across the county. The named communities and major highways favor the lower corridor, while large mountain areas contain fewer settlement labels.
The shape of Graham County is also irregular enough that the boundary itself helps with orientation. The northern edge steps and bends, the eastern side descends for a long distance before angling toward the southeast, and the western side is broken by a narrow indentation. Clifton appears outside the county to the east, while San Carlos and Peridot help orient the western side and Willcox appears well to the south. Those outside labels are useful reference points, but the map is most informative when you follow the internal chain from Bylas through Pima and Thatcher toward Safford.
Safford, Thatcher, and Pima form a tight central group
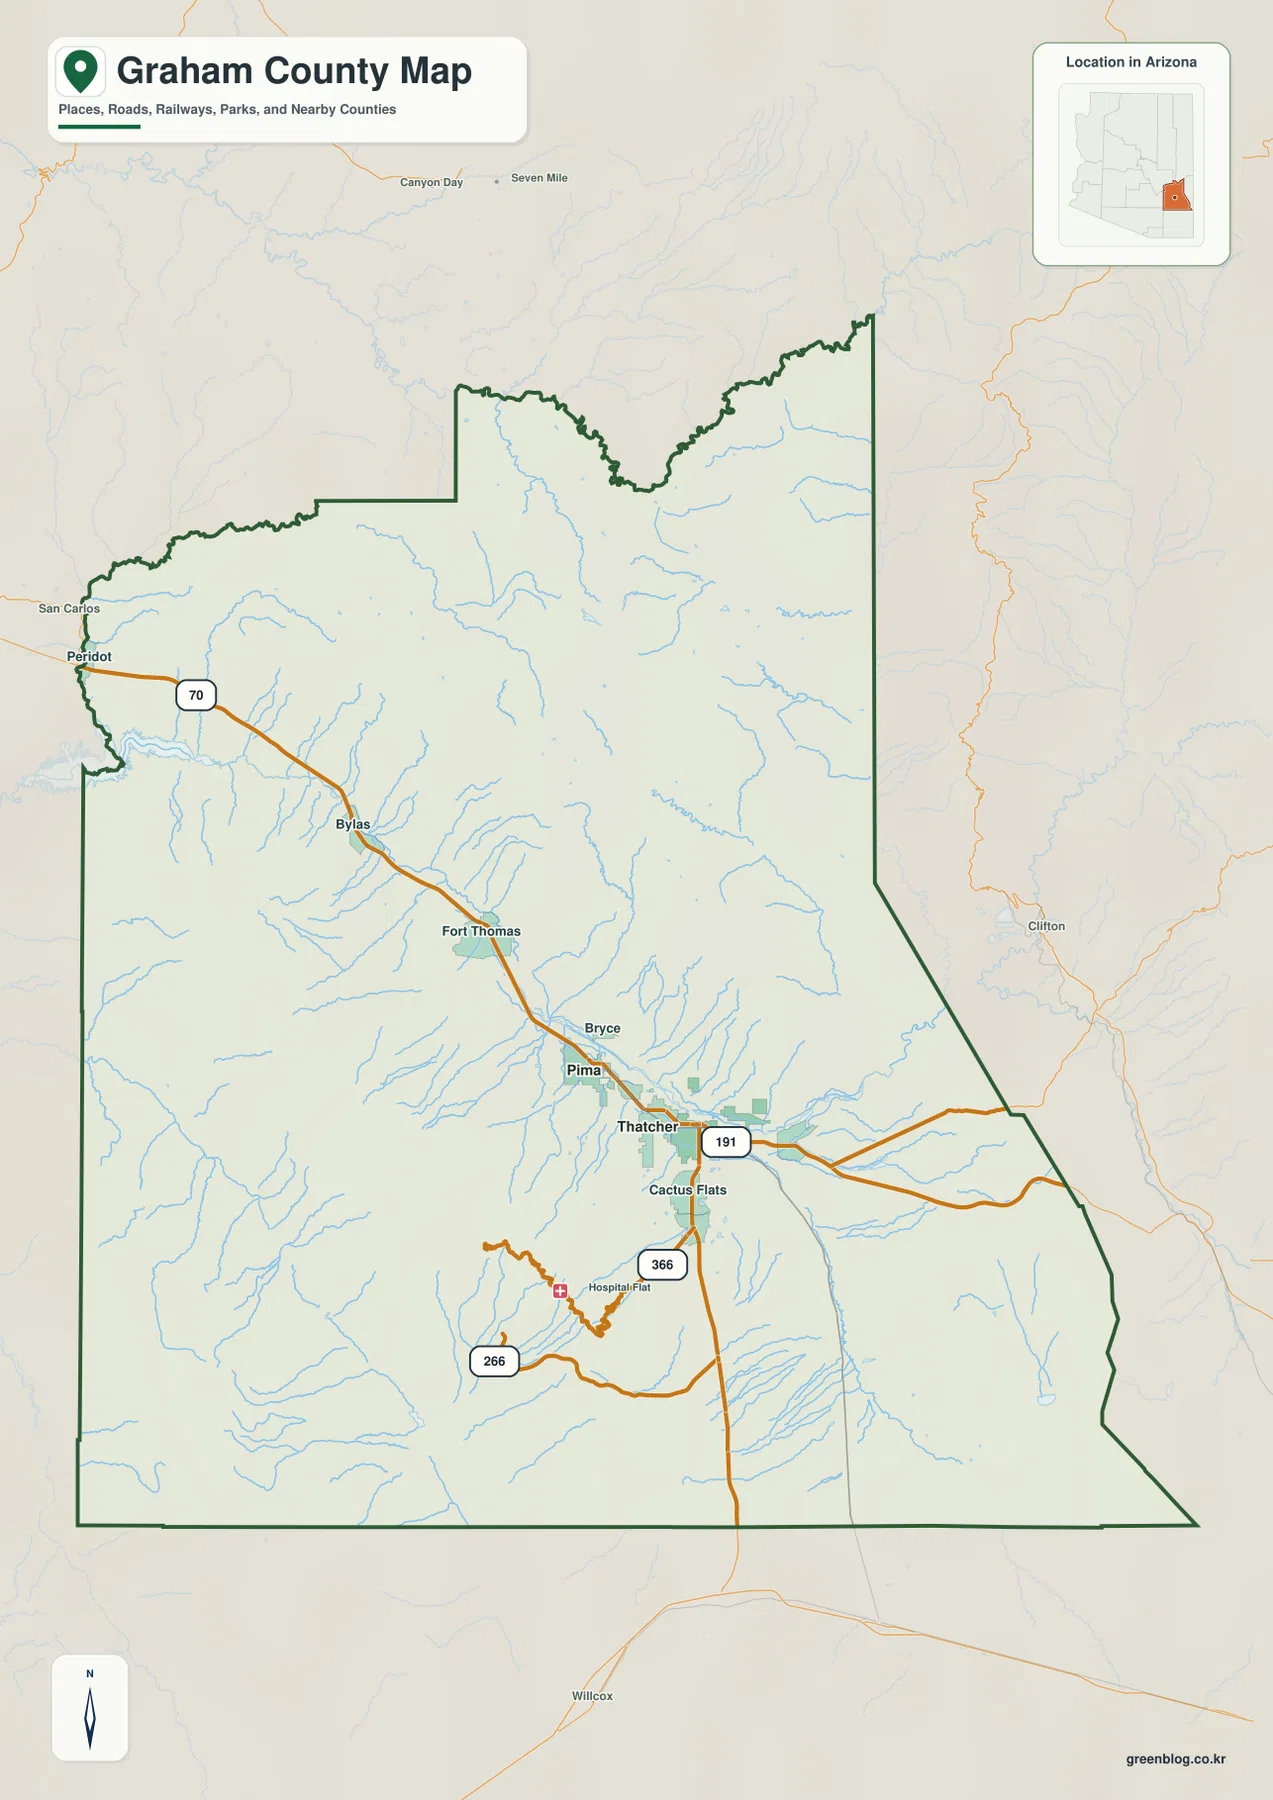
The city-connections graphic removes most small labels and makes one relationship much easier to see. Safford is marked as the hub, with Thatcher immediately to the west and Pima farther west along the same general corridor. The legend gives a straight-line distance of 7 miles from Safford to Thatcher and 11 miles from Safford to Pima. Those values are not driving distances, and they should not be used to estimate travel time.
As a spacing diagram, however, the map is useful. It shows that the three featured cities occupy a small part of a very large county. When the city view is compared with the road map, US 70 helps explain the east-west alignment and US 191 adds a strong connection near Safford and Thatcher. Much of the north and northeast has no comparable cluster of major city labels, so the central group stands out even more clearly.
The simpler map is best when a reader wants only the relative position of the principal city markers. If you need Bylas, Fort Thomas, Bryce, Cactus Flats, or the numbered mountain roads, return to the county map. Numbers printed beside the city names should not be treated here as a substitute for current official population statistics; the reliable information for this article is the mapped location and the labeled straight-line distance from the Safford hub.
The Gila River crosses the middle while lakes and creeks spread into the mountains
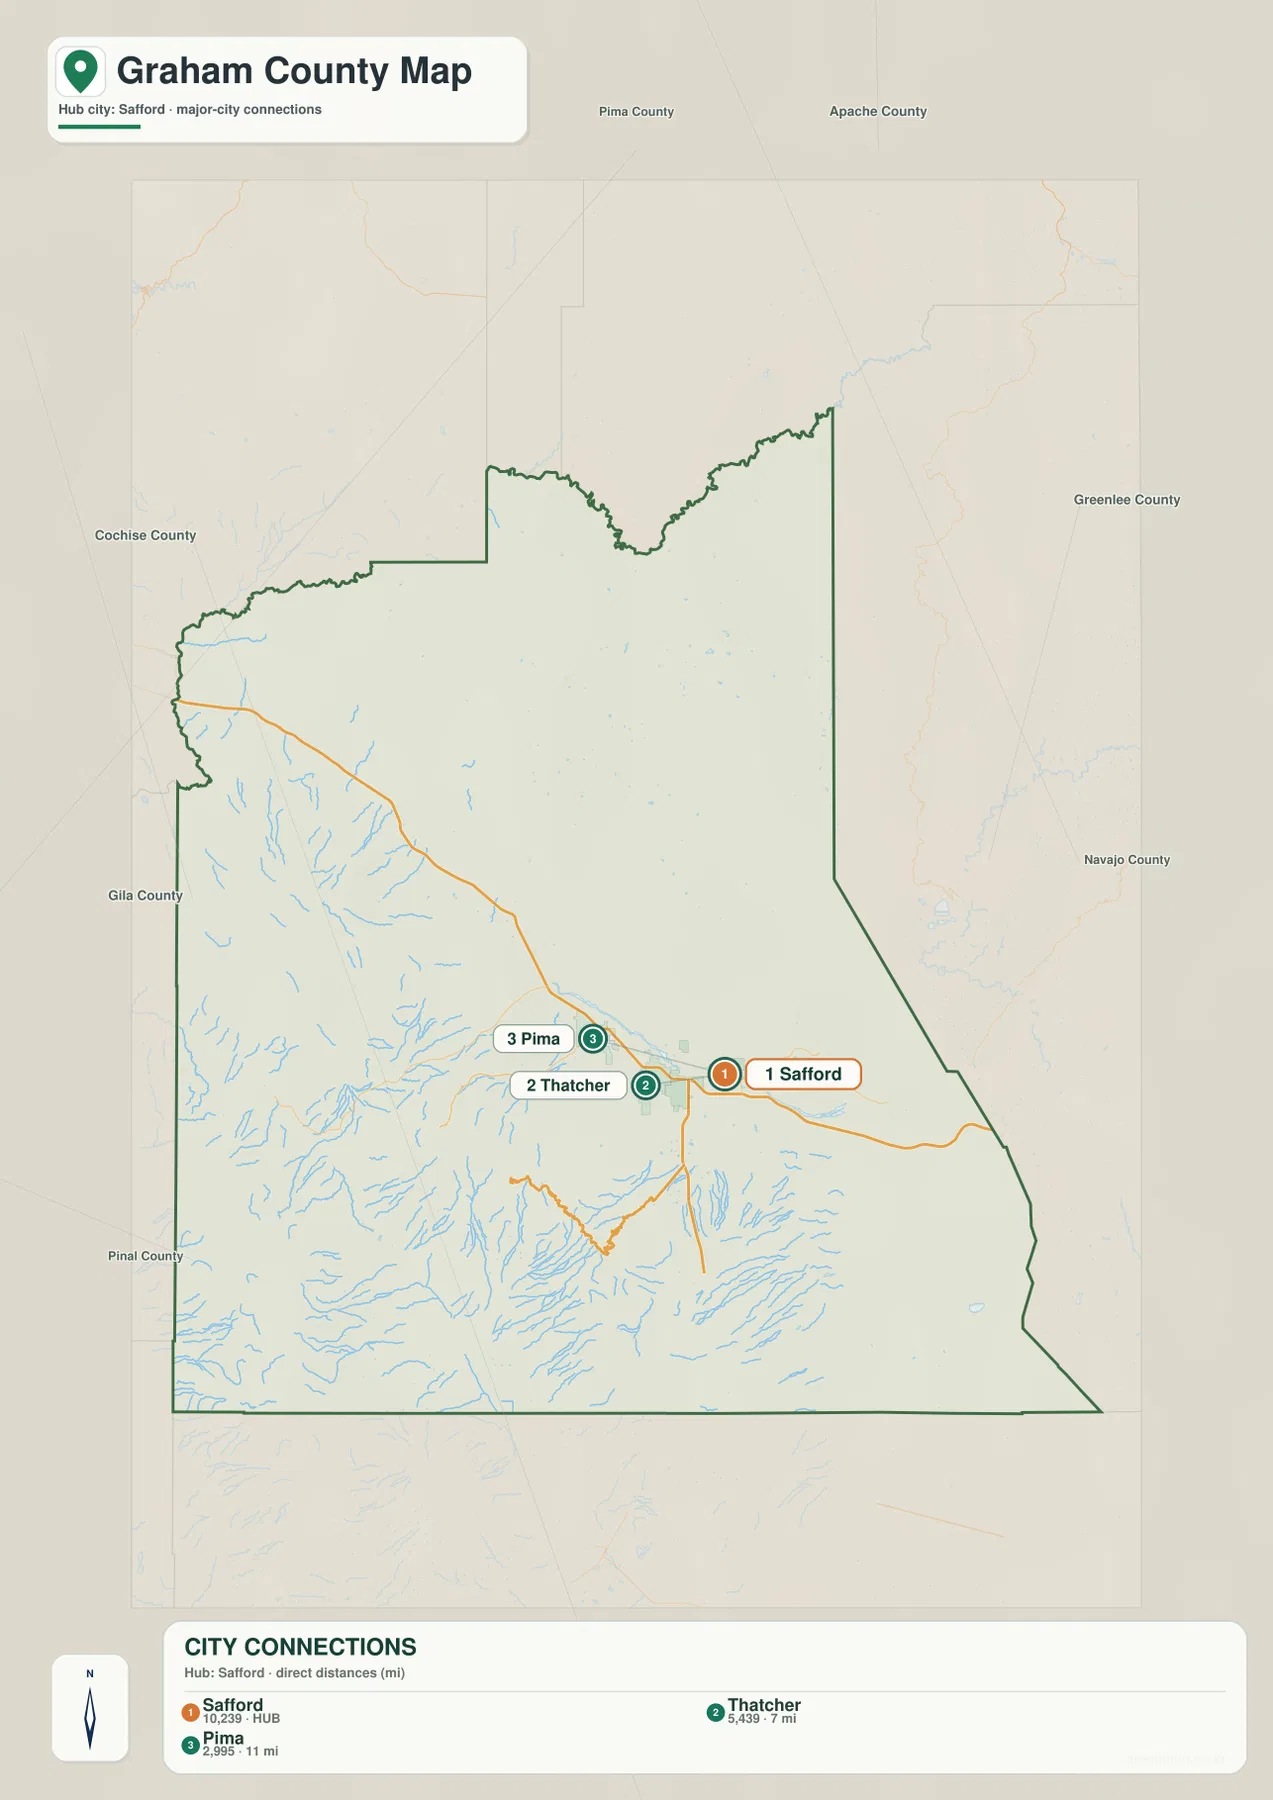
The terrain-and-water map changes the emphasis completely. The Gila River is the clearest named watercourse through the middle of the county, while the Black River appears farther north. South Fork Ash Creek lies between those larger rivers, and other labeled channels include Deer Creek on the west, Ash Creek in the south-central mountains, and High Creek farther south. Shaded relief behind the blue lines makes it clear that these waterways occupy valleys and cuts between ridges rather than crossing a flat surface.
Several named lakes and reservoirs are scattered across the county rather than concentrated in one large water body. Point of Pines Lake and Dry Lake appear close together in the north-central area. Rogers Reservoir and Allen Reservoir lie farther south, and Riggs Lake, Roper Lake, and Dankworth Lake form another group in the south-central portion. Parks Lake is separated from them near the southeastern side of the county.
Comparing this view with the road map helps connect water and settlement without claiming that every road follows a river. The Safford–Pima corridor is visually busy on the highway map, but the water map emphasizes the Gila River and the surrounding drainage. The northern area, where few city names appear, becomes more informative when the Black River and high terrain are shown. The south-central mountains also gain detail because the lakes, reservoirs, and Ash Creek are easier to identify there.
This is a reference map for the location of rivers, streams, lakes, and terrain. A blue line does not guarantee permanent flow, and the map does not provide flood zones, current water levels, drinking-water status, or navigational information. Those questions require separate official hydrology or hazard products. Here, the useful information is the relative position of the named water features and the landforms around them.
A lower central corridor sits between much higher terrain
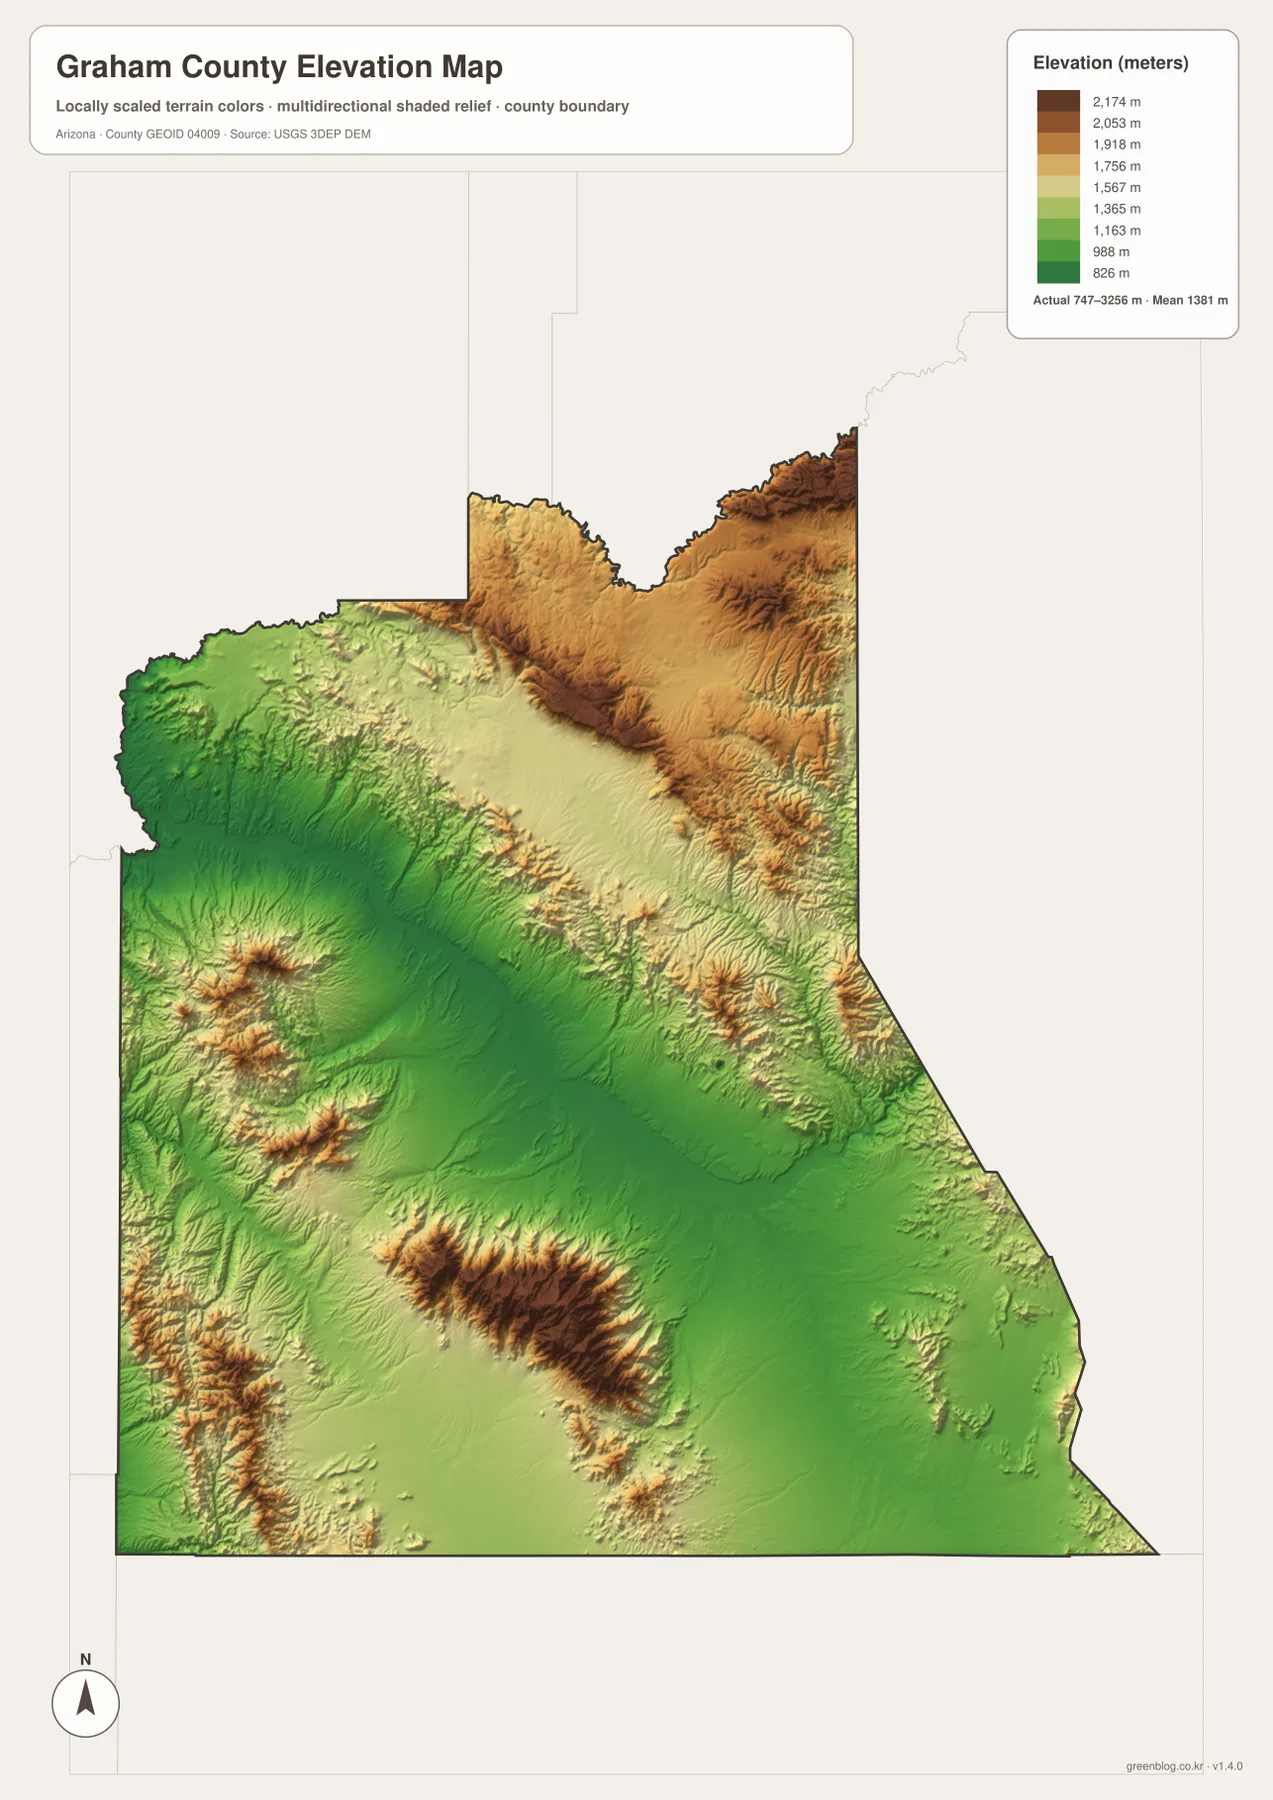
The elevation map provides the broadest explanation for the county’s physical contrast. Its note reports an actual county range of about 747 to 3,256 meters, with a mean near 1,381 meters. Large green areas across the central and western interior represent relatively low ground, while darker brown terrain rises sharply in the northeast and in a long south-central mountain block. The county therefore contains a much larger vertical range than the settlement map alone suggests.
The northeast stands out as a broad high area that reaches the county boundary, while the south-central mountain mass rises abruptly above the surrounding lower country. Between them, a lower corridor extends across much of the interior. When you compare that pattern with US 70 and the chain of communities, the concentration of roads and towns in the lower country becomes easier to understand without assuming that elevation alone determines settlement.
The colors are meant for county-scale comparison, not precise site measurement. The map is useful for deciding whether one part of Graham County is generally higher or lower than another, but it is not a survey or engineering surface. Exact elevations for parcels, structures, road grades, construction sites, or design work should come from the original elevation dataset or professional field measurements.
Choose the map that matches the question
If you are looking for named communities and road numbers, start with the county map. It is the quickest way to trace Bylas, Fort Thomas, Pima, Thatcher, and the Safford area along US 70 and to see how US 191, Route 366, and Route 266 fit around the central corridor. For a cleaner city-to-city comparison, use the Safford connections graphic, keeping in mind that its 7-mile and 11-mile labels are straight-line distances.
For the Gila River, Black River, named lakes, reservoirs, and creeks, the terrain-and-water map contains the most useful labels. The elevation image works best as a companion because it shows why the water map contains so many ridges and valleys and why the road map is concentrated in lower ground. Moving between the maps is more informative than trying to force every feature into a single image.
The WebP images on this page are optimized for browsing. When you need larger copies for printing, classroom work, presentations, reports, or personal reference, use the download box below. It contains the original high-resolution JPG versions of the same four Graham County map views described in the article.
Frequently Asked Questions
Are the 7-mile and 11-mile city labels driving distances?
No. The city-connections map uses straight-line distance from the Safford hub. Thatcher is labeled 7 miles away and Pima 11 miles away on that basis. Actual road distance and travel time may be longer, so use a routing service when you need driving information.
Which map is best for the Gila River and the named lakes?
Use the terrain-and-water map. It labels the Gila River and Black River along with Point of Pines Lake, Dry Lake, Rogers Reservoir, Allen Reservoir, Riggs Lake, Roper Lake, Dankworth Lake, Parks Lake, and several named creeks. The relief underneath helps place those water features among the surrounding ridges and valleys.
Can the elevation map be used for surveying or engineering?
No. It is a county-scale reference for broad differences in height. Although the map notes an overall range of about 747 to 3,256 meters, exact site elevations, road grades, construction measurements, and engineering values should come from the source elevation data or a professional survey.
Map File Information
The download ZIP contains the original high-resolution JPG files for the Graham County boundary-and-roads map, city-connections map, terrain-and-water map, and elevation map described on this page.
- Included Versions: county boundary and roads, city connections, terrain and water, elevation
- File Type: JPG
Related Maps
Sources and References
For county government information, see the official Graham County website. Boundary and road reference data are available through the U.S. Census Bureau TIGER/Line Shapefiles. Water features can be checked against USGS National Hydrography, and elevation data are documented by the USGS 3D Elevation Program. The specific place names, road labels, water features, and elevation observations discussed above are based primarily on the Graham County maps supplied in this rewrite package.
Green Map creates custom-edited map images using open geographic data sources such as geoBoundaries, Natural Earth, OpenStreetMap, and government open data. These maps are edited visual materials, not raw data files, and are provided for education, documents, presentations, and graphic reference.