Miller County has a land-cover pattern that changes sharply from one part of the county to another. Agriculture is the largest 2025 class at 40.53%, spreading broadly across the north and east, while forest and wetlands form a more mixed interior and southern landscape. Along the western state line, the developed footprint of Texarkana stands out as the county’s strongest concentration of built land.
The four maps on this page separate those patterns into a general land-cover view, a forest-and-farmland view, an impervious/developed-land view, and a 1985–2025 class-difference view. WebP previews are shown in the article, and the four original JPG maps are available together in one ZIP download below. Using the set together makes it easier to compare rural cover, wet areas, the Texarkana urban edge, and where classifications differ between the two mapped years.
Table of Contents
Miller County Is Not One Continuous Farm Landscape Despite Agriculture Leading at 40.53%
The 2025 general map gives agriculture the largest share, but its placement matters as much as the percentage. Large yellow agricultural areas occupy much of the north and east. The center becomes more mixed, with forest, wetlands, agriculture, and smaller developed patches interlocking over short distances. Farther south, green forest and teal wetland cover become more prominent. This change across the county keeps the 40.53% agriculture figure from describing every locality equally.
The county summary lists forest at 26.53%, wetlands at 16.39%, developed cover at 8.03%, and shrubland at 3.01%. Water is listed at 1.85% on the forest-and-farmland map. Forest and agriculture together account for most of the mapped surface, yet the wetland share is substantial enough to shape large parts of the interior. Developed land is much smaller in county-wide percentage, but its concentration on the west side gives it a visual importance that a simple ranking would not convey.
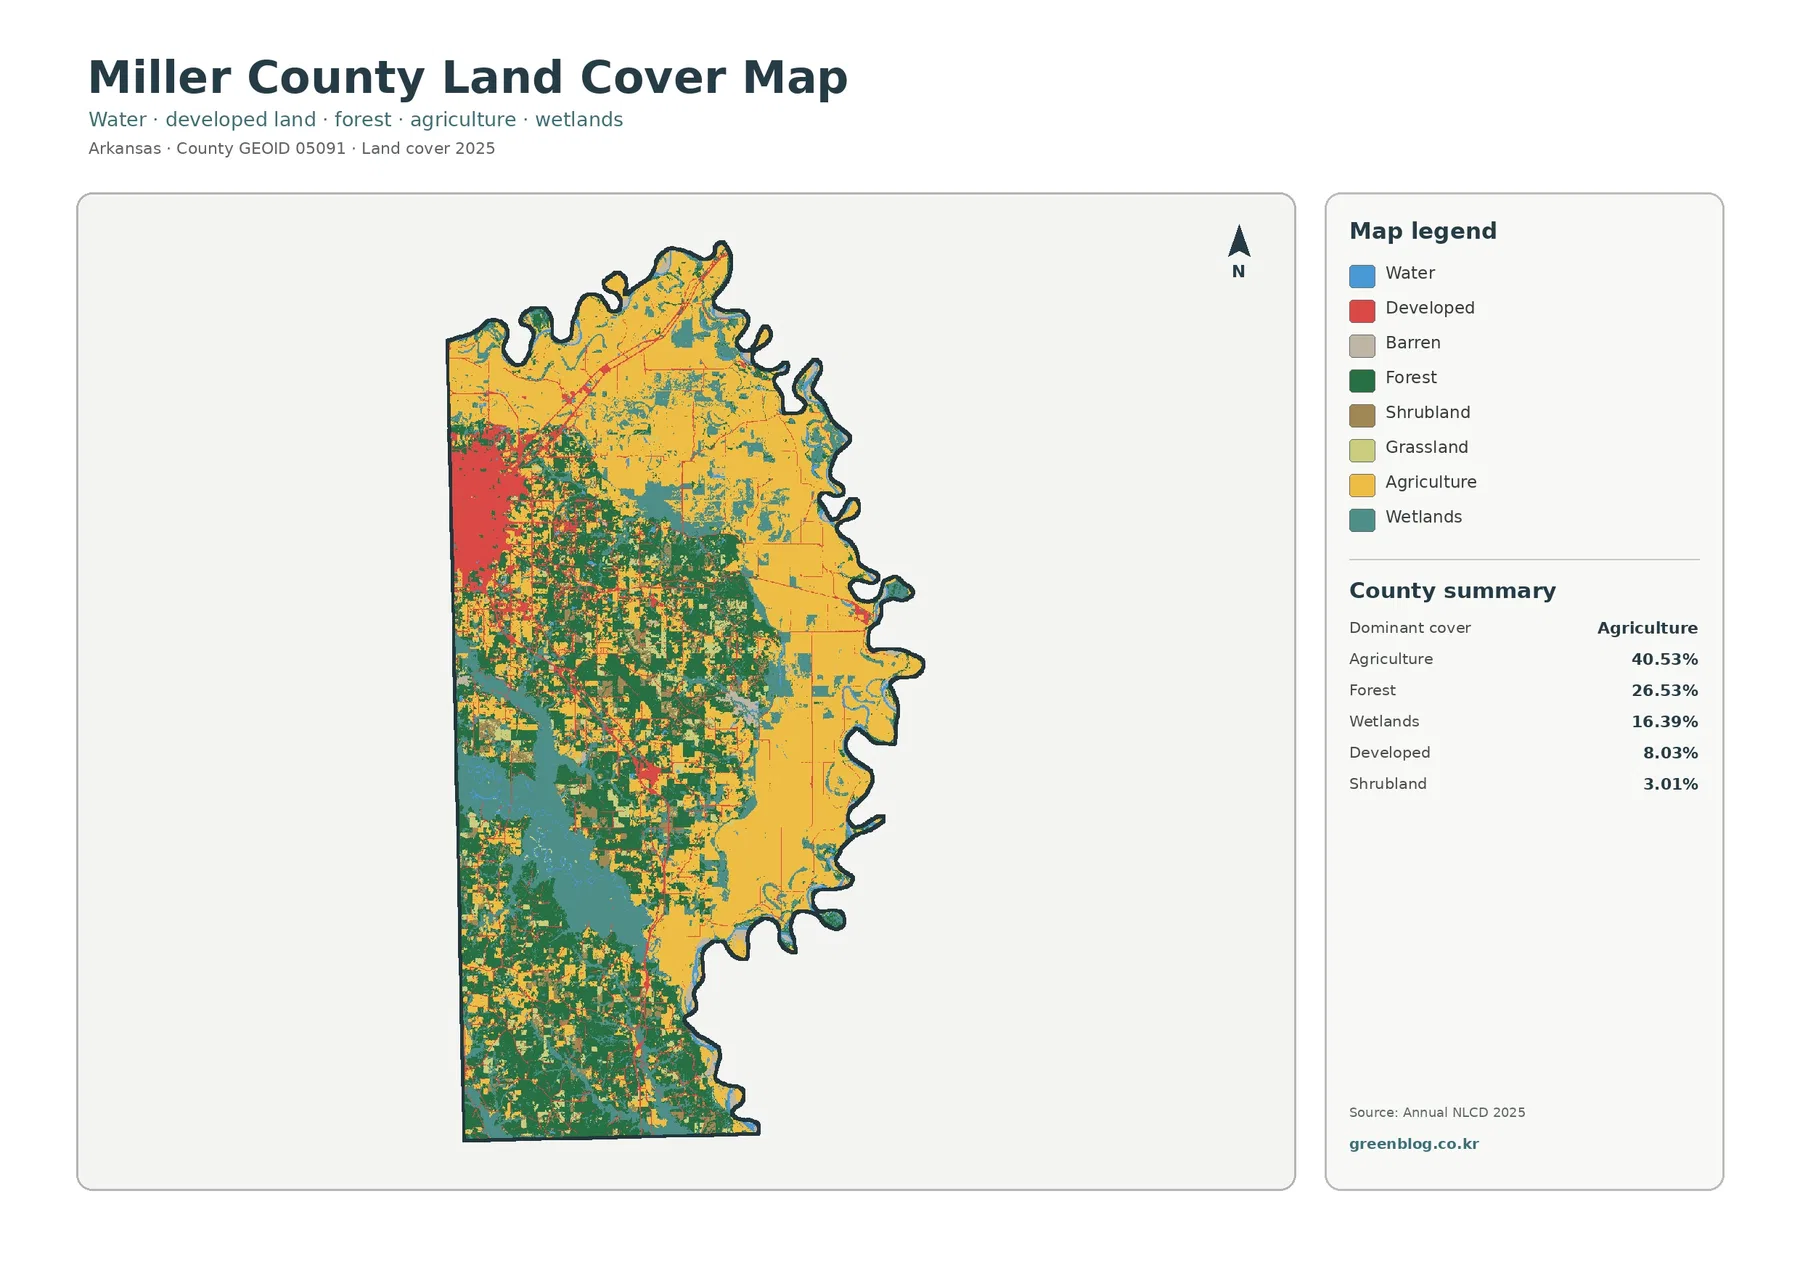
The largest red developed block sits against the western border and corresponds to the Arkansas side of Texarkana. The Encyclopedia of Arkansas identifies Texarkana as the Miller County seat and places it at Arkansas’s southwest corner beside Texarkana, Texas. That local setting explains why the county’s most concentrated built footprint appears directly along the state line. The map does not draw municipal boundaries, however, so the red footprint should not be treated as the legal outline of the city.
A trusted county reference also describes Miller County as a landscape of flat plains and gentle hills with both pine and hardwood forest, and it notes the meandering Red River along the northern and eastern border. Those facts provide useful geographic context for the map’s broad farm areas, wooded interior, and winding eastern edge. They do not establish the cause of each land-cover patch. A wetland cell, for example, cannot be assigned to a particular river process simply because it lies near the river corridor.
Texarkana Becomes Even More Distinct When the Map Is Reduced to Hard Surfaces
Impervious surface means pavement, rooftops, parking areas, and other hard materials that allow little direct infiltration of rainfall. Miller County’s mean impervious value is 2.05%, and cells with at least 50% impervious cover account for 1.18% of the county. Those numbers are low at county scale because farmland, forest, and wetlands occupy such large areas. The western urban cluster is still unmistakable, with dense orange and red pixels packed into a relatively small portion of the county.
The impervious map separates the urban pattern more clearly than the general 8.03% developed-cover figure. A developed land-cover class may include houses, lawns, scattered trees, streets, and other mixed surfaces in the same 30-meter cell. The impervious layer instead measures how much of a cell is occupied by hard surfaces. That is why some developed areas look pale while the most built-up portions of Texarkana appear much darker.
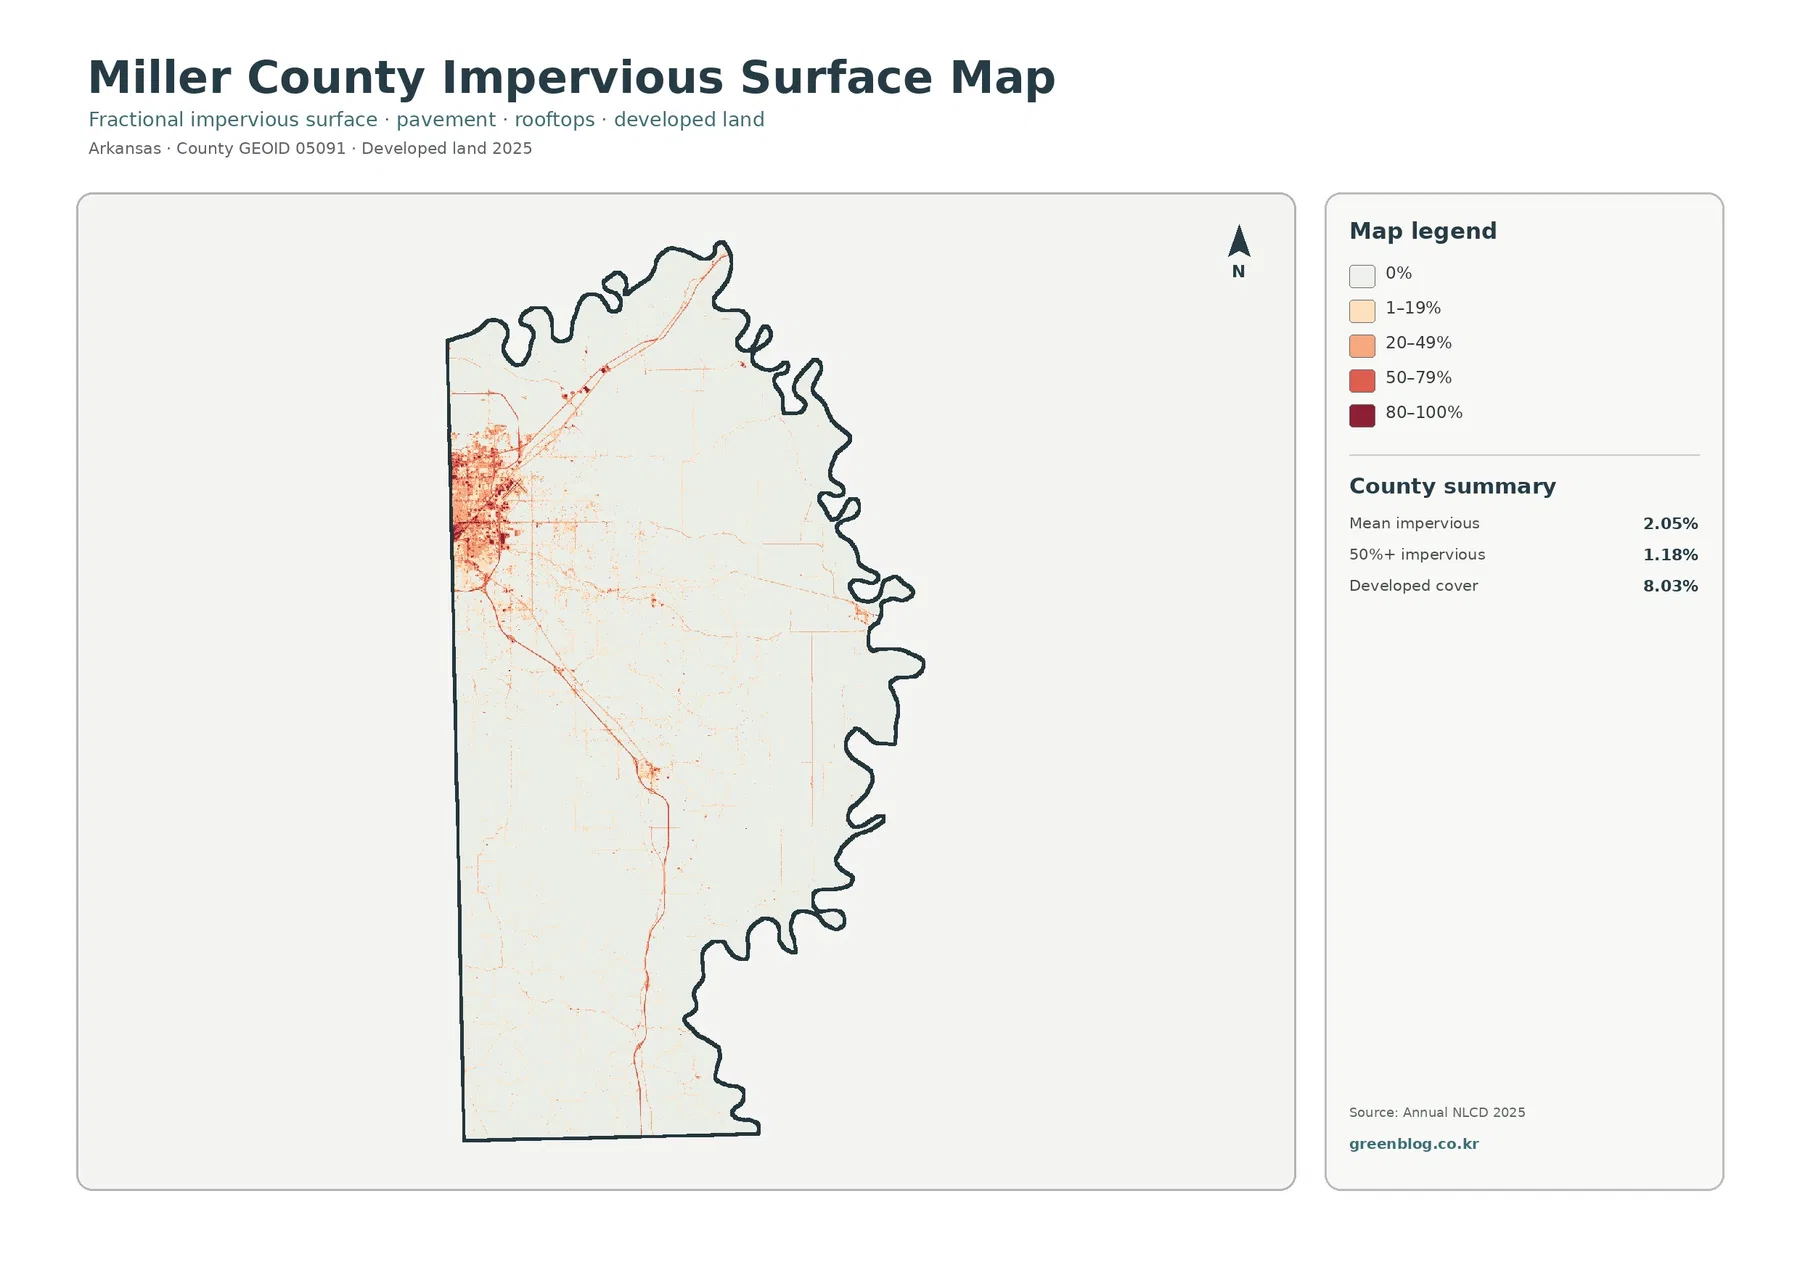
Outside the main western cluster, narrow lines and small orange-red patches extend through otherwise pale rural space. Some of those shapes resemble transportation and settlement corridors, but the image does not label route numbers or road classes. It is appropriate to say that hard surfaces follow a few linear paths; it would be an unsupported step to identify a specific highway from color alone or claim that the road caused nearby development.
This layer is useful when a project needs the difference between a broad developed class and a more concentrated built-surface signal. A county presentation could show the general map first, then use the impervious layer to explain why Texarkana dominates the developed footprint while much of the rest of Miller County remains lightly impervious. It is not suitable for locating individual buildings, measuring parking lots, or determining drainage requirements for a parcel.
Forest and Wetland Patches Break Up the Farm Belt Through the Interior and South
The forest-and-farmland map simplifies the palette enough to show where the agricultural dominance weakens. Cropland and pasture colors are extensive across the north and east, while forest becomes more continuous through the center and toward the southern end. The boundary between these surfaces is irregular rather than a single clean line. Forest patches sit inside agricultural areas, and open agricultural patches interrupt larger wooded blocks.
Wetlands account for 16.39%, making them the third-largest major class in the supplied summary. Teal areas are broad in parts of the west-central interior and remain visible toward the south and along sections of the winding eastern edge. Water covers 1.85%, while grassland is 2.54% and shrubland is 3.01%. The smaller percentages should not be mistaken for absence: narrow water features and scattered open patches can be geographically meaningful even when they occupy little county-wide area.
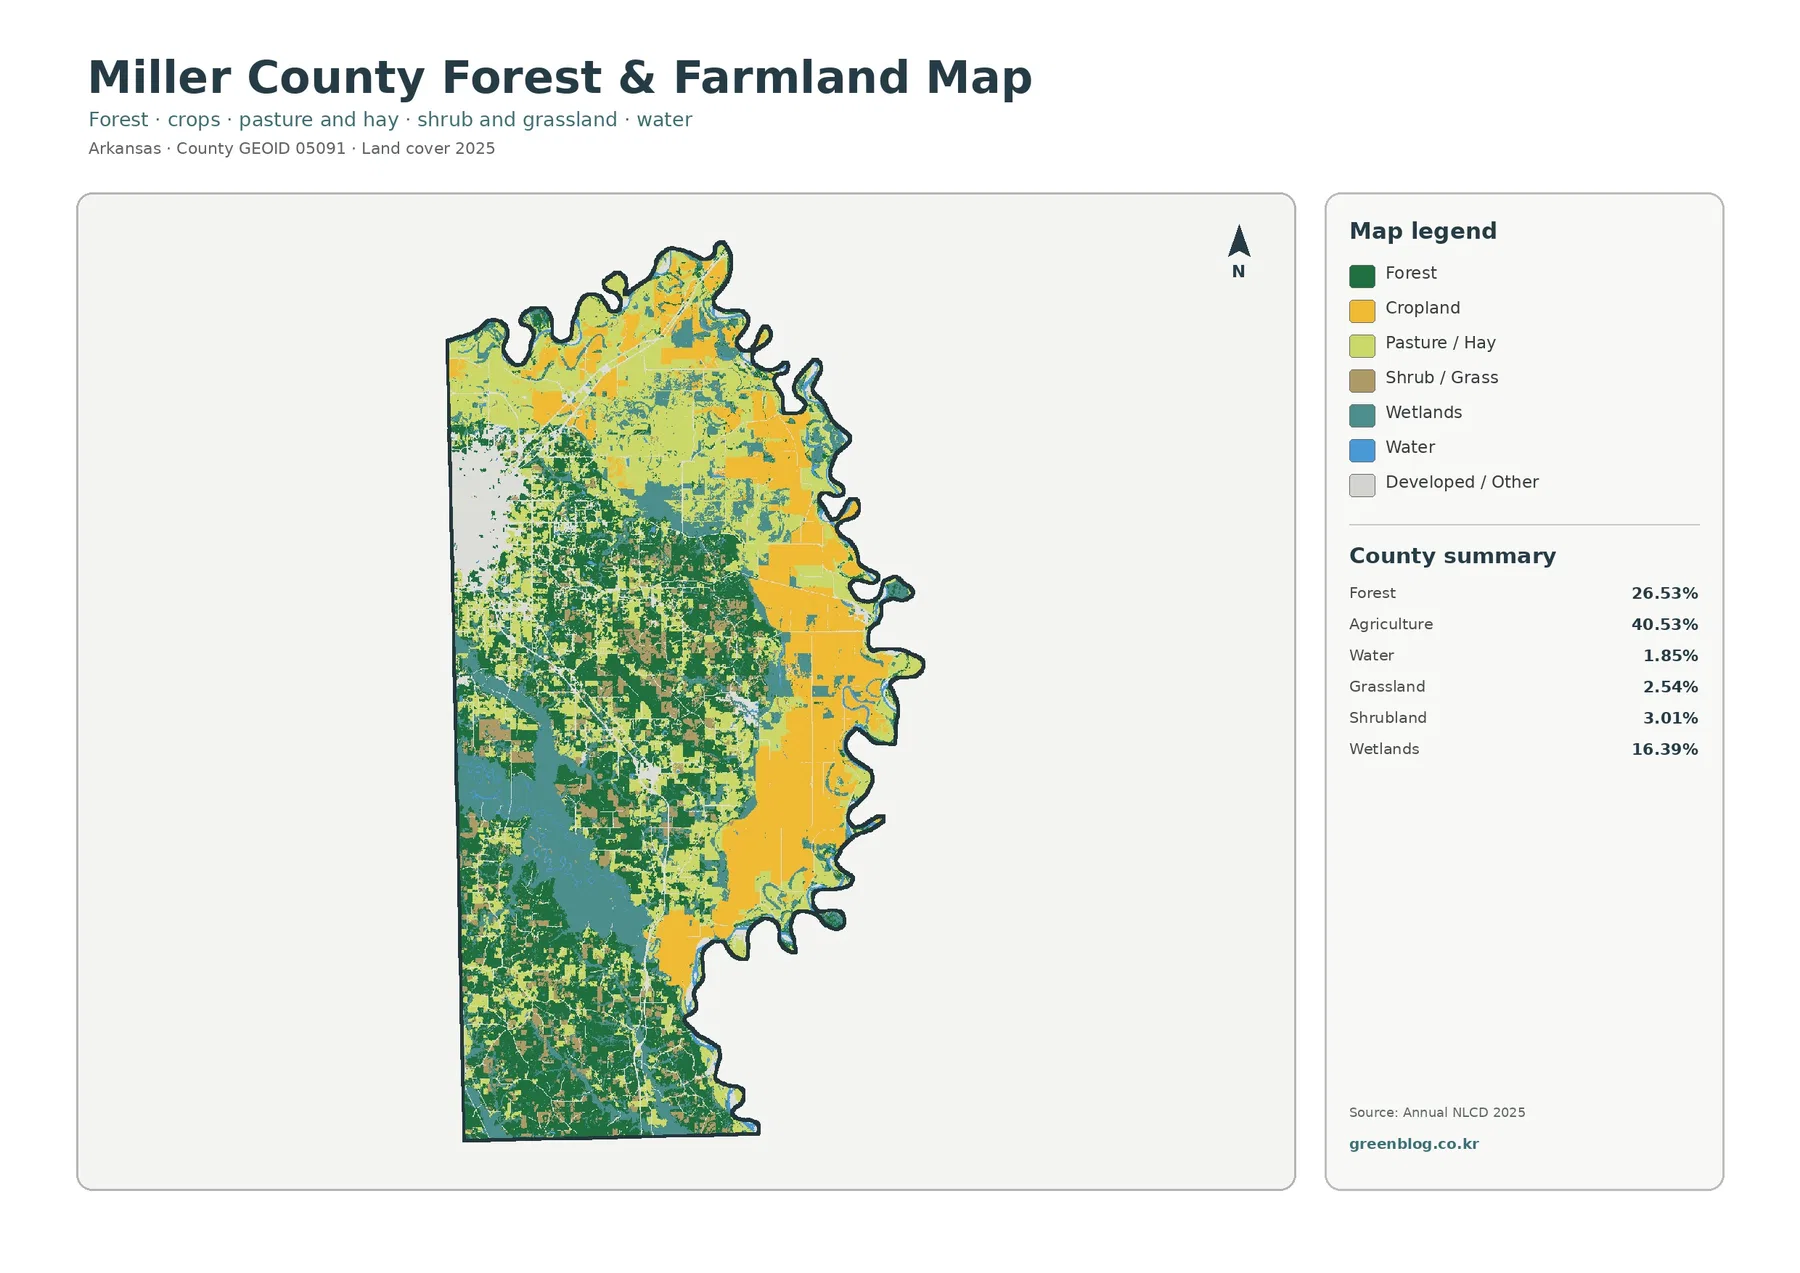
The University of Arkansas System Division of Agriculture maintains a Miller County Extension office in Texarkana and offers local programs in agriculture and natural resources. Its county materials include row crops, beef and forage production, horticulture, and related services. That local agricultural role is useful background for a map where agriculture is the largest cover category. The land-cover image itself does not identify crop species, field ownership, irrigation, or farm management, so those details should not be inferred from yellow pixels.
Forest also needs a careful reading. A green cell indicates a forest class at the mapping scale, not a particular tree species, stand age, ownership category, or timber-management plan. The Encyclopedia of Arkansas notes both pine and hardwood forest in Miller County, but the supplied map does not separate those forest types. For most readers, the best use of this layer is to compare where wooded cover is broad, where agriculture opens the landscape, and where wetlands occupy the spaces between them.
The Red River Border Adds Context to the Winding East Edge, but the Wetland Map Does Not Explain Hydrology
Miller County’s eastern outline is strongly sinuous, and the trusted state encyclopedia identifies the Red River along the northern and eastern county border. On the land-cover maps, agricultural fields, wetland cells, forest, and water all appear near that irregular edge. The geographic reference helps a reader understand why the county outline is not straight and why water-related cover is worth examining there.
The 16.39% wetland share should still be interpreted as a land-cover classification rather than a flood-risk map or regulatory wetland determination. A wetland color says that the surface was classified in a wetland category in the supplied dataset. It does not state how often the location floods, whether a permit is required, how deep the water becomes, or whether a site meets a legal wetland boundary used for a specific regulatory decision.
Water and wetlands are also different categories. The 1.85% water value describes open-water cells, while wetland classes can contain vegetation and seasonally saturated ground. On the map, open water often appears as narrow blue lines or small patches, whereas teal wetlands can occupy broader areas. For watershed teaching or regional comparison, reading the two together gives a fuller picture than considering open water alone.
The 30.57% 1985–2025 Class-Difference Total Needs More Caution Than a Simple “Changed Land” Label
The comparison map marks cells whose representative class differs between 1985 and 2025. Its county summary reports a total class difference of 30.57%. Within that total, 2.53% is classified as a transition to developed cover, 7.51% falls in the forest-loss category, 3.07% in agricultural loss, and 16.00% in other class differences. Wetland differences are mapped as a separate color even though the summary panel does not print a percentage for that category.
Red developed-change pixels are concentrated heavily near the western Texarkana area and also appear along smaller lines elsewhere. Orange forest-loss pixels and purple other differences are distributed much more widely through the center and south, with additional patches in northern and eastern agricultural areas. The pattern is therefore not a single urban-expansion story. Several classes contribute to the county-wide difference, and the “other difference” category is the largest printed component.
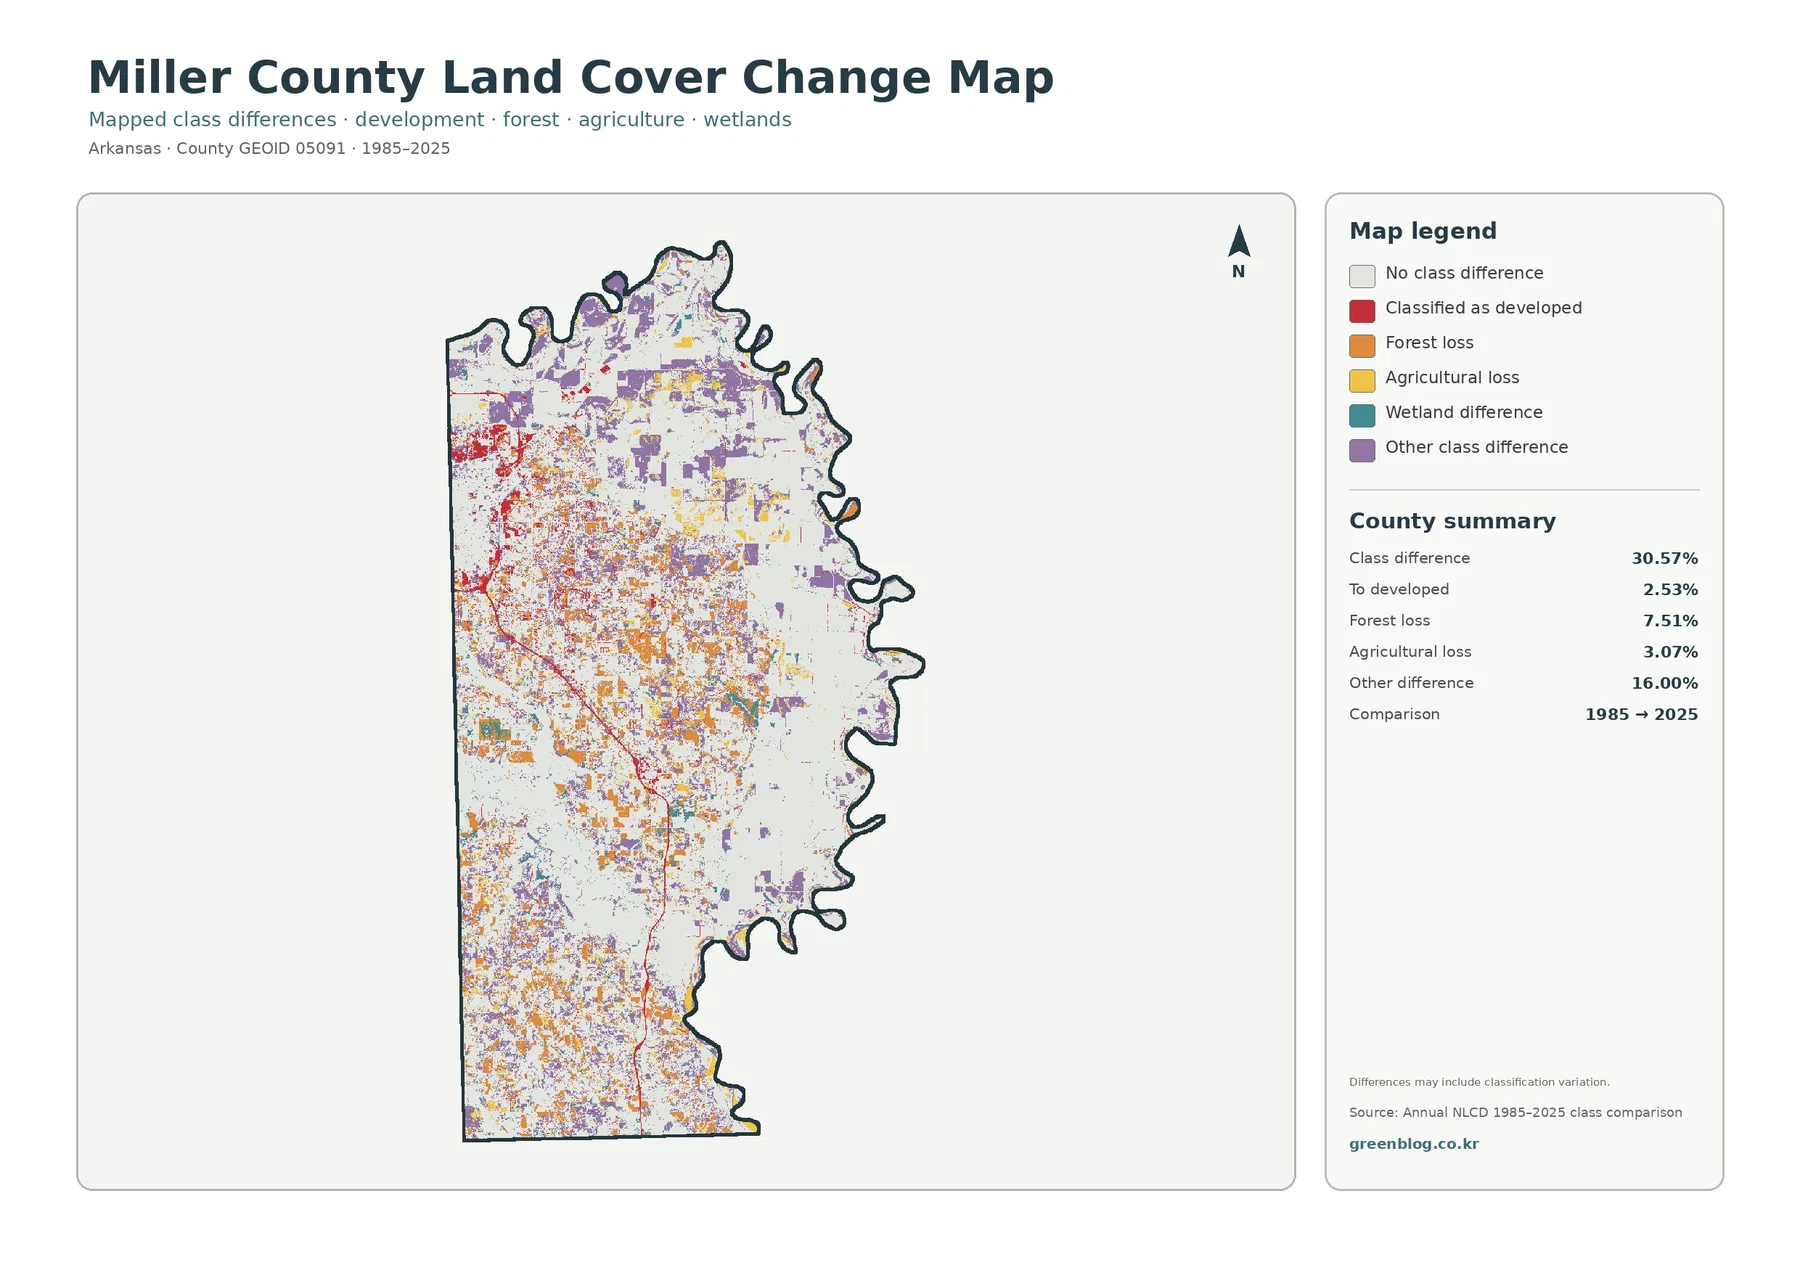
A 7.51% forest-loss category does not prove that 7.51% of Miller County was logged. It means cells mapped as forest at the earlier date were assigned another class at the later date. The underlying reason could involve harvest, development, agricultural conversion, vegetation change, or classification variation. Likewise, the 3.07% agricultural-loss category does not identify whether fields were abandoned, developed, wooded, or simply classified differently without checking the destination class and additional evidence.
The map itself warns that differences may include classification variation. That is especially relevant in mixed rural cells, narrow forest strips, wetland edges, small roads, and places where several surfaces fit inside a 30-meter grid cell. The 30.57% figure is best treated as the share of cells with a different representative classification between the two mapped years, not as proof that exactly 30.57% of the county underwent a complete physical conversion.
A Useful Reading Sequence Starts With Current Cover and Ends With the Time Comparison
Start with the general map when the question is simply what covers Miller County today. It immediately establishes the farm-heavy north and east, the wooded and wet interior, and the strong developed cluster on the west side. Move to the forest-and-farmland map when the goal is to distinguish open agricultural areas from broad woodland and to keep wetlands visible in the same comparison.
The impervious layer works best after that broad geography is understood. It isolates the hardest built surfaces and makes the Texarkana concentration easy to compare with thin rural development. The change map comes last because its colors do not describe the 2025 surface directly; they describe differences between two classifications. Having the current maps beside it helps prevent a small change patch from being mistaken for the dominant present-day cover.
A classroom exercise can ask students to identify the dominant class, then locate where that class is less dominant. A regional-planning presentation can contrast the western built concentration with the much broader rural landscape without implying zoning. A watershed discussion can compare wetlands and open water with surrounding farms and forest. A historical land-cover project can use the 1985–2025 view to choose locations for deeper investigation with aerial imagery or local records.
Download the Four Original Miller County JPG Maps in One ZIP
The download contains four separate JPG files: the 2025 general land-cover map, forest and farmland map, impervious/developed-land map, and the 1985–2025 land-cover change map. The supplied asset manifest lists each original JPG at 2480×1754 pixels. The WebP previews used in the article are 1800×1273 pixels. The manifest does not mark the original JPGs as meeting its A3 high-resolution reference, so the files are described at their supplied dimensions rather than as upscaled images or guaranteed A3 print masters.
When the maps are used side by side, keep each legend with its image. Red on the general map identifies developed land, while the impervious map uses a graduated red scale for the fraction of hard surface. The change map uses red for a transition to developed classification and other colors for different types of class differences. Treating those legends as interchangeable would create incorrect conclusions even though the maps cover the same county.
Thirty-Meter Raster Cells Are Designed for County Patterns, Not Parcel Surveys
USGS documents Annual NLCD as a Landsat-based raster product with 30-meter spatial resolution. A raster divides the landscape into grid cells, and each cell receives a representative land-cover class or, for an impervious product, a fractional value. One real-world cell can contain trees, grass, a driveway, part of a building, and a ditch at the same time. The map necessarily simplifies that mixture.
That simplification matters in Miller County because farm edges, wooded patches, wetlands, narrow water features, and rural development repeatedly meet within short distances. Straight field edges can look stair-stepped, small wooded strips may merge into nearby classes, and the edge of Texarkana can contain developed cells with relatively low impervious percentages because vegetation and buildings share the same grid. These are normal effects of mapping at county scale.
Land cover is also different from land use in the legal sense. A cell mapped as agriculture is not proof of agricultural zoning. A forest cell does not identify ownership, a conservation easement, or a timber-management status. Developed cover does not show permits or future development rights. Parcel boundaries, zoning, flood regulations, and wetland jurisdiction require the appropriate current government records.
The current maps are labeled 2025, while the comparison map uses 1985 and 2025. Construction, harvest, vegetation recovery, farming changes, or water conditions after the observation period may not appear. If a small location matters for a present-day decision, use the county maps as a regional starting point and then check recent aerial imagery, field conditions, and authoritative local records.
Frequently Asked Questions
What is the largest 2025 land-cover class in Miller County?
Agriculture is the largest class at 40.53%. Forest accounts for 26.53%, wetlands for 16.39%, developed cover for 8.03%, and shrubland for 3.01% in the general map summary. Agricultural cover is especially broad in the north and east, while forest and wetlands become more prominent through the interior and south.
Why is the western developed cluster so much stronger than the rest of the county?
The large western cluster corresponds to Texarkana, the Miller County seat on the Arkansas–Texas state line. The impervious map also places the county’s strongest concentrations of pavement and rooftops in that same area. The mapped red footprint is a land-cover pattern, not the legal city boundary, and it cannot be used to estimate population or traffic from color intensity alone.
Does the 30.57% class difference mean nearly one-third of Miller County was completely transformed?
No. The figure counts cells whose representative class differs between 1985 and 2025. It includes a 2.53% transition-to-developed category, 7.51% forest-loss category, 3.07% agricultural-loss category, and 16.00% other differences, along with mapped wetland differences. Classification variation and mixed pixels can contribute, so a specific cause requires more evidence.
Map File Information
The ZIP includes four original JPG maps for Miller County: 2025 land cover, forest and farmland, impervious/developed land, and 1985–2025 land-cover change.
- Included Files: land cover, forest/farmland, impervious/developed land, and land-cover change maps
- File Type: one ZIP containing four JPG files
Related Maps
- A Craighead County Arkansas Land Cover Map
- Arkansas County Arkansas Land Cover Map
- Ashley County Arkansas Land Cover Map
Sources and References
- MRLC Annual NLCD Data – official access point for Annual NLCD land-cover products and related datasets.
- USGS Annual NLCD Land Cover Classification – explains the Annual NLCD classification framework used to interpret mapped classes.
- U.S. Census Bureau TIGER/Line Shapefiles – official geographic boundary and line-data resource.
- University of Arkansas System Division of Agriculture – Miller County Extension – local agriculture and natural-resource programs and services for Miller County.
- Encyclopedia of Arkansas – Miller County – trusted county background on Texarkana, the Red River border, terrain, forests, and agriculture.
Green Map creates custom-edited map images using open geographic data sources such as geoBoundaries, Natural Earth, OpenStreetMap, and government open data.
These maps are edited visual materials, not raw data files, and are provided for education, documents, presentations, and graphic reference.