The Lake County California Land Cover Map is organized around one feature that immediately separates this county from many inland California examples: Clear Lake occupies a large part of the center while shrubland, forest, grassland, and developed areas wrap around it. The 2025 summary reports 61.62% shrubland, 14.27% grassland, 12.27% forest, 5.46% water, and 4.29% developed cover.
This page presents four related maps—general land cover, forest and farmland, impervious surface and developed land, and 1985–2025 land-cover change—and the four JPG files are available together in one ZIP archive. A land-cover class describes the mapped physical surface rather than parcel ownership, zoning, legal land use, or development rights.
Table of Contents
Clear Lake anchors a 2025 landscape dominated by shrubland
Clear Lake is the most prominent feature on the general map. Its large blue surface occupies the center-western portion of the county and makes the 5.46% water share visually important even though water is not one of the top three land classes. Lake County Water Resources describes Clear Lake as California’s largest natural lake and operates monitoring programs for the lake, tributaries, and other local water bodies. The land-cover map is not a water-quality product, but it clearly shows why water is fundamental to the county’s geography.
Beyond the lake, shrubland is the dominant class at 61.62%. Tan-brown cover stretches across much of the north, east, and southeast, with forest and grassland breaking it into irregular patches. A shrubland classification identifies the dominant surface vegetation at the raster-cell scale; species, ownership, fire history, and management status fall outside that classification. The broad pattern supports countywide comparison without implying that every tan cell has the same ecological condition.
Grassland accounts for 14.27% and appears in larger light-green areas around the north, near parts of the lake basin, and in the south. Forest covers 12.27% and becomes more prominent along the western and southwestern mountain areas, with additional forest patches toward the northwest. The short-distance transitions among shrubland, grassland, and forest are one of the map’s most important county-specific characteristics. Lake County cannot be summarized accurately by a single vegetation class even though shrubland holds the largest percentage.
Developed cover represents 4.29%, but the red areas are locally prominent around parts of Clear Lake and in a few southwestern corridors. Official county information places Lakeport on the western shore of Clear Lake and Clearlake on the southern shore, providing geographic context for the shoreline development pattern. Municipal boundaries are not labeled on the image; the developed polygons represent surface classification rather than exact municipal outlines.
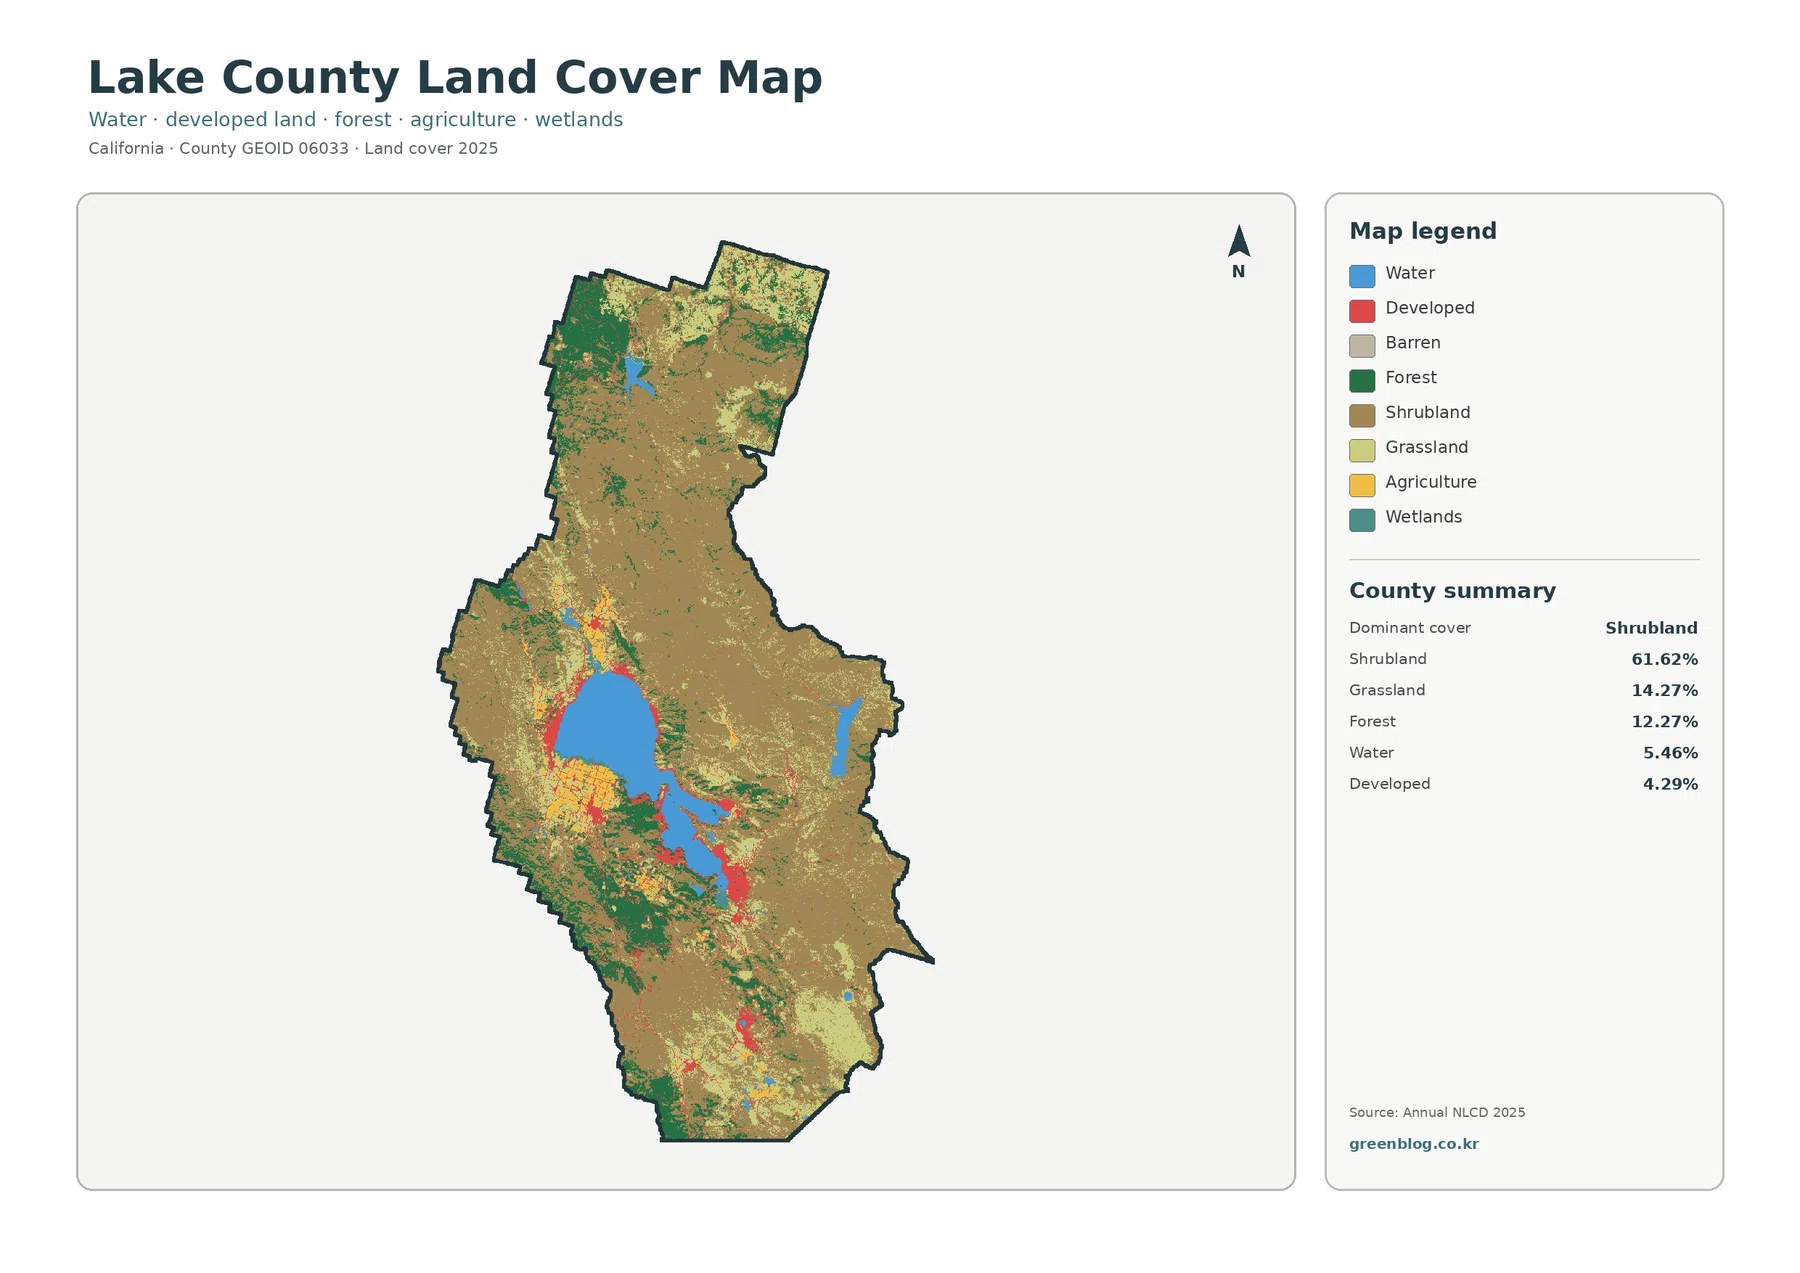
Clear Lake provides the main geographic anchor. Shrubland dominates much of the north and east, forest becomes more prominent in the west and southwest, and developed clusters appear along parts of the shoreline.
Forest and farmland separate more clearly around the lake basin
The forest and farmland view simplifies the legend so that wooded land, agriculture, water, wetland, and open vegetation are easier to compare. Forest remains 12.27%, agriculture is 1.48%, water is 5.46%, grassland 14.27%, shrubland 61.62%, and wetlands 0.56%. The reduced legend makes the contrast between western forest patches and the broad shrubland background much easier to explain.
Forest is especially visible west and southwest of Clear Lake, with additional green groups in the northwest. Around some parts of the lake basin, forest, grassland, and shrubland meet within a relatively short distance. Lake County’s General Plan includes separate chapters for open space and conservation, water resources, and agricultural resources. Those planning categories are not the same as satellite land-cover classes, but they reinforce the presence of several closely connected resource landscapes rather than one uniform land type.
Agriculture covers only 1.48%, so yellow cropland is limited to smaller areas, particularly west and southwest of the lake and in a few scattered valleys. That percentage is not equivalent to orchard, vineyard, or farm acreage. The 2025 map simply shows cells assigned to an agricultural land-cover class. Commodity production and exact agricultural parcels require agricultural statistics and field-level mapping.
Water remains a major visual feature because Clear Lake dominates the center of the map. Wetlands cover just 0.56%, appearing as much smaller teal patches and narrow margins. Lake County Water Resources monitors Clear Lake, tributaries, and additional water bodies, but a land-cover image cannot report water quality or legal wetland boundaries. Blue and teal colors locate mapped surface classes; water quality, navigability, and protection status require separate information.
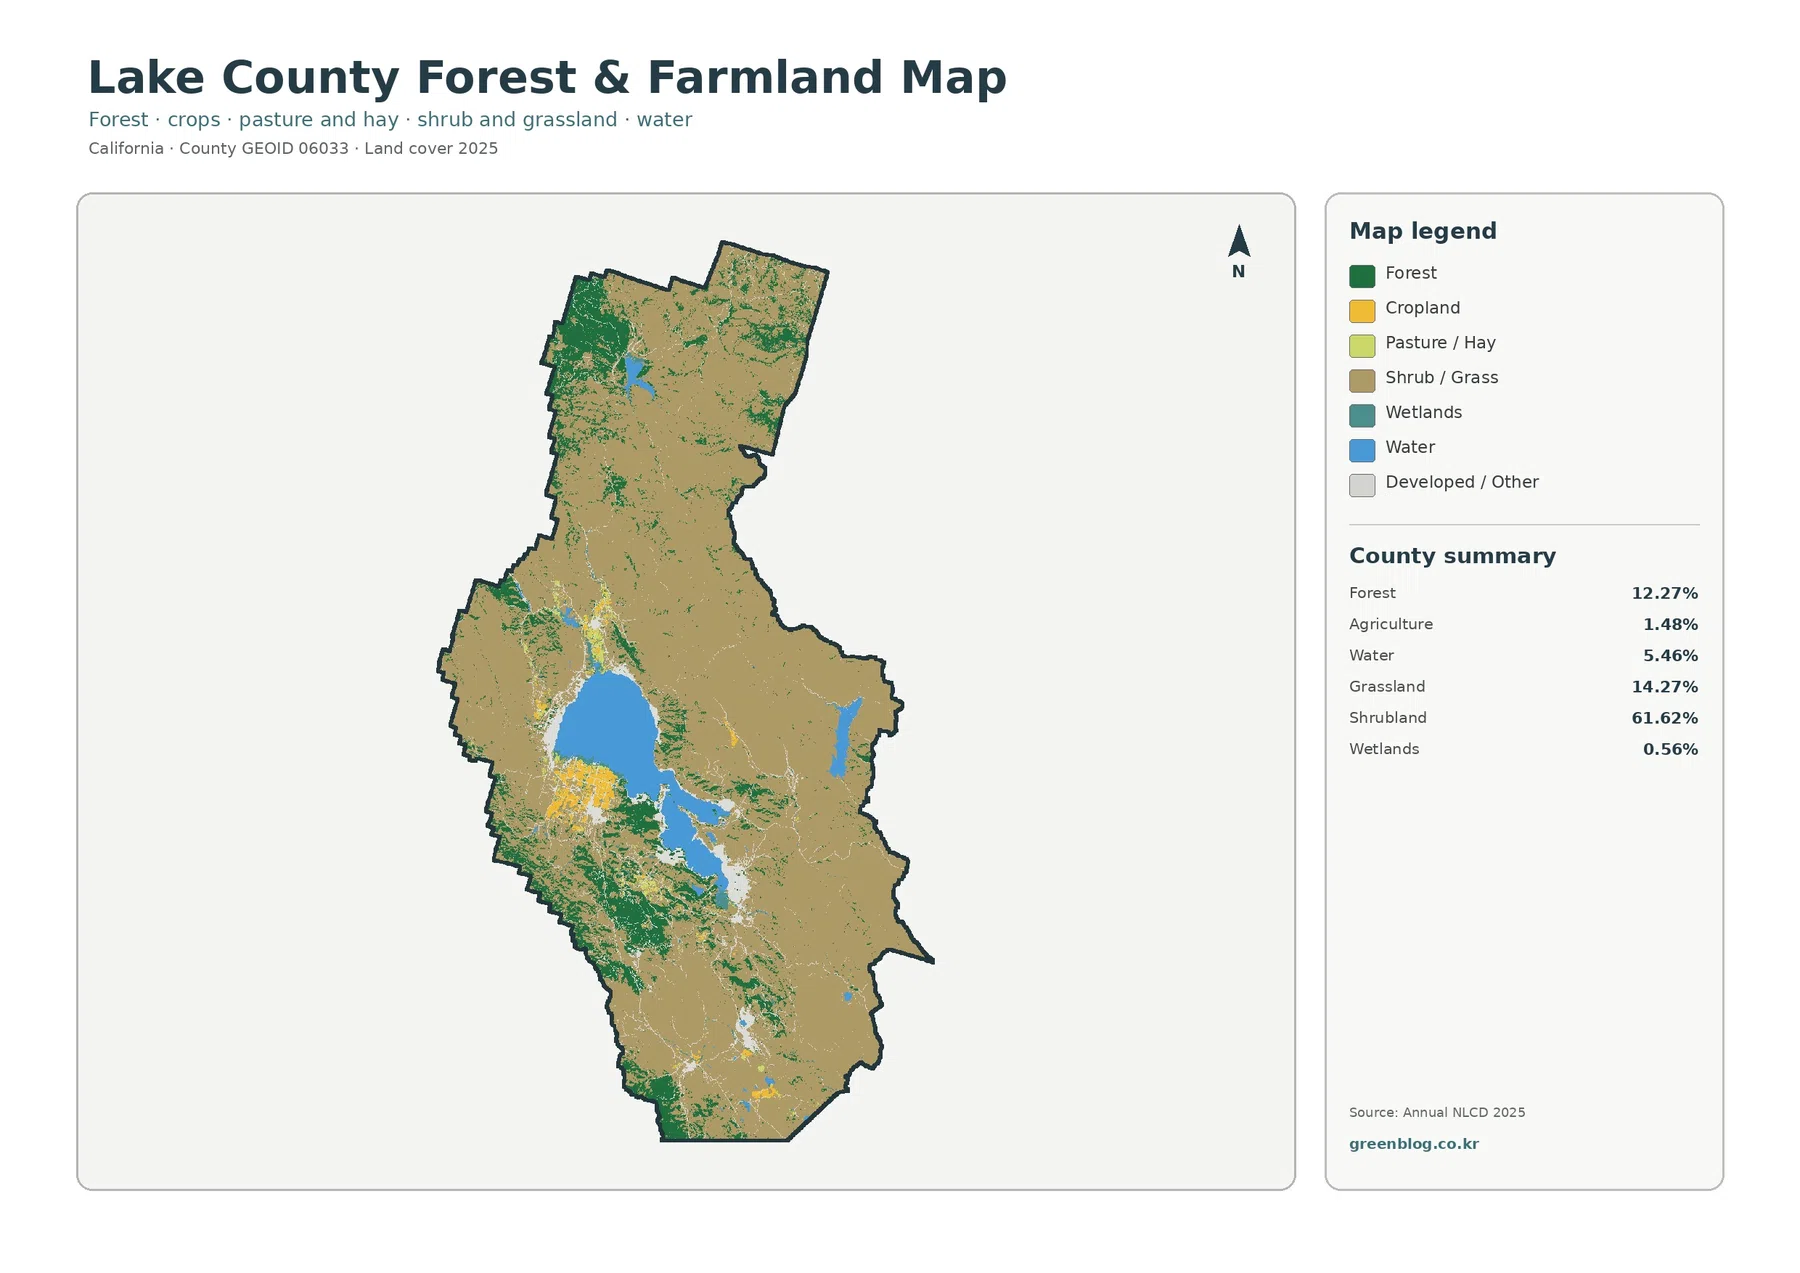
This view emphasizes how wooded slopes, open vegetation, and agricultural pockets relate to the lake. It reduces urban detail from the general map, while the impervious view isolates shoreline development, roads, buildings, and other hard surfaces.
Hard surfaces cluster along the western and southern Clear Lake settlement areas
Impervious surface measures roofs, pavement, parking areas, and other materials with very low water infiltration. Lake County’s 2025 mean impervious value is 1.01%, and 0.39% of the county is mapped at 50% or greater imperviousness. Developed land covers 4.29%, which is intentionally a broader measure. Developed cells can contain trees, lawns, bare soil, and other permeable ground in addition to hard surfaces.
The strongest orange and red values occur west and south of Clear Lake and continue through a few southwestern settlement corridors. Lakeport on the western shore and Clearlake on the southern shore provide geographic context for those concentrations. Smaller points and thin lines extend elsewhere, but the large shrub- and forest-dominated parts of the county remain mostly white or very pale on the impervious map.
Comparing the general map with the impervious view clarifies why 4.29% developed cover is not equivalent to 1.01% mean imperviousness. The first classification identifies a broader developed landscape; the second estimates how much hard surface occurs within cells. A lakeside residential area can therefore be classified as developed while still containing substantial tree canopy, soil, yards, or other surfaces that absorb water.
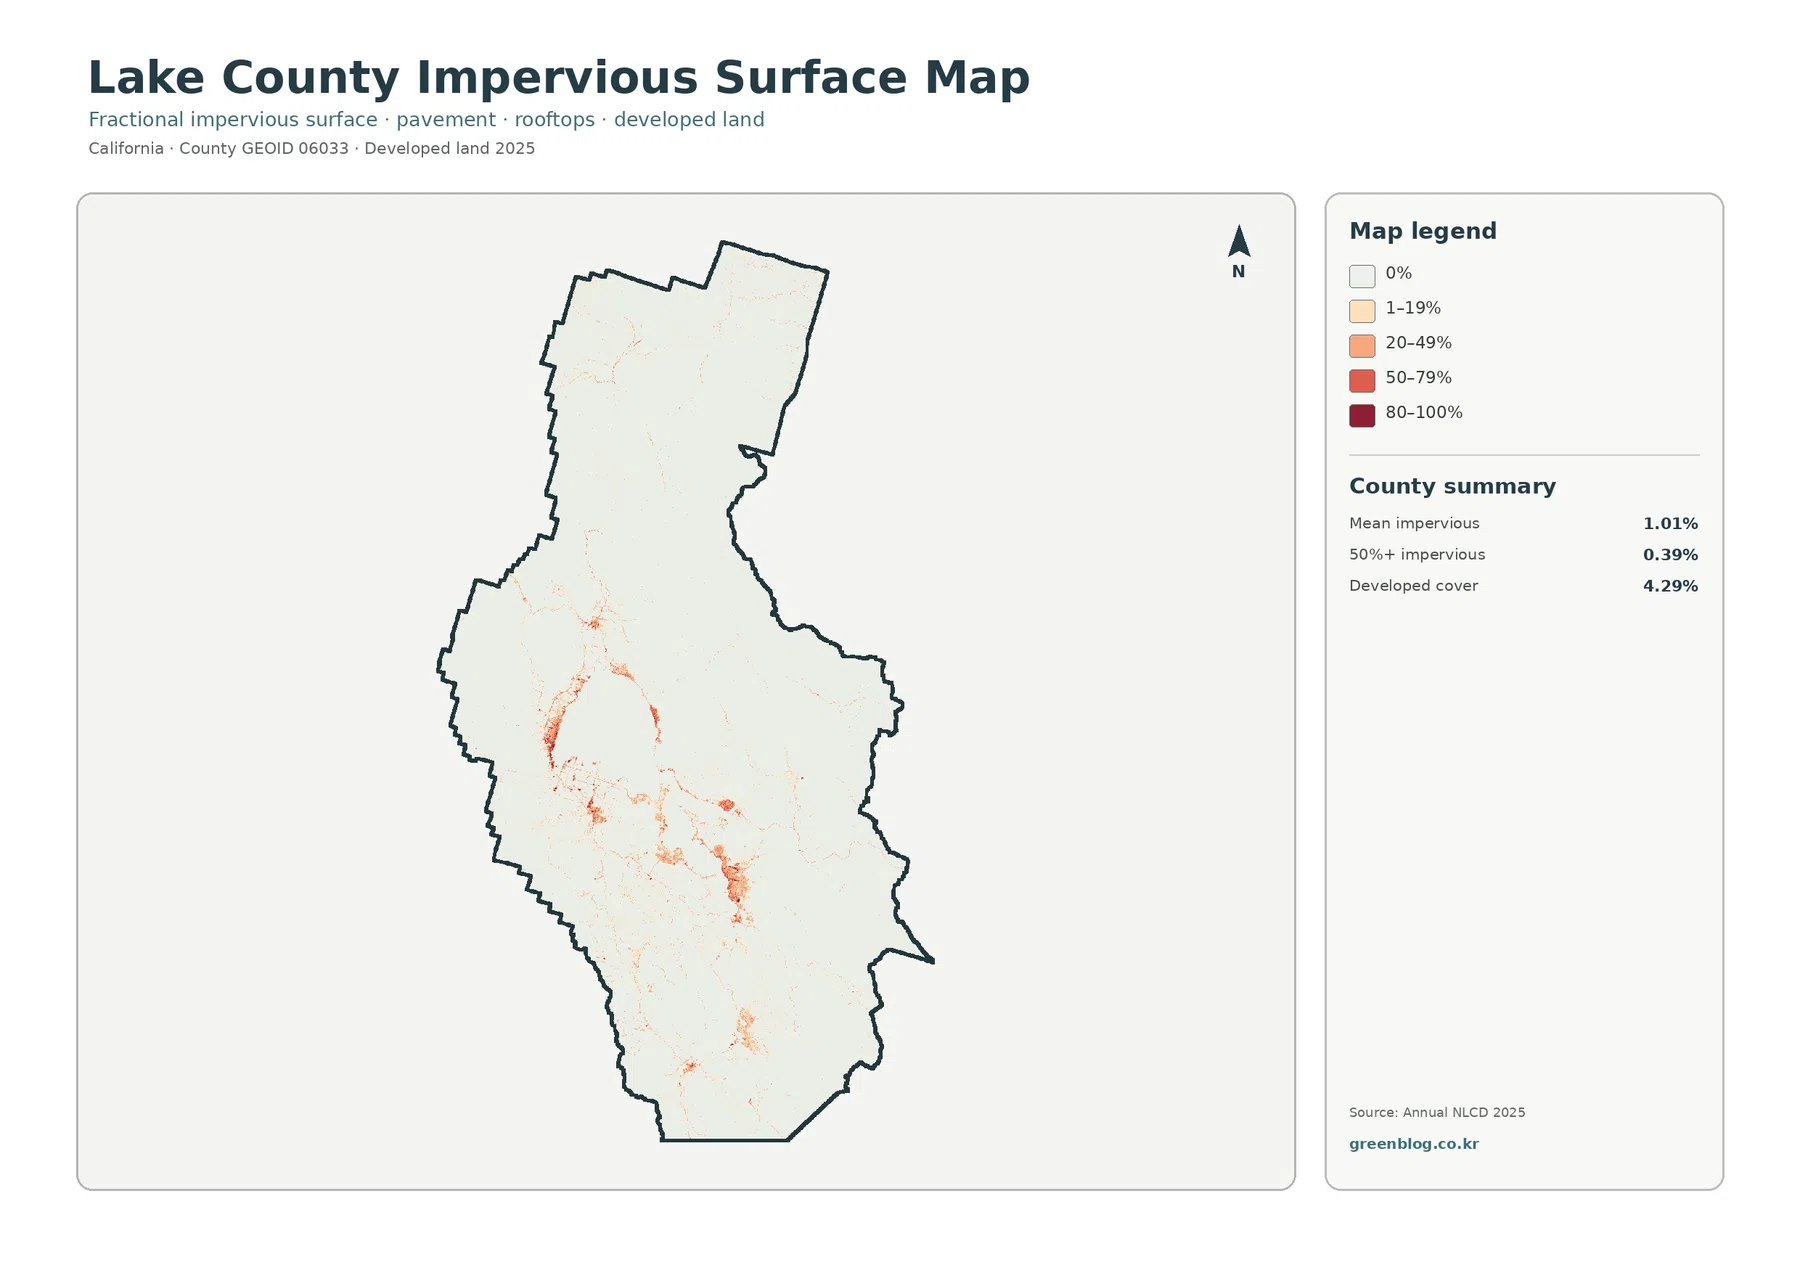
Lake County Water Resources manages issues including surface-water monitoring, flood management, lakebed management, and stormwater. Impervious data add background on pavement and rooftops, but this countywide map is not a standalone predictor of flooding or water-quality problems. Slope, soils, rainfall, drainage infrastructure, shoreline conditions, and tributaries all matter.
The 1985–2025 comparison shows a large forest-loss classification
The change map compares classifications from 1985 and 2025. Total class difference is 35.29%, a much larger figure than in many other county comparisons. Forest-loss classification is the largest component at 21.75%, followed by other class difference at 11.46%, transition to developed land at 1.13%, and agricultural loss at 0.83%. These figures summarize classification differences between two dates; they are not evidence that 35.29% of the county permanently changed for one cause.
Orange forest-loss cells are widespread across the north and central county and appear in several southern areas as well. Many of those locations are shrubland or grassland in the 2025 map. A cell classified as forest in the earlier date and as another class in 2025 may represent real vegetation change, but the map cannot determine whether fire, harvest, drought, regrowth, image timing, or classification behavior is responsible. It would be misleading to state that exactly 21.75% of Lake County’s forest was physically removed.
Purple other-difference cells account for 11.46% and are especially visible in the southeast, with additional patches scattered around the lake basin and northern areas. This category combines differences not assigned to the named development, forest-loss, agricultural-loss, or wetland groups, so there is no single explanation for every highlighted cell. The mapped cells identify locations where the 1985 and 2025 classifications differ.
Transition to developed land is 1.13%. Red change cells appear near some of the same western and southern Clear Lake areas that contain current developed and impervious surfaces. Agricultural loss is smaller at 0.83% and appears in scattered yellow pieces. Both categories identify areas of mapped difference, but neither percentage is a direct measure of building permits, city-boundary growth, or verified farmland conversion.
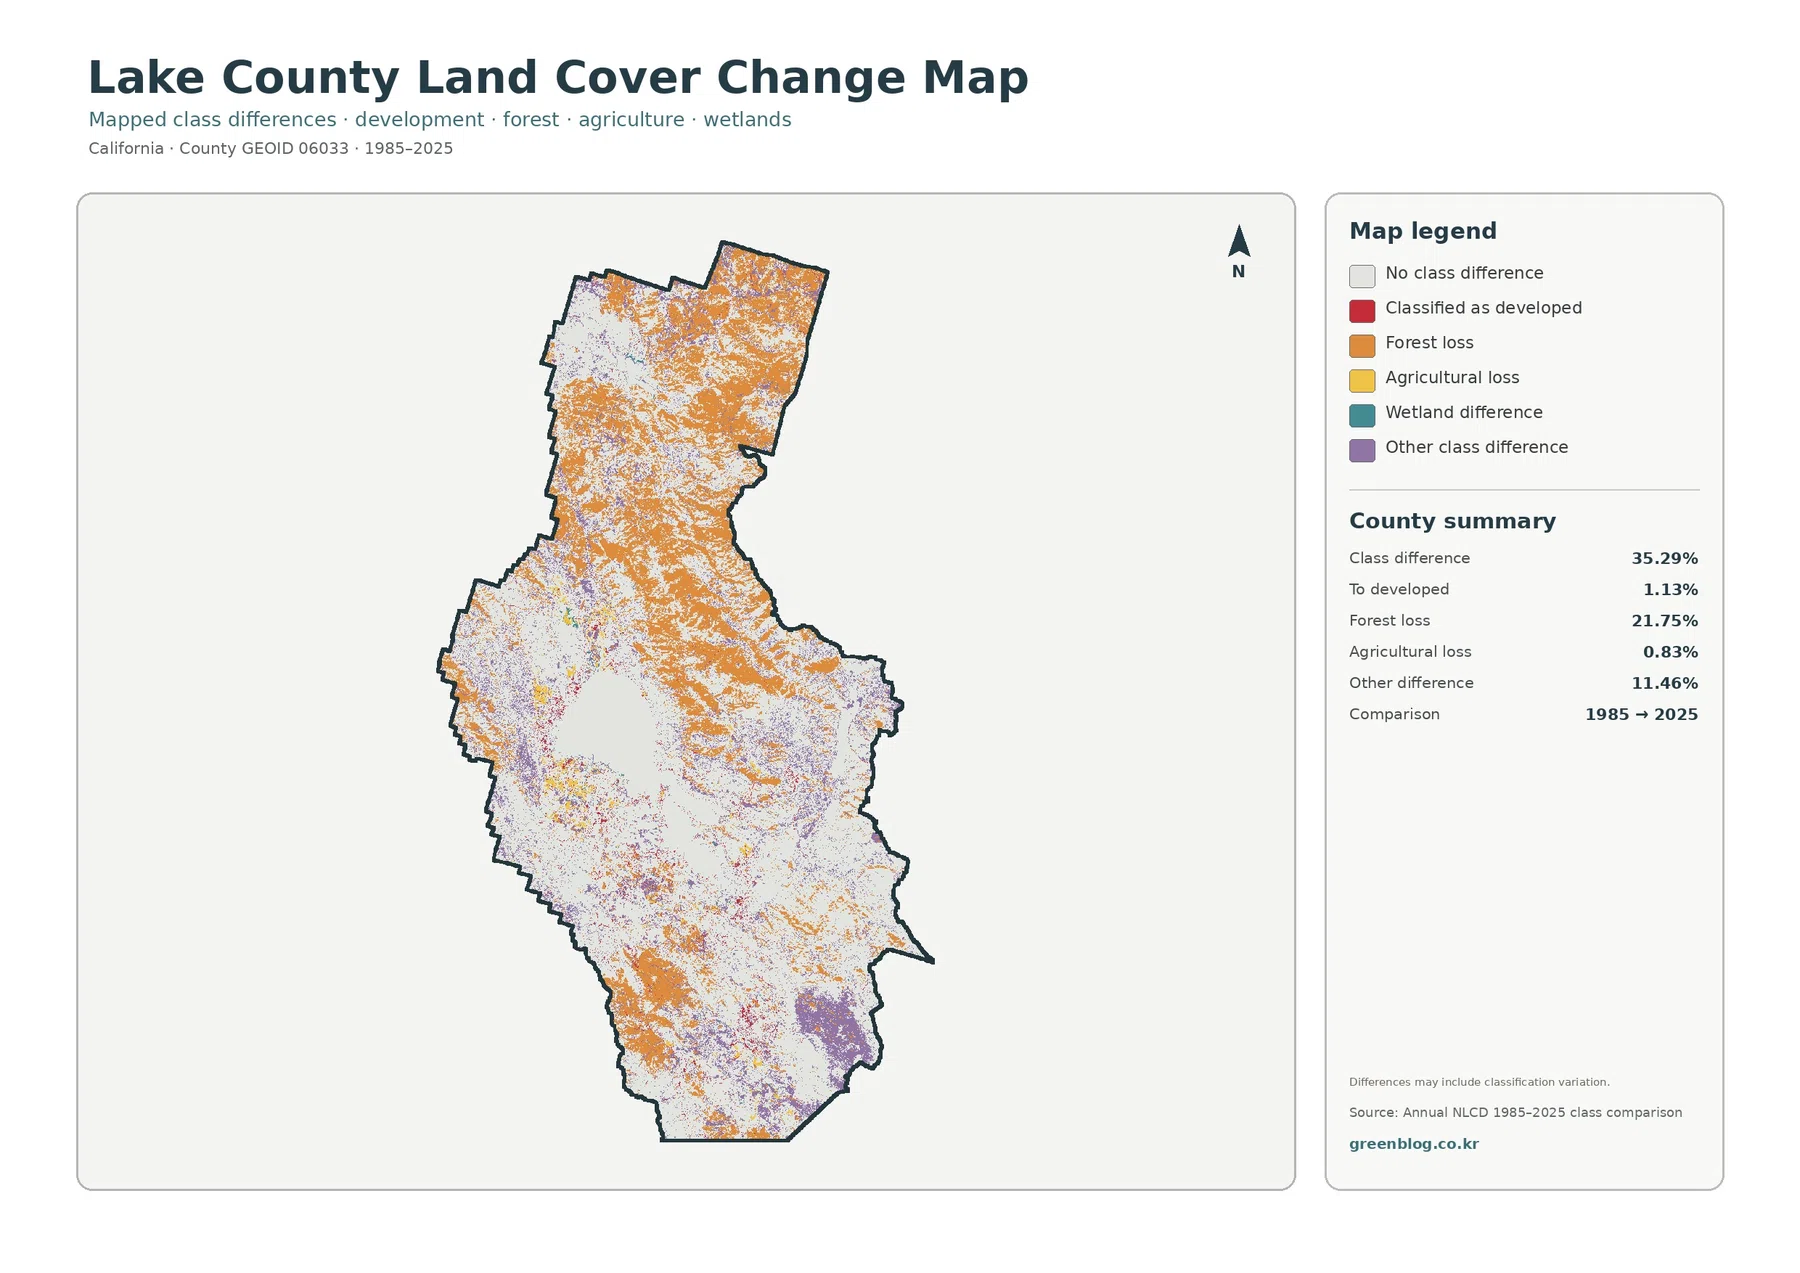
The map itself warns that differences may include classification variation. That note is particularly important in a county where shrubland, forest, and grassland meet along complex mountain boundaries. A 30-meter cell can contain more than one vegetation type, and seasonal appearance or imagery conditions can change the assigned class. The change map locates areas of endpoint difference but cannot establish the cause of a change.
Lake, mountains, and settlement form three geographic zones
Clear Lake provides the first zone: water occupies a large, recognizable central feature and development clusters along parts of its shoreline. Lakeport and Clearlake add verified geographic context for the western and southern settlement pattern. Smaller shoreline communities are also documented by the county, but their boundaries are not represented in the land-cover map.
The mountain and upland zone is different. Forest becomes stronger along portions of the west and southwest, while shrubland dominates much of the east and north. Grassland fills some of the transitions between those classes. The simplified forest/farmland legend separates wooded slopes from the larger shrub and grass background even though agriculture accounts for only 1.48%.
Settlement and transportation surfaces form the third zone. They occupy a relatively small countywide share, yet they stand out clearly on the impervious map. The general and impervious maps together distinguish the extent of developed land from the smaller fraction occupied by roofs and pavement. Zoning and future-growth policy come from the Lake County General Plan rather than map color.
The change map adds the long-term comparison to the three current-condition views. A large orange forest-loss area or purple other-difference patch cannot reveal its present-day class by itself; the 2025 map shows whether the location is now shrubland, grassland, forest, developed land, water, or another class.
Lake County land-cover JPG map set
The WebP images are optimized for on-page viewing. The ZIP contains four JPG maps: 2025 general land cover, forest and farmland, impervious surface and developed land, and the 1985–2025 land-cover change comparison. All four maps use the same county boundary for side-by-side comparison.
The legend and date provide essential context. Shrubland, grassland, and forest are separate classes; developed cover and impervious percentage describe different properties; and the change map compares two years rather than representing current conditions.
These are county-scale reference graphics rather than parcel surveys or regulatory maps. Zoning, legal wetland delineations, water-quality data, engineering plans, and permits remain separate authoritative resources. Exact boundaries and current legal status come from the appropriate Lake County planning, water-resource, or GIS source.
30-meter scale and the 35.29% change figure
Annual NLCD products generally classify the landscape with raster cells about 30 meters across. That scale provides a countywide overview but simplifies narrow tributaries, small wetland margins, individual roads, shoreline development edges, and boundaries between forest and shrubland. One cell may contain trees, shrubs, grass, soil, and pavement even though the classification assigns one main class or impervious percentage.
The 35.29% change statistic is separate from current land-cover percentages. Forest covers 12.27% in 2025, while the forest-loss change category is 21.75%. Those values answer different questions and are not contradictory: one describes the current mapped class, while the other summarizes cells meeting a two-date transition condition. Subtracting one percentage from the other would create a misleading result.
The current-condition maps end at the 2025 observation year. The change map compares the 1985 and 2025 endpoints rather than reconstructing every event between them. A place can change several times and return to a similar final class, leaving little evidence of the intermediate sequence in a two-date product.
Lake County’s General Plan addresses land use, conservation, water resources, and agricultural resources from a policy perspective. The land-cover map describes the physical surface seen in a raster classification. A shrubland cell may be public or private, protected or developable, and none of those legal distinctions can be inferred from the tan map color alone.
With those limits in mind, the map set gives a strong countywide picture. Shrubland dominates, forest and grassland form important mountain and basin contrasts, Clear Lake creates a major central water feature, and development and impervious surfaces concentrate around selected shoreline communities. The change map adds a long-term comparison with a large forest-loss classification, while the cause of a specific mapped difference remains undetermined without additional data.
Frequently Asked Questions
What is the largest 2025 land-cover class in Lake County?
Shrubland is the largest class at 61.62%, followed by grassland at 14.27% and forest at 12.27%. Water covers 5.46%, with Clear Lake forming the dominant central water feature.
Are the 4.29% developed-cover value and 1.01% mean impervious value the same thing?
No. Developed cover is a broader landscape class, while impervious data estimate hard surfaces such as roofs and pavement. Developed areas can still contain trees, soil, lawns, and other permeable surfaces.
Does 21.75% forest loss mean that exactly that share of Lake County forest disappeared?
No. The change map compares classifications from 1985 and 2025 and may include classification variation. A specific cause for the mapped forest-loss category depends on intermediate imagery, forest records, and other local data.
Sources and reference links
Land-cover and impervious-surface classifications are documented through MRLC Annual NLCD Data, the USGS Annual NLCD Land Cover Classification, and the USGS Annual NLCD Collection 1.2 archive, which extends the annual series through 2025. The USGS Collection 1.2 release notice also identifies the 2025 extension. County boundary and FIPS reference data are available from U.S. Census Bureau TIGER/Line.
County-specific water and lake context is available from Lake County Water Resources and the county’s Clear Lake page. Land-use, conservation, water-resource, and agricultural policy context can be found in the Lake County General Plan.
Lake County land-cover map set
The ZIP contains four JPG maps: 2025 general land cover, forest and farmland, impervious surface and developed land, and 1985–2025 land-cover change.
The maps are suitable for printing, education, presentations, and other map-based reference work.
Lake County map files (ZIP)Related Maps
- Alameda County California Land Cover Map
- Alpine County California Land Cover Map
- Amador County California Land Cover Map
Green Map creates custom-edited map images using open geographic data sources such as geoBoundaries, Natural Earth, OpenStreetMap, and government open data.
These maps are edited visual materials, not raw data files, and are provided for education, documents, presentations, and graphic reference.