The Kings County California Land Cover Map makes one contrast immediately clear. A tight agricultural grid fills most of the north and center, while broad grassland opens across the southwest. In the 2025 classification, agriculture accounts for 62.92% of the county, grassland 25.07%, and developed land 7.96%. The remaining classes are small by percentage, but water, wetlands, shrubland, and barren ground still help explain local differences inside this strongly agricultural county.
Four map views are included here: general land cover, forest and farmland, impervious surface and developed land, and a 1985–2025 land-cover change comparison. The browser images use WebP for quick viewing, and the four original JPG maps are available together in one ZIP download. They are useful for comparing the farm grid with settlement clusters, the southwestern open land, hard surfaces, and long-term classification differences.
Table of Contents
The southwest breaks the pattern of an otherwise agricultural county
Across the north and center, yellow agricultural cover forms large connected blocks with straight edges and a dense field pattern. That visual footprint matches the 62.92% agricultural share in the 2025 summary. Fields dominate enough of the county to look almost uniform at first glance. The southern and southwestern portions quickly reveal a different surface pattern.
Grassland covers 25.07% and is most extensive in the southwest. Light green areas there are broader and less regular than the rectangular farm blocks farther north. Smaller grassland patches also appear between agricultural and developed areas. The grassland class describes the vegetation visible in the classification; it does not establish whether the land is used for grazing, conservation, military activity, or another legal purpose.
Several compact red clusters represent the 7.96% developed share. County information lists Hanford, Lemoore, Corcoran, and Avenal as the four incorporated cities and identifies Hanford as the county seat. Those separated city locations provide useful context for a map where development appears as distinct centers rather than one continuous urban belt. The red polygons are land-cover classes, however, not municipal boundaries.
Smaller brown and gray areas add detail to the southwest. Shrubland makes up 1.26%, while barren cover is 1.33%. Barren land is not missing data; it represents sparsely vegetated exposed surfaces within the classification. The brown shrub category represents a separate vegetation class. Keeping those categories distinct avoids reducing every nonagricultural part of the southwest to a single “open land” label.
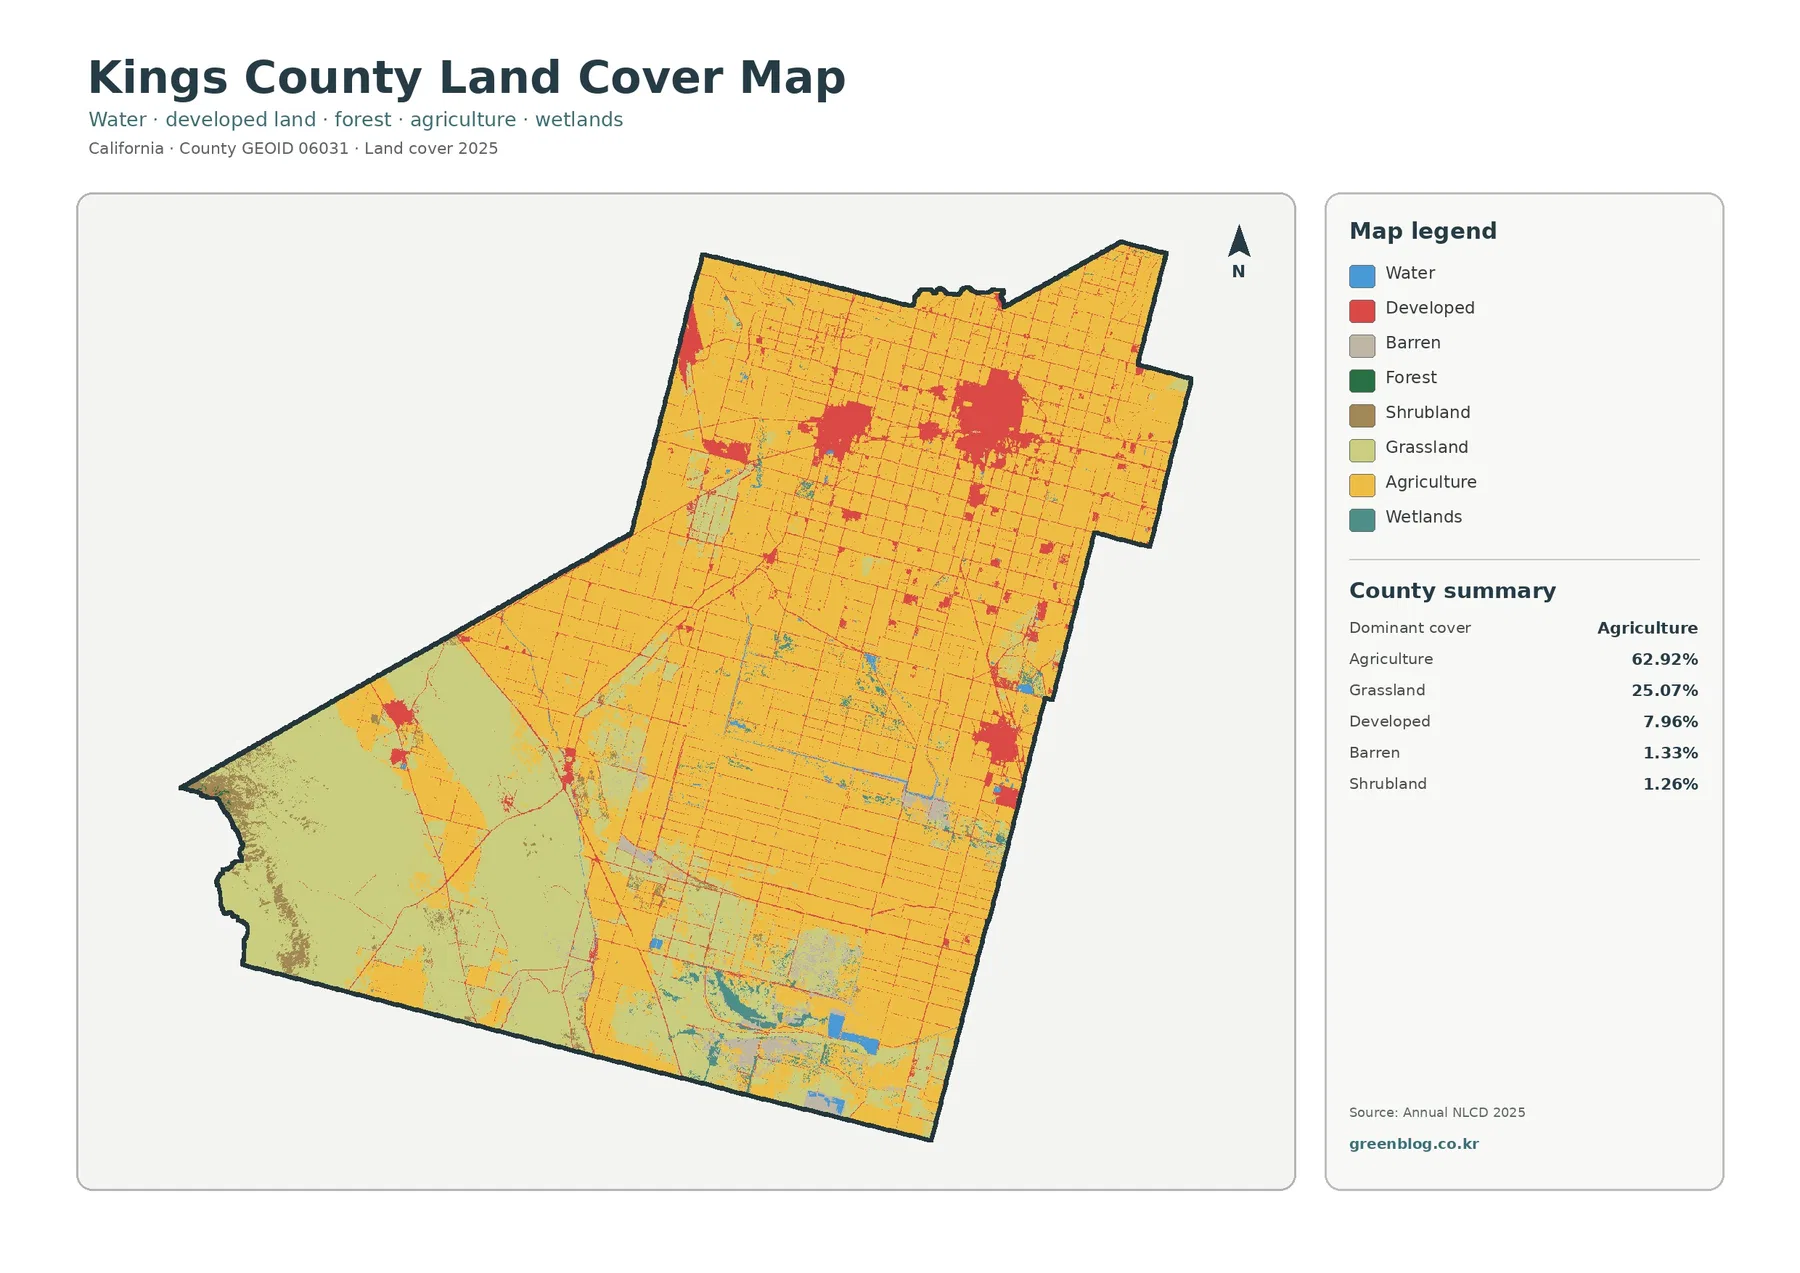
For a first reading, compare the yellow agricultural blocks with the light-green southwest before looking at the smaller classes. That sequence makes the county’s strongest regional difference easy to see. Afterward, the developed clusters, water features, wetlands, shrubland, and barren patches can be added without losing the main pattern.
Hard surfaces form compact clusters and thin lines through the farm grid
Impervious surface means roofs, pavement, parking areas, and other materials that do not readily absorb water. The 2025 countywide mean is 2.77%, and 2.08% of Kings County is mapped at 50% or greater imperviousness. Those values are lower than the 7.96% developed-land share because developed areas can include lawns, trees, soil, and other permeable surfaces.
Dark orange and red values are concentrated in several northern and central settlement areas instead of spreading evenly across the county. Smaller clusters also appear farther east and southwest. The separated pattern fits the county’s four-city geography, although the map does not label or trace exact city limits. Hanford, Lemoore, Corcoran, and Avenal should therefore be used as geographic reference points rather than as exact names for individual colored polygons.
Thin hard-surface lines cross the agricultural grid between the larger clusters. The county’s official overview names Interstate 5 and Highways 41, 43, and 198 among its major roads. At county scale, the impervious map cannot identify every route by name. The thin-line pattern still shows that hard surfaces extend beyond compact urban centers and continue through working agricultural areas.
Much of the southwestern grassland remains white or very pale in this view. The difference from the northern agricultural-and-settlement area is therefore easy to recognize even without zooming in. A 2.77% county average should not be reused as the pavement percentage for a city, neighborhood, or watershed. Local drainage work would require finer impervious data together with rainfall, soils, canals, and stormwater infrastructure.
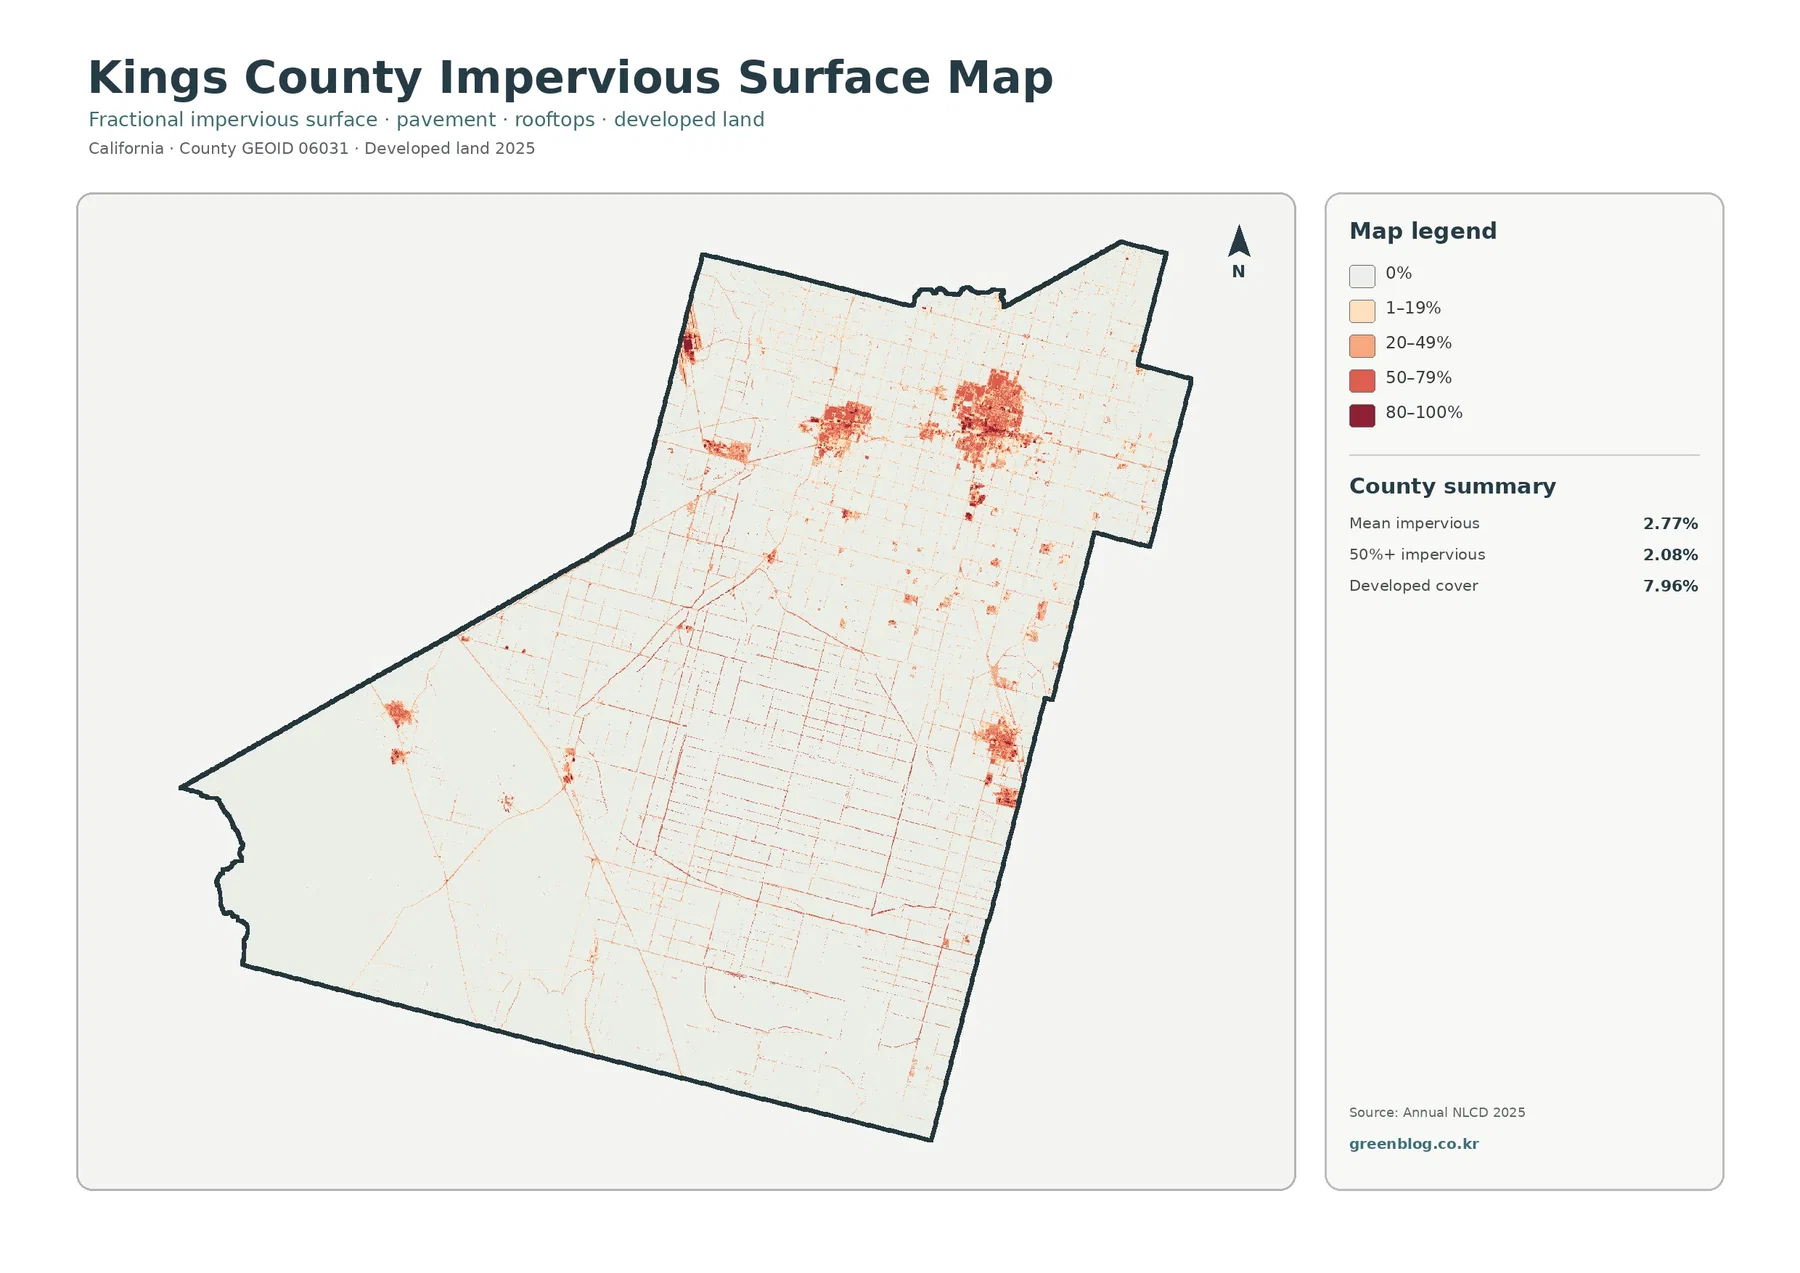
Placing this image beside the general land-cover map separates two concepts that are often confused. One classifies a broader developed landscape; the other measures how much of a cell is actually covered by hard surface. Zoning, development rights, and parcel status belong to Kings County planning records rather than either of these satellite-based products.
A simplified agriculture view makes water, wetlands, and the lack of forest easier to notice
Removing some of the urban detail makes the land-cover balance easier to read. Agriculture remains 62.92% in the forest-and-farmland summary, with grassland at 25.07%. Shrubland is 1.26%, wetlands 0.95%, water 0.49%, and forest only 0.02%. The near absence of forest is one of the most distinctive features of this map set.
Official county materials place Kings County in California’s San Joaquin Valley, while the Agricultural Commissioner publishes annual Crop Reports. That regional and administrative context helps explain why agriculture is important locally. It should not be confused with the land-cover percentage itself: 62.92% is a 2025 surface classification, not harvested acreage, commodity value, or a legal farmland designation.
Blue water and teal wetland colors occupy only small shares, yet they interrupt the farm pattern in several central and southern locations. Because the underlying raster is about 30 meters per cell, narrow canals and wetland margins may be simplified. For that reason, this view is useful for orientation rather than tracing a legal wetland boundary or managing a specific waterway.
Gray developed/other areas still appear around settlements and roads, but the simplified legend keeps attention on the relationship between cropland and grassland. That makes this version especially useful for a lesson, report, or presentation focused on the county’s dominant surface types. Crop-specific questions should move to the county’s agricultural records rather than relying on map color.
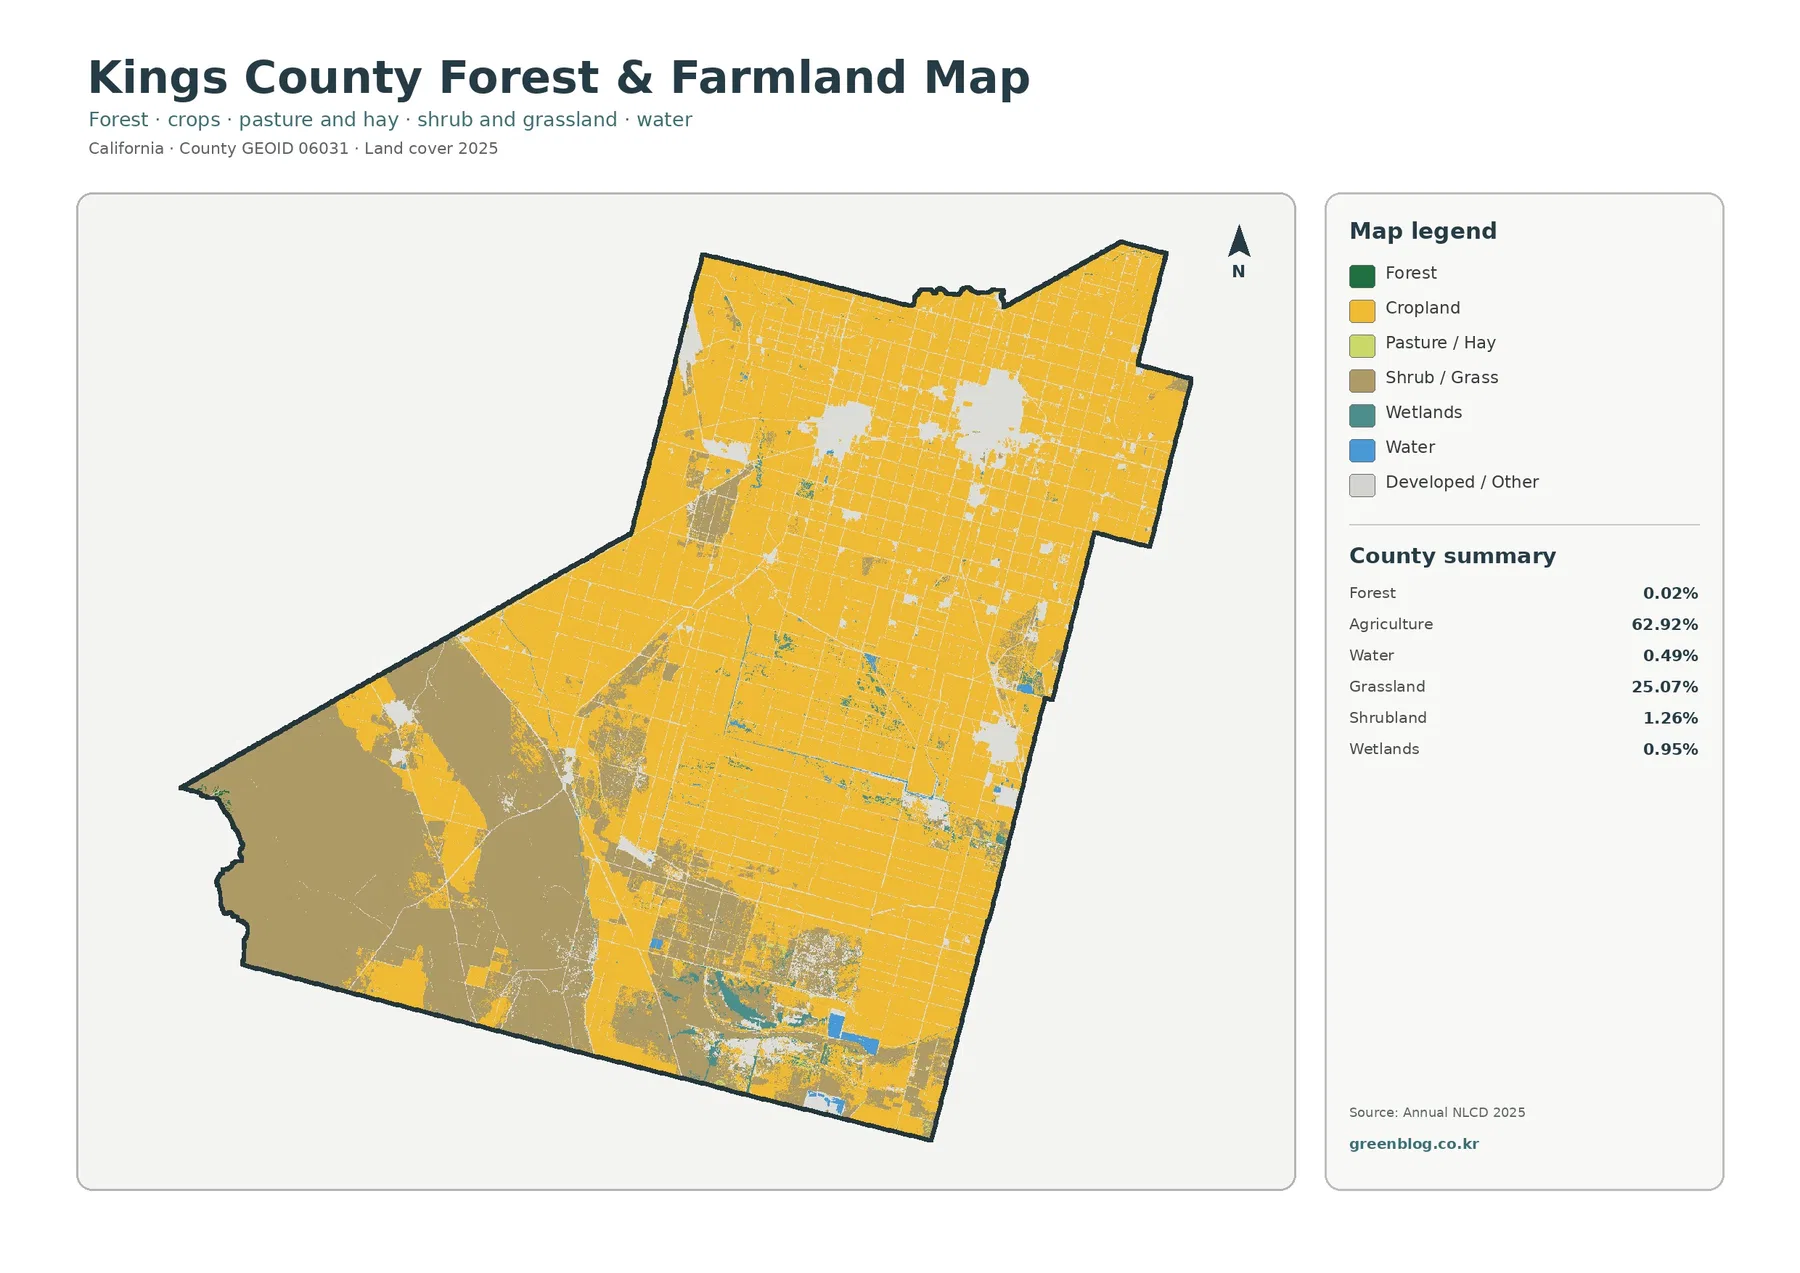
When agriculture is the main topic, this is usually the clearest image to show first. A second slide can then use the general map to add developed and barren classes, or the impervious map to show roads and settlement surfaces. Keeping each map tied to one question produces a clearer explanation than trying to make a single image do everything.
The 1985–2025 comparison is led by the agricultural-loss category
Between the two mapped dates, total class difference is 16.44%. At 9.00%, the agricultural-loss category is larger than other class difference at 3.85%, transition to developed land at 3.27%, and forest loss at 0.06%. These percentages describe cells whose classifications differ between 1985 and 2025; they are not a verified accounting of permanent land-use conversion.
Yellow agricultural-loss cells are especially noticeable in the south and southwest, with additional patches through the west and north. Comparing those locations with the 2025 forest-and-farmland map shows that some are now assigned to grassland, developed/other, or another nonagricultural class. Real conversion may be part of the story, but fallow conditions, crop appearance, image timing, and classification rules can also affect the result.
Red transition-to-developed cells account for 3.27% and occur around several present-day settlement clusters. The current impervious map is useful beside this change product because it shows where hard surfaces are concentrated now. Even with that comparison, the 3.27% figure should not be described as the growth of city limits, building permits, or exact urban acreage.
Purple areas represent 3.85% in the broad other-difference category. They appear in the southwest, center, and parts of the east without pointing to one specific process. Intermediate Annual NLCD years or historical aerial imagery are better choices when a particular purple cluster needs an explanation.
Only 0.06% falls into the forest-loss category. With forest at just 0.02% in the 2025 simplified map, orange forest-related change is not a major visual element here. Small percentages do not prove that no local vegetation change occurred; they simply show that forest is not an important countywide class in this particular comparison.
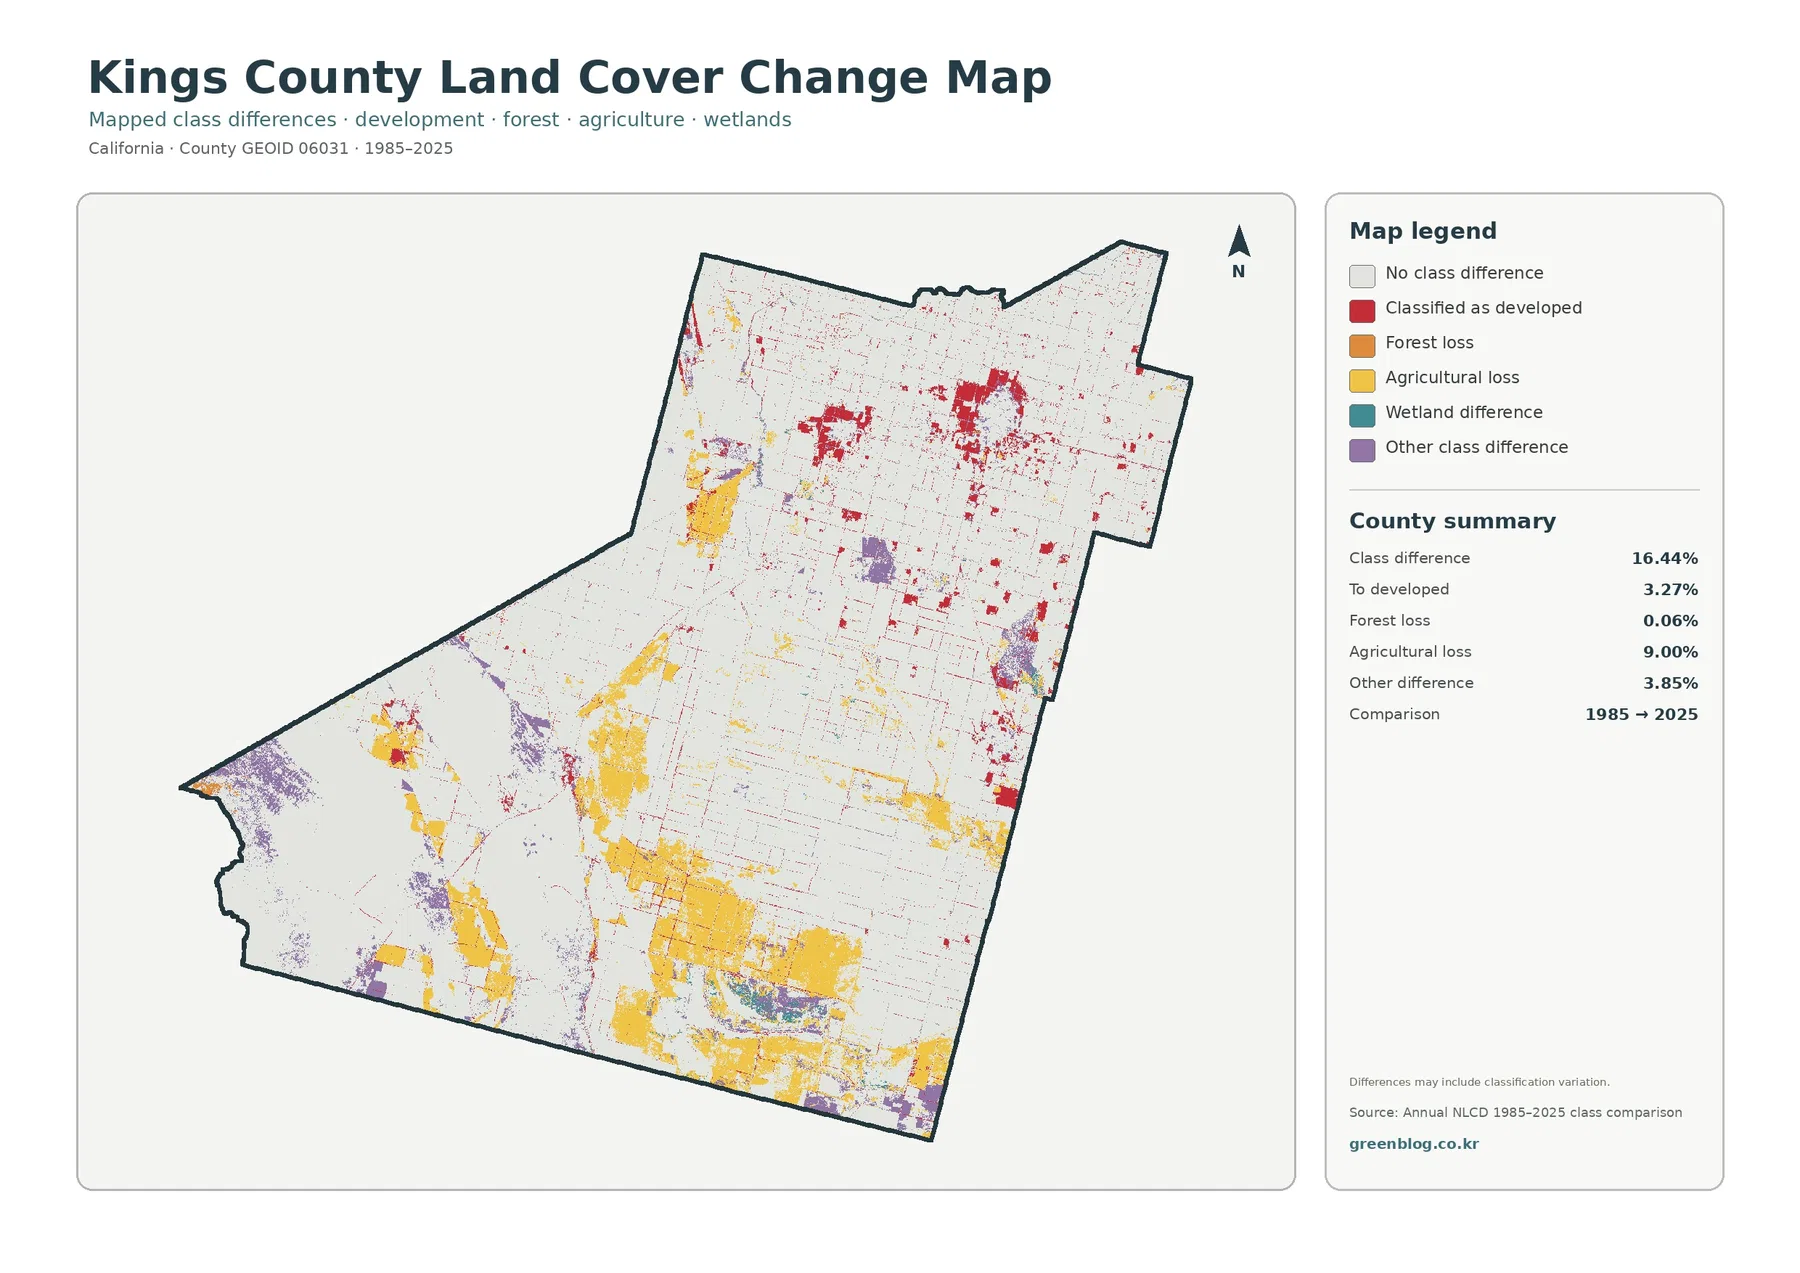
A note on the change product warns that class differences may include classification variation. That caution is especially important in farm country, where crop cycles, fallow fields, bare soil, and seasonal conditions can change the appearance of a 30-meter cell. The image is best used to locate areas for follow-up, not to assign a cause by color alone.
Different questions call for different map pairs
For an agricultural overview, use the general map with the forest-and-farmland view. Together they show how the 62.92% agricultural share is distributed and where the broad southwestern grassland interrupts the farm grid. Production details can then come from crop reports without being confused with surface classification.
For settlement or infrastructure context, combine the general map with impervious surface. The developed class identifies a wider built landscape, while the impervious values isolate harder surfaces such as roofs and pavement. This pairing is useful for presentation graphics because it shows both the location of settlement and the much smaller fraction occupied by highly impervious ground.
Long-term analysis should begin with a 2025 map before the change image is introduced. A yellow or red change cell does not reveal its current land-cover class by itself. Keeping the present-day map nearby lets a reader distinguish current agriculture, grassland, development, water, and other classes from the historical comparison.
County place names can provide orientation, but they should remain separate from the classification itself. County records document Hanford, Lemoore, Corcoran, Avenal, and the major highway system. Exact municipal limits, road alignments, zoning, and parcel decisions require official GIS or planning maps rather than inference from these colors.
Download all four original JPG maps in one ZIP
The WebP versions on the page are intended for quick viewing. The download contains four original JPG maps: 2025 general land cover, forest and farmland, impervious surface and developed land, and the 1985–2025 land-cover change comparison. Their shared county boundary makes side-by-side use straightforward in reports, lessons, slide decks, and research notes.
Retain the legend and year when reusing the images. Agriculture and grassland are separate classes, developed cover is not the same measure as impervious percentage, and the change map represents two dates rather than current conditions alone. Those distinctions are easy to lose when an image is cropped too tightly.
These are county-scale reference graphics. They do not replace parcel surveys, zoning, agricultural field boundaries, legal wetland delineations, engineering plans, or permits. When an exact boundary or legal status matters, use the overview map to locate the area and then consult the responsible agency’s current records.
A 30-meter grid and a two-date comparison both require caution
Annual NLCD products generally classify the landscape with raster cells about 30 meters across. A raster cell is simply one square in a large digital grid. That scale is efficient for countywide comparison, but it can simplify narrow canals, small roads, wetland edges, buildings, and the boundaries between crop fields and development.
More than one real surface can occur inside a single cell. Crops, bare soil, grass, pavement, and water-management features may all be present even though the land-cover map assigns one main class. This mixed-cell effect is one reason field and settlement edges can look more generalized than they do in higher-resolution imagery.
The three current-condition maps represent 2025. Later development, crop changes, or water conditions are not included. Only the 1985 and 2025 endpoints are compared, so a place that changed several times and returned to a similar class may show little difference.
Legal land use requires a different source. Planning and development information comes from the Kings County Community Development Agency, while the Agricultural Commissioner publishes crop-related records. Annual NLCD describes a generalized physical surface. These sources can complement one another, but they should not be substituted for one another simply because all of them deal with land.
With those limits in mind, the four maps give a useful countywide picture. Agriculture dominates the north and center, while grassland opens across the southwest. Several settlements and roads contain the strongest hard-surface concentrations, while agricultural-loss cells lead the 1985–2025 change categories.
Frequently Asked Questions
What is the largest 2025 land cover class in Kings County?
Agriculture is the largest class at 62.92%. Grassland follows at 25.07% and developed land at 7.96%. The map shows agriculture across most of the north and center, while a broad grassland area dominates the southwest.
Why is developed land 7.96% while mean impervious surface is 2.77%?
Developed land is a broad landscape class. Developed cells can include lawns, trees, soil, and other permeable surfaces, while impervious data measure hard surfaces such as roofs and pavement. The two percentages therefore describe different things.
Does 9.00% agricultural loss mean exactly 9% of farmland permanently disappeared?
No. The change map compares 1985 and 2025 classifications and may include fallow conditions, crop appearance, image timing, and classification variation as well as real land conversion. Crop reports, field data, and intermediate imagery are needed to identify a specific cause.
Sources and reference links
Land-cover and impervious-surface classifications can be reviewed through MRLC Annual NLCD Data and the USGS Annual NLCD Land Cover Classification. County boundary and FIPS reference data are available from U.S. Census Bureau TIGER/Line.
Local planning and land-use context is available from the Kings County Community Development Agency. Agricultural programs and Crop Reports are provided by the Kings County Agricultural Commissioner / Measurement Standards. City and highway background is summarized on Kings County About Us.
Map File Information
The ZIP includes four original JPG maps for Kings County: 2025 general land cover, forest and farmland, impervious surface and developed land, and 1985–2025 land cover change.
- Included Files: Use only the versions confirmed in the article and supplied images
- File Type: Use the confirmed download contents
- Intended Use: Printing, education, presentations, and map-based projects
Related Maps
- Alameda County California Land Cover Map
- Alpine County California Land Cover Map
- Amador County California Land Cover Map
Green Map creates custom-edited map images using open geographic data sources such as geoBoundaries, Natural Earth, OpenStreetMap, and government open data.
These maps are edited visual materials, not raw data files, and are provided for education, documents, presentations, and graphic reference.