Madison County is a patchwork of forest and working agricultural land rather than a county dominated by one surface type. The supplied 2025 summary gives forest 47.26%, agriculture 34.42%, and developed land 11.24%. Built areas form several separate clusters instead of one continuous city footprint. This Madison County Georgia Land Cover Map helps compare those settlement pockets with the larger wooded and agricultural landscape around them.
Four WebP previews are included: current land cover, a forest-and-farmland view, fractional impervious surface, and a 1985–2025 endpoint comparison. The four original 2480 × 1754 JPG maps are packaged together in one ZIP for reports, lessons, county profiles, and presentation graphics.
Table of Contents
The county reads as a forest-farm mosaic instead of a simple east-west split
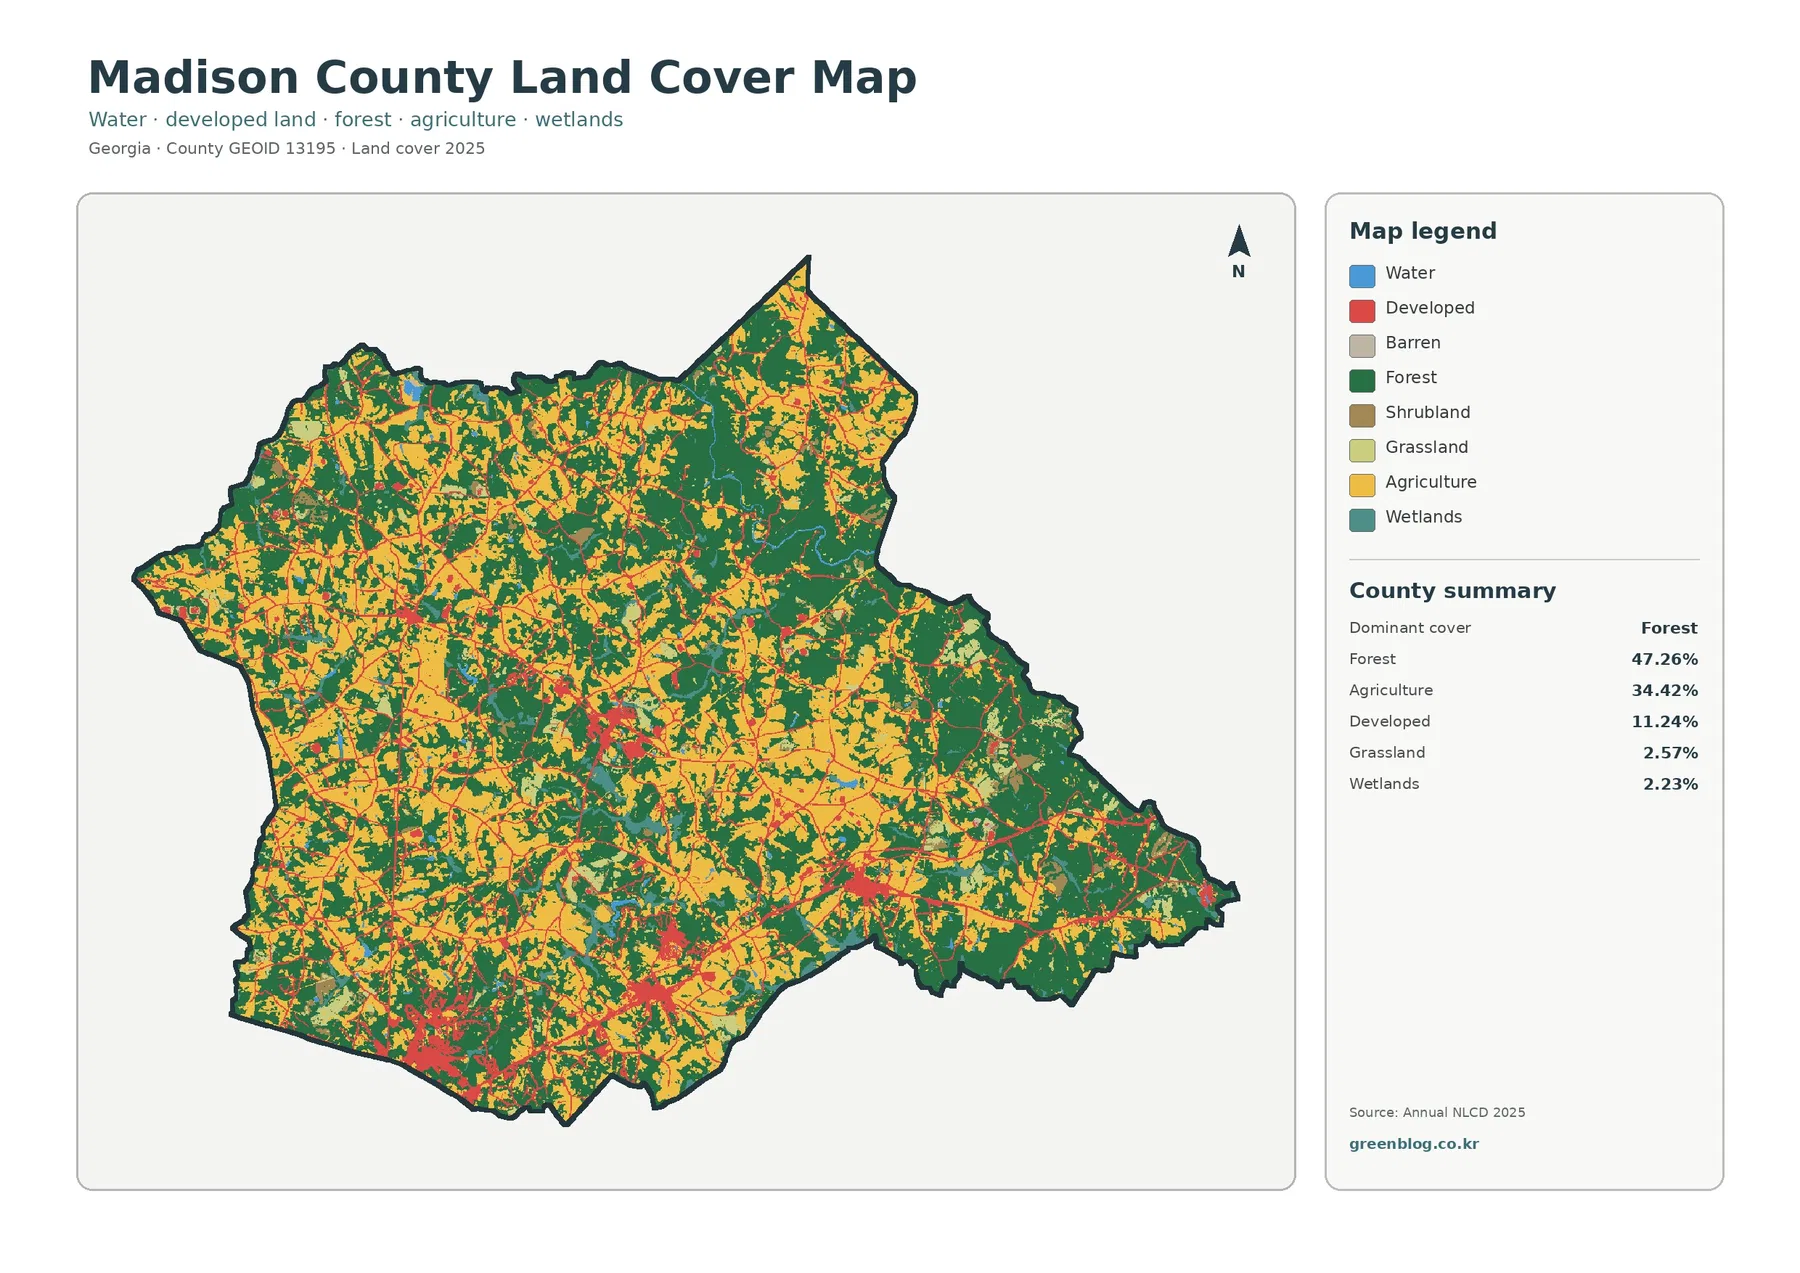
Forest is the largest class at 47.26%. Large dark-green blocks occupy much of the northeast, east, and central county, but green also appears throughout the west and south. Agricultural color repeatedly cuts through those wooded areas rather than remaining in one broad farm belt. The result is a fine-grained rural pattern in which fields, woodland, roads, and homes are usually close together.
Agriculture accounts for 34.42%. Yellow areas are especially frequent in the west, southwest, and center, with additional large blocks extending north and east. The class is broad enough to be a defining feature of the county, yet forest still interrupts almost every large agricultural zone. That is why the map is better described as a mosaic than as a field-dominated plain.
Developed land covers 11.24% and appears in several distinct clusters. The southern and southwestern parts of the county contain the largest built concentrations, while smaller groups appear near the center and east. Madison County government describes the county as close to Athens, Commerce, and Elberton and notes both rural character and suburban influence. That regional context is useful, but the raster itself does not define commuting areas or city limits.
Six small municipalities provide place context without forming one continuous urban block
The county officially lists Carlton, Colbert, Comer, Danielsville, Hull, and Ila as municipalities. County government offices are located in Danielsville, and the UGA Extension office is there as well. These names help orient a reader to the county’s settlement pattern, but none of the municipal boundaries is drawn on the land-cover images.
The southern part of the map has a larger hard-surface footprint than the north, while central and eastern clusters remain smaller and more separated. That pattern is consistent with a county made up of several small towns and unincorporated development rather than one uninterrupted urban area. A specific cluster should still be matched to a verified place layer before a town name is attached to it.
The vegetation view makes the scale of agriculture easier to appreciate
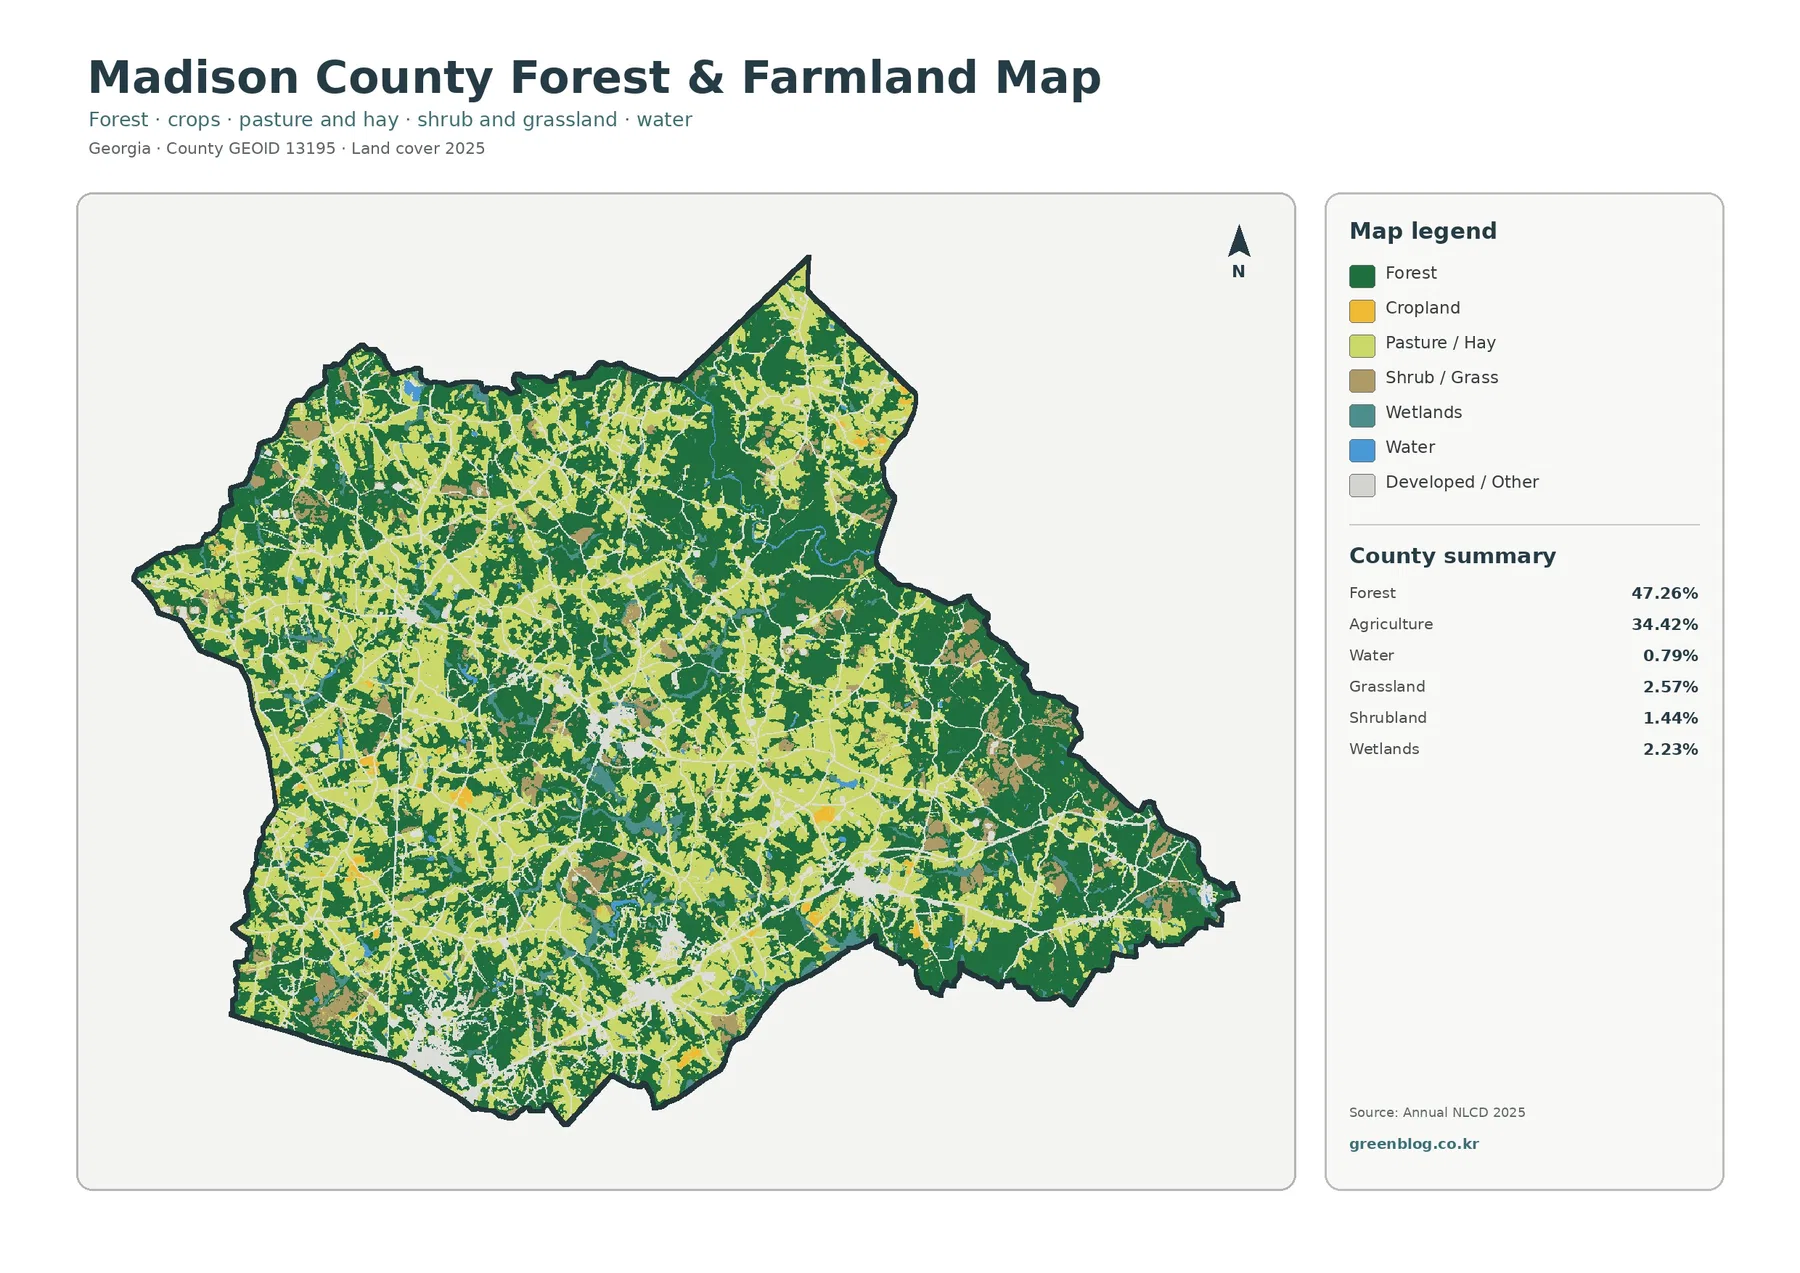
With developed colors removed, agricultural land becomes much more prominent. Yellow fields and light-green pasture or hay areas are widespread in the west, south, and center and remain common farther north. Forest continues to divide them into many smaller blocks. The map makes clear that agriculture is not a minor land use tucked around towns; it is one of the two dominant surface classes.
UGA Extension describes agriculture as Madison County’s leading industry and notes a mix of poultry, cattle, goats, sheep, hay, soybeans, small grains, timber, and smaller vegetable operations. That information matches the county’s large agricultural footprint. The land-cover image cannot identify a specific poultry operation, cattle pasture, soybean field, or timber tract from color alone, however.
Hard surfaces remain concentrated even though developed land reaches 11.24%
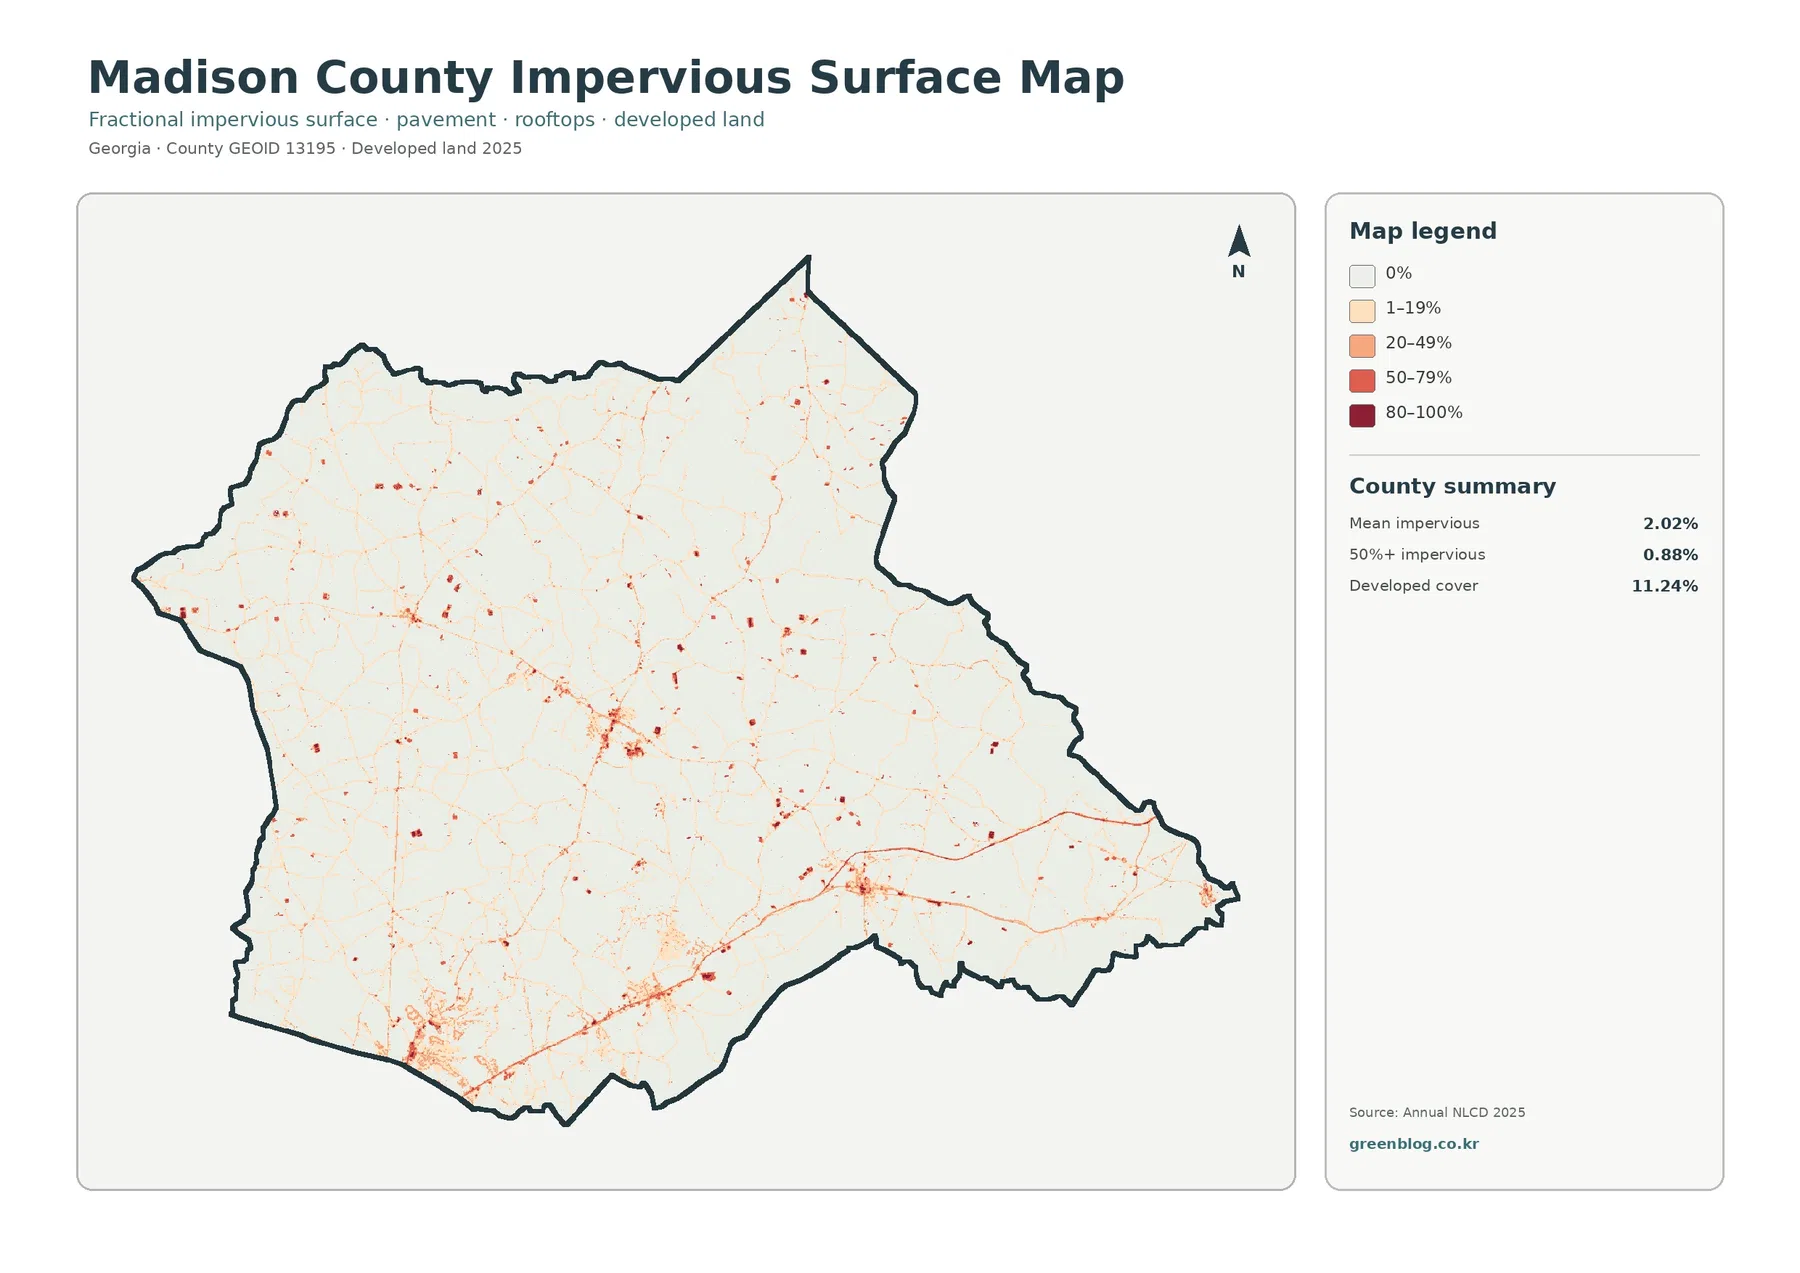
The strongest hard-surface values collect along the southern edge and in several smaller central and eastern clusters. Thin pale lines connect many of these places, while most of the county stays white or nearly white. That contrast shows how dispersed development can occupy more land than the actual roofs and pavement within it.
The countywide mean impervious value is 2.02%, and 0.88% of the county is mapped at 50% impervious surface or more. Those figures are much lower than the 11.24% developed class because yards, trees, lawns, and bare ground can all exist inside developed areas. Fractional impervious cover isolates the harder surfaces that do not readily absorb rainfall.
The narrow high-value lines can resemble a road network, but no road names, lane counts, or traffic volumes are included. The map is best used to compare where pavement and rooftops are concentrated. Named highways, municipal limits, parcel boundaries, and zoning require a separate transportation or local government layer.
The 1985–2025 endpoint difference is spread across the county, not confined to development
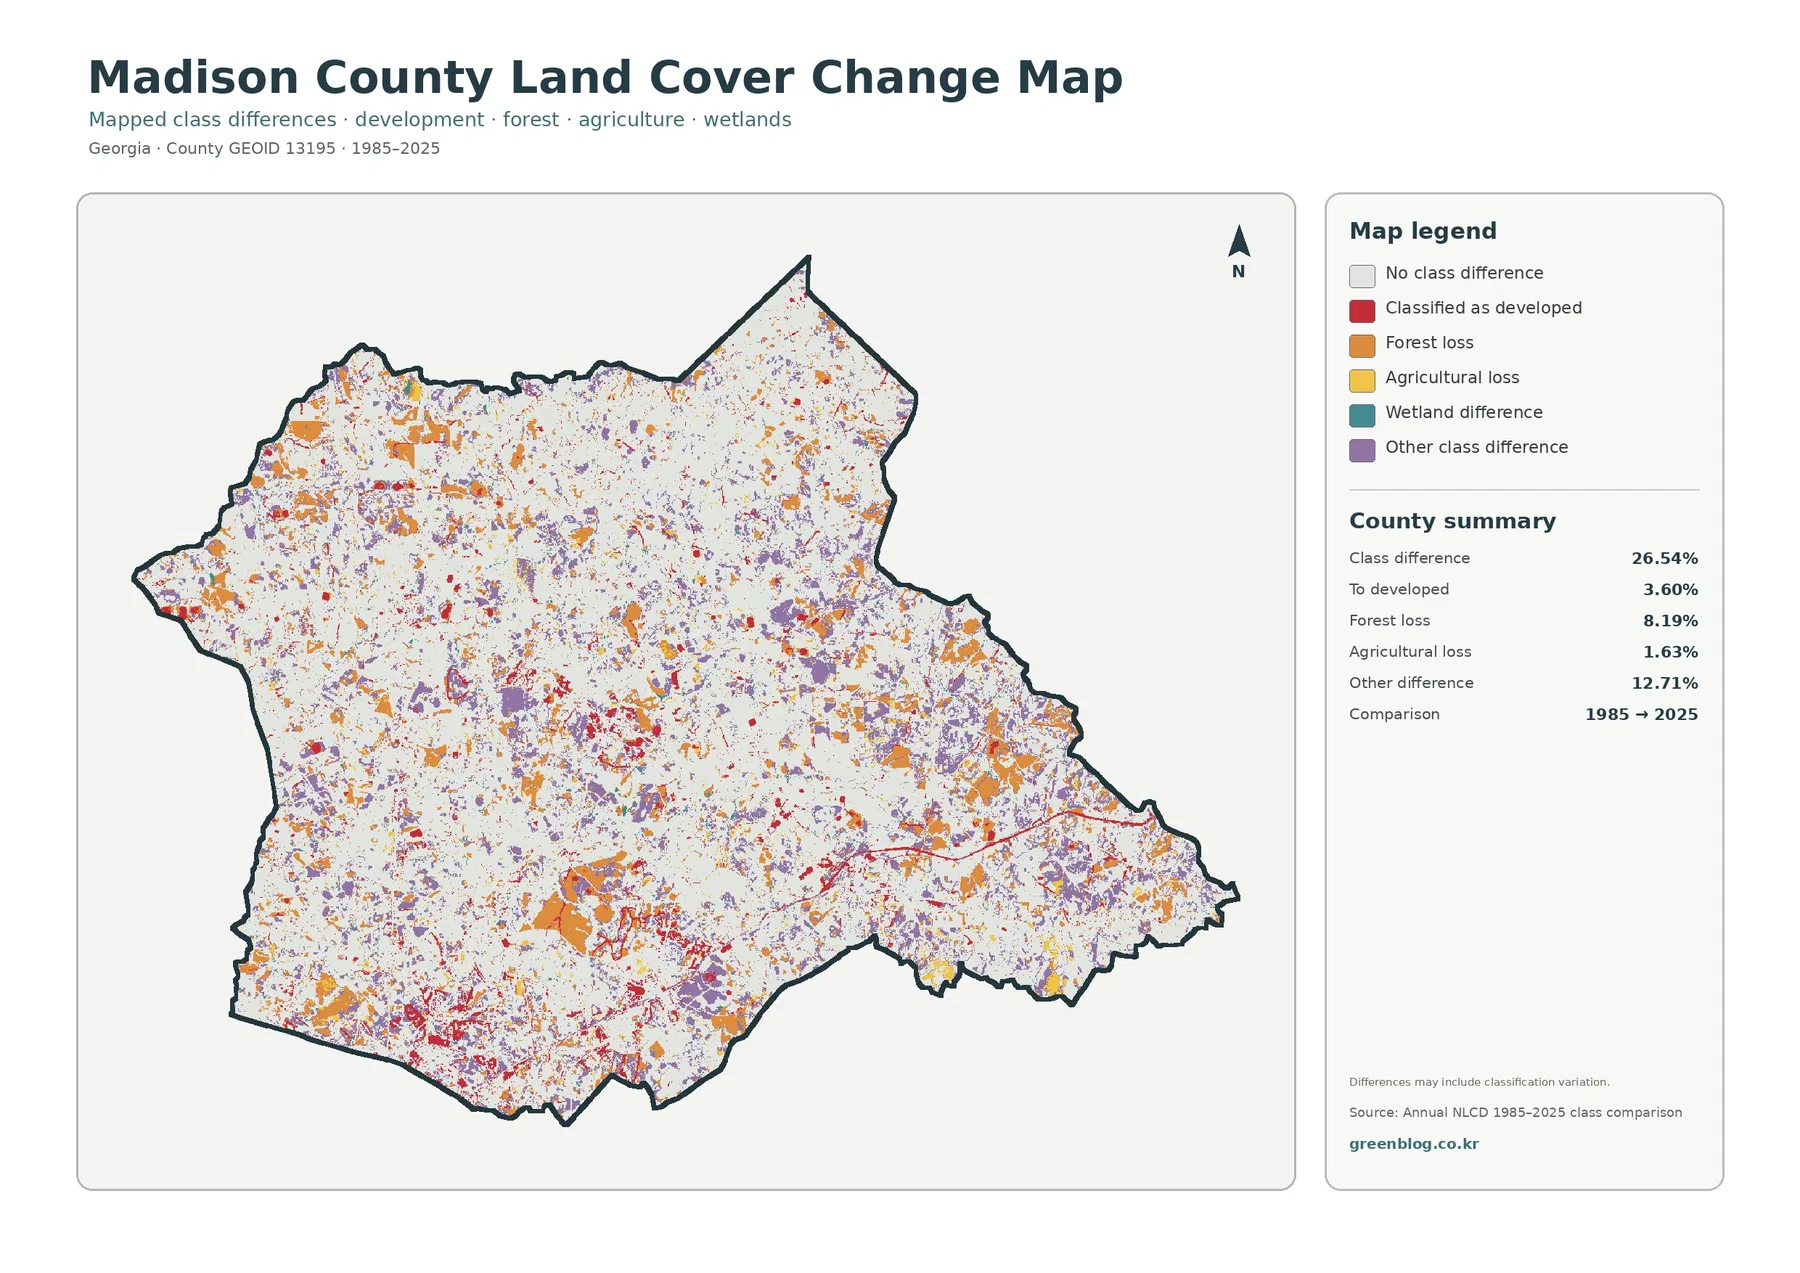
The total class difference between the two endpoints is 26.54%. That number represents cells whose classification differs between 1985 and 2025. It should not be read as a damage percentage or as the amount of land that became urban. Image timing, seasonal appearance, mixed surfaces within one cell, and classification choices can contribute to the result.
The printed summary assigns 3.60% to developed, 8.19% to forest loss, 1.63% to agricultural loss, and 12.71% to other difference. Red developed-change cells are most visible in the south and around several settlement clusters. Orange forest-loss and purple other-difference cells are much more widely distributed, including large sections of the northwest, center, and east.
Wetland difference appears in the legend without its own printed percentage. The missing value should not be calculated by subtraction and presented as an official rate. A forest-loss cell also says nothing about the reason for the change. Timber harvest, development, crop conversion, storms, vegetation recovery, or classification variation require additional evidence.
Frequently Asked Questions
Is forest or agriculture the larger land-cover class in Madison County?
Forest is larger in the supplied 2025 summary at 47.26%, followed by agriculture at 34.42%. The two classes are interwoven across the county rather than separated into large, simple zones.
Why is developed land 11.24% while mean impervious cover is only 2.02%?
Developed classes can include lawns, trees, yards, and bare ground around buildings and roads. The impervious layer measures the harder portion of those areas, such as roofs, pavement, and parking lots.
Does the 26.54% endpoint difference mean that much of the county was damaged?
No. It is the share of cells with different classifications in 1985 and 2025. The summary separately lists 3.60% classified to developed, 8.19% forest loss, 1.63% agricultural loss, and 12.71% other difference.
A practical order for using the four JPG maps
Start with the 2025 land-cover map when the goal is to introduce the county’s forest-farm balance and scattered development. The vegetation view is better for discussing agriculture and woodland without the visual weight of developed classes. Use the impervious map when the question is specifically about roofs and pavement, and save the endpoint map for a separate discussion of 1985–2025 classification differences.
Each original JPG measures 2480 × 1754 pixels. They suit reports, lessons, and presentations; test a proof before a large-format print because the package does not mark them as A3 high-resolution files.
Map File Information
The ZIP contains four original JPG maps for comparing Madison County's 47.26% forest cover, 34.42% agriculture, southern development clusters, impervious surfaces, and 1985–2025 class differences.
- Included Files: Four original JPG land-cover maps
- File Type: JPG files in one ZIP archive
- Intended Use: Printing, education, presentations, and map-based projects
Related Maps
- Appling County Georgia Land Cover Map
- Atkinson County Georgia Land Cover Map
- Bacon County Georgia Land Cover Map
Sources and Reference Data
- MRLC Annual NLCD Data – official access to annual land-cover and comparison products
- USGS Annual NLCD Land Cover Classification – definitions for forest, agriculture, developed land, wetlands, and related classes
- Madison County Government – official context on the county’s rural character and proximity to Athens, Commerce, and Elberton
- Madison County – Municipalities – official listing of Carlton, Colbert, Comer, Danielsville, Hull, and Ila
- Madison County – Planning & Zoning – county comprehensive planning, zoning, subdivision, and development information
- UGA Extension – Madison County – local agriculture context covering poultry, livestock, hay, grains, timber, and other production
Green Map creates custom-edited map images using open geographic data sources such as geoBoundaries, Natural Earth, OpenStreetMap, and government open data. These maps are edited visual materials, not raw data files, and are provided for education, documents, presentations, and graphic reference.