Marion County has a clear forest majority, but the county is far from uniformly wooded. Forest covers 55.05% of the supplied 2025 map, agriculture 15.19%, and grassland 10.21%. Developed land is only 5.58% and is concentrated in a few small centers, with the strongest cluster near the middle-south of the county. This Marion County Georgia Land Cover Map helps compare that compact built footprint with the surrounding forest, fields, and open rural land.
The page includes four WebP views covering current land cover, forest and farmland, impervious surface, and the 1985–2025 endpoint comparison. The four original 2480 × 1754 JPG maps are available together in one ZIP for reports, lessons, county profiles, and presentation graphics.
Table of Contents
Buena Vista is the one place where the hard-surface pattern becomes a clear local center
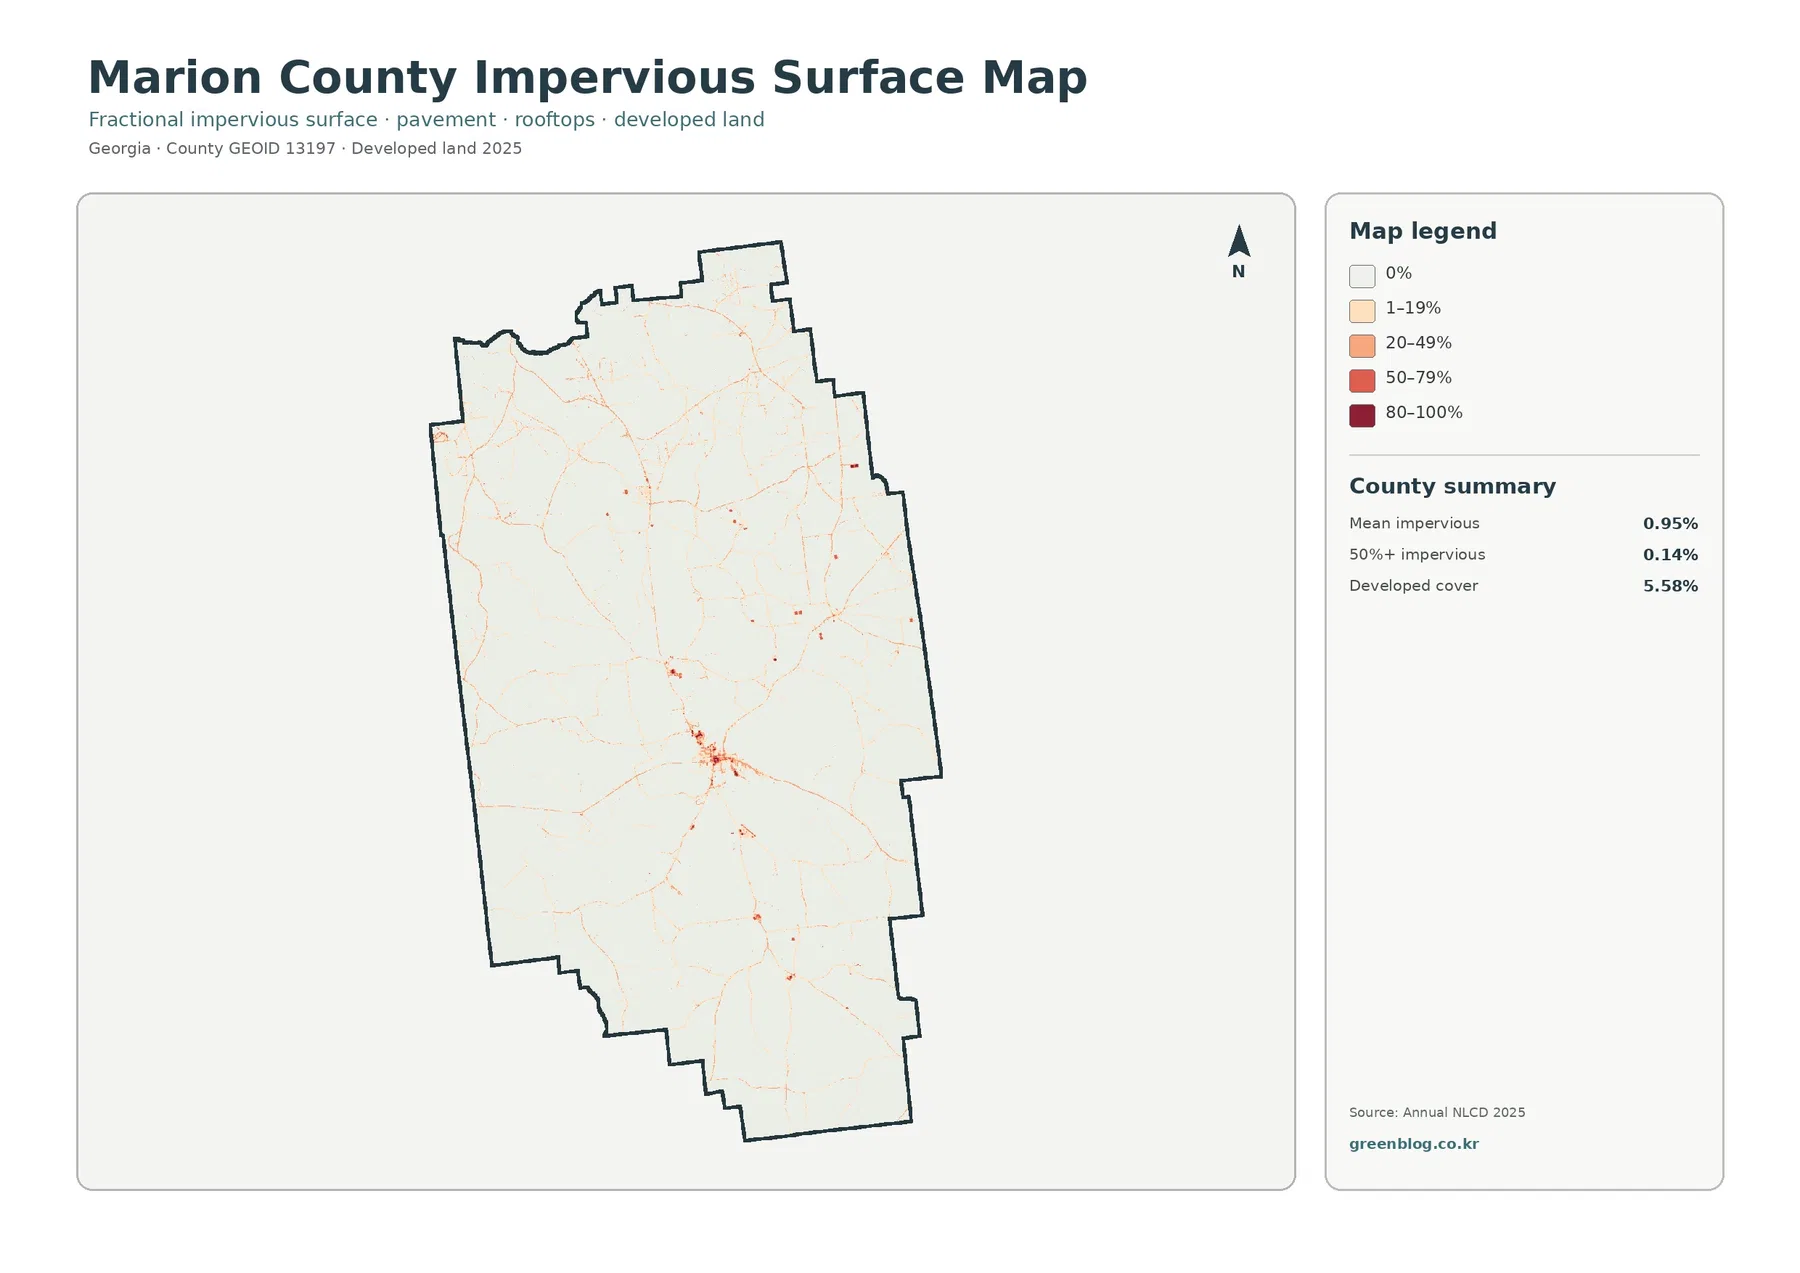
The impervious map is mostly pale, which is the first thing worth noticing. A compact group of darker cells sits south of the county’s midpoint, with thin low-intensity lines extending outward along several corridors. A few isolated red or orange points appear farther north and east, but they remain small. Most of the county has little mapped hard surface.
Marion County identifies Buena Vista as the county seat, and the joint county-city comprehensive plan describes it as the civic, geographic, and economic heart of the community. That makes Buena Vista a useful reference for the largest cluster. The image itself does not draw city limits, so the boundary of the dark cluster should not be treated as the legal boundary of Buena Vista.
Mean impervious cover is 0.95%, and only 0.14% of Marion County reaches 50% impervious surface or more. Developed land covers 5.58%, a broader category that can contain lawns, trees, yards, and bare soil around roads and buildings. The impervious product narrows the question to roofs, pavement, parking areas, and similar hard surfaces.
A 55.05% forest share still leaves room for a varied agricultural landscape
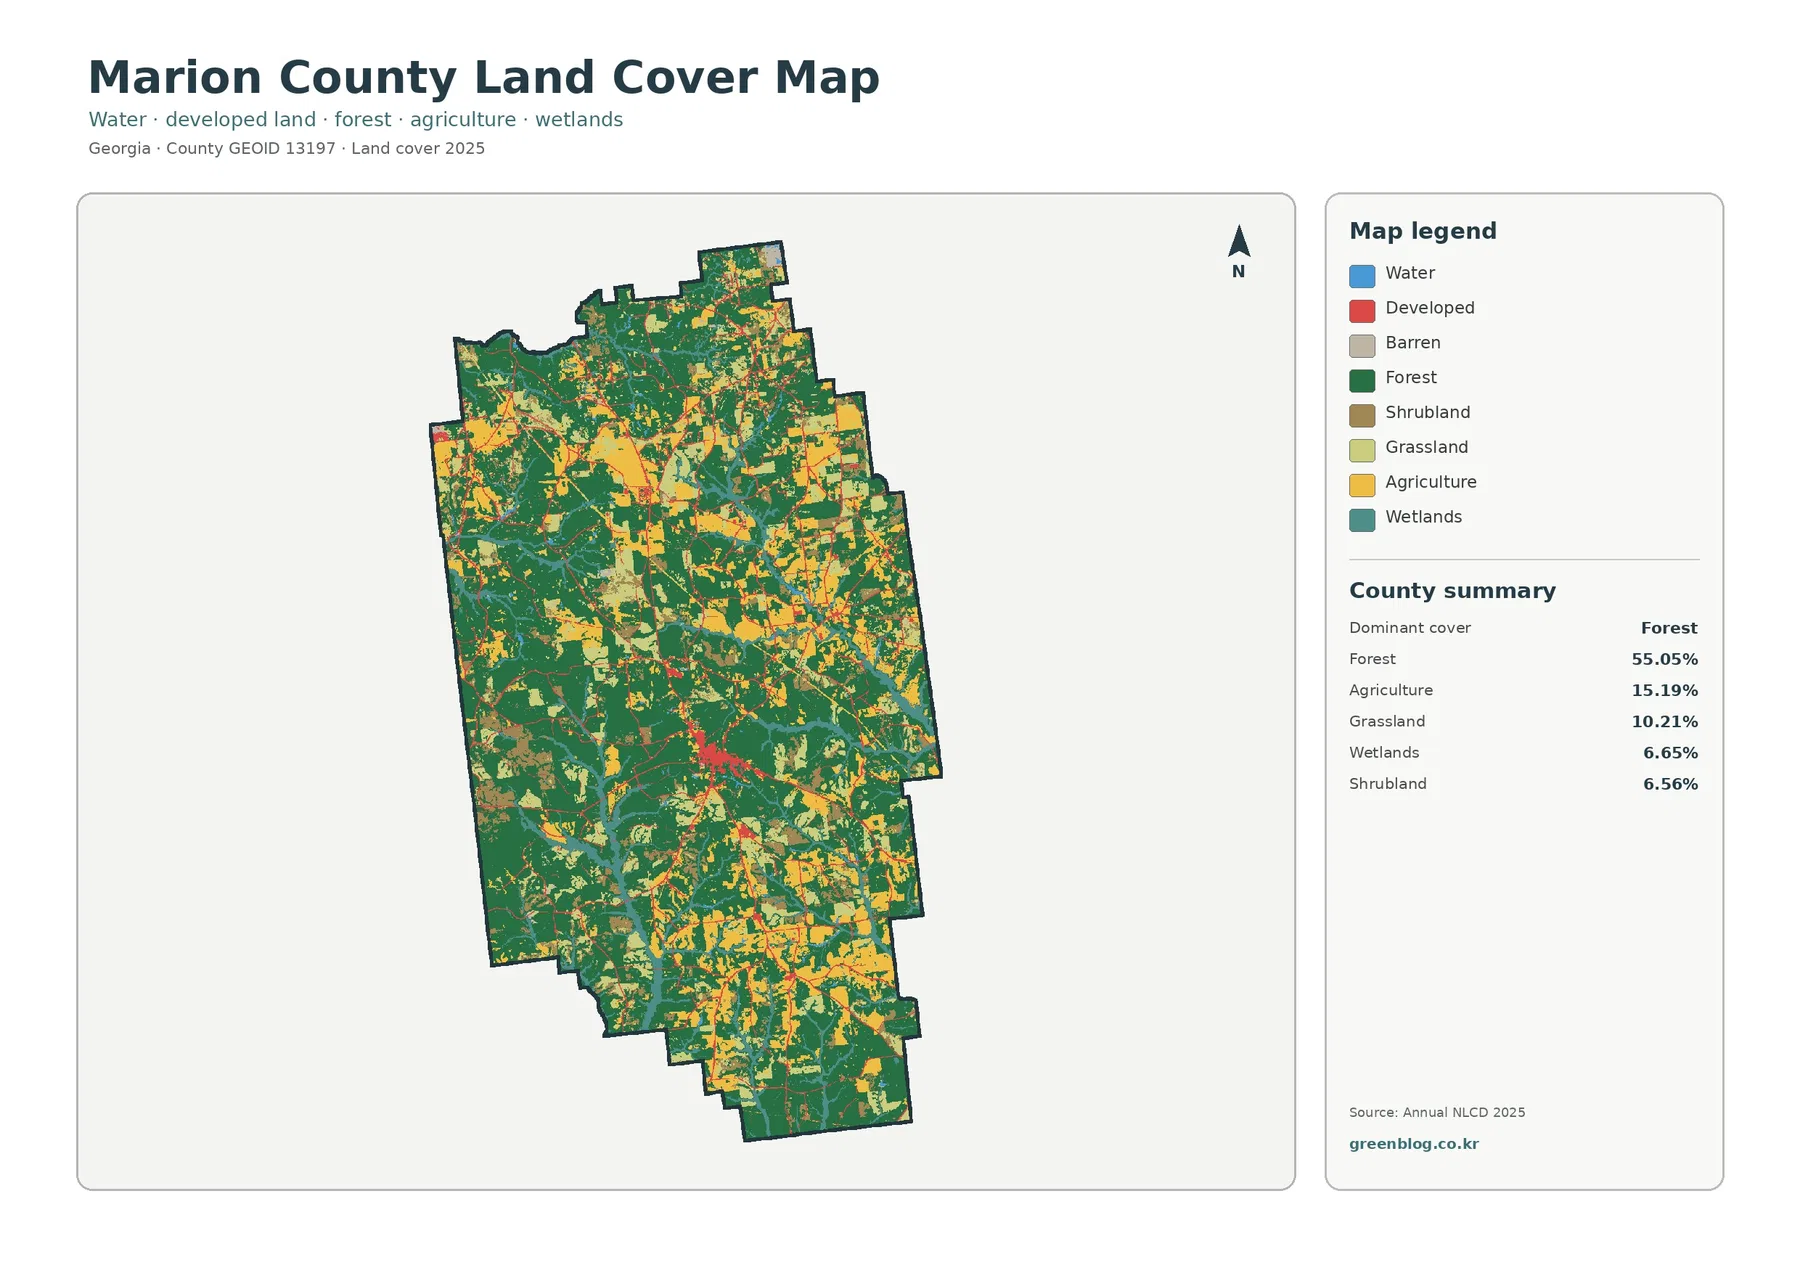
Forest forms the largest continuous blocks in the west, southwest, and several northern sections. Green is also common through the center and east, so agriculture rarely sits far from wooded land. The 55.05% forest figure describes a county in which woodland is the background surface, while fields, grass, settlement, and wet areas break that background into a patchwork.
Agriculture covers 15.19%. Yellow areas are particularly common in the east and southeast and appear again in smaller northern and central groups. Grassland is another substantial open class at 10.21%, often occupying the spaces between farms and woods. Taken together, the two open-land classes make the eastern half look noticeably more varied than the forest-heavy west.
Wetlands account for 6.65% and shrubland 6.56%. Wetland color forms narrow bands and broader patches through the west and center, while shrubland appears around forest edges and other open areas. Open water is only 0.40% in the vegetation-focused summary, so teal wetland cells should not be called lakes or rivers simply because they are associated with wetter ground.
The vegetation map makes Marion County’s working fields easier to separate from pasture and forest
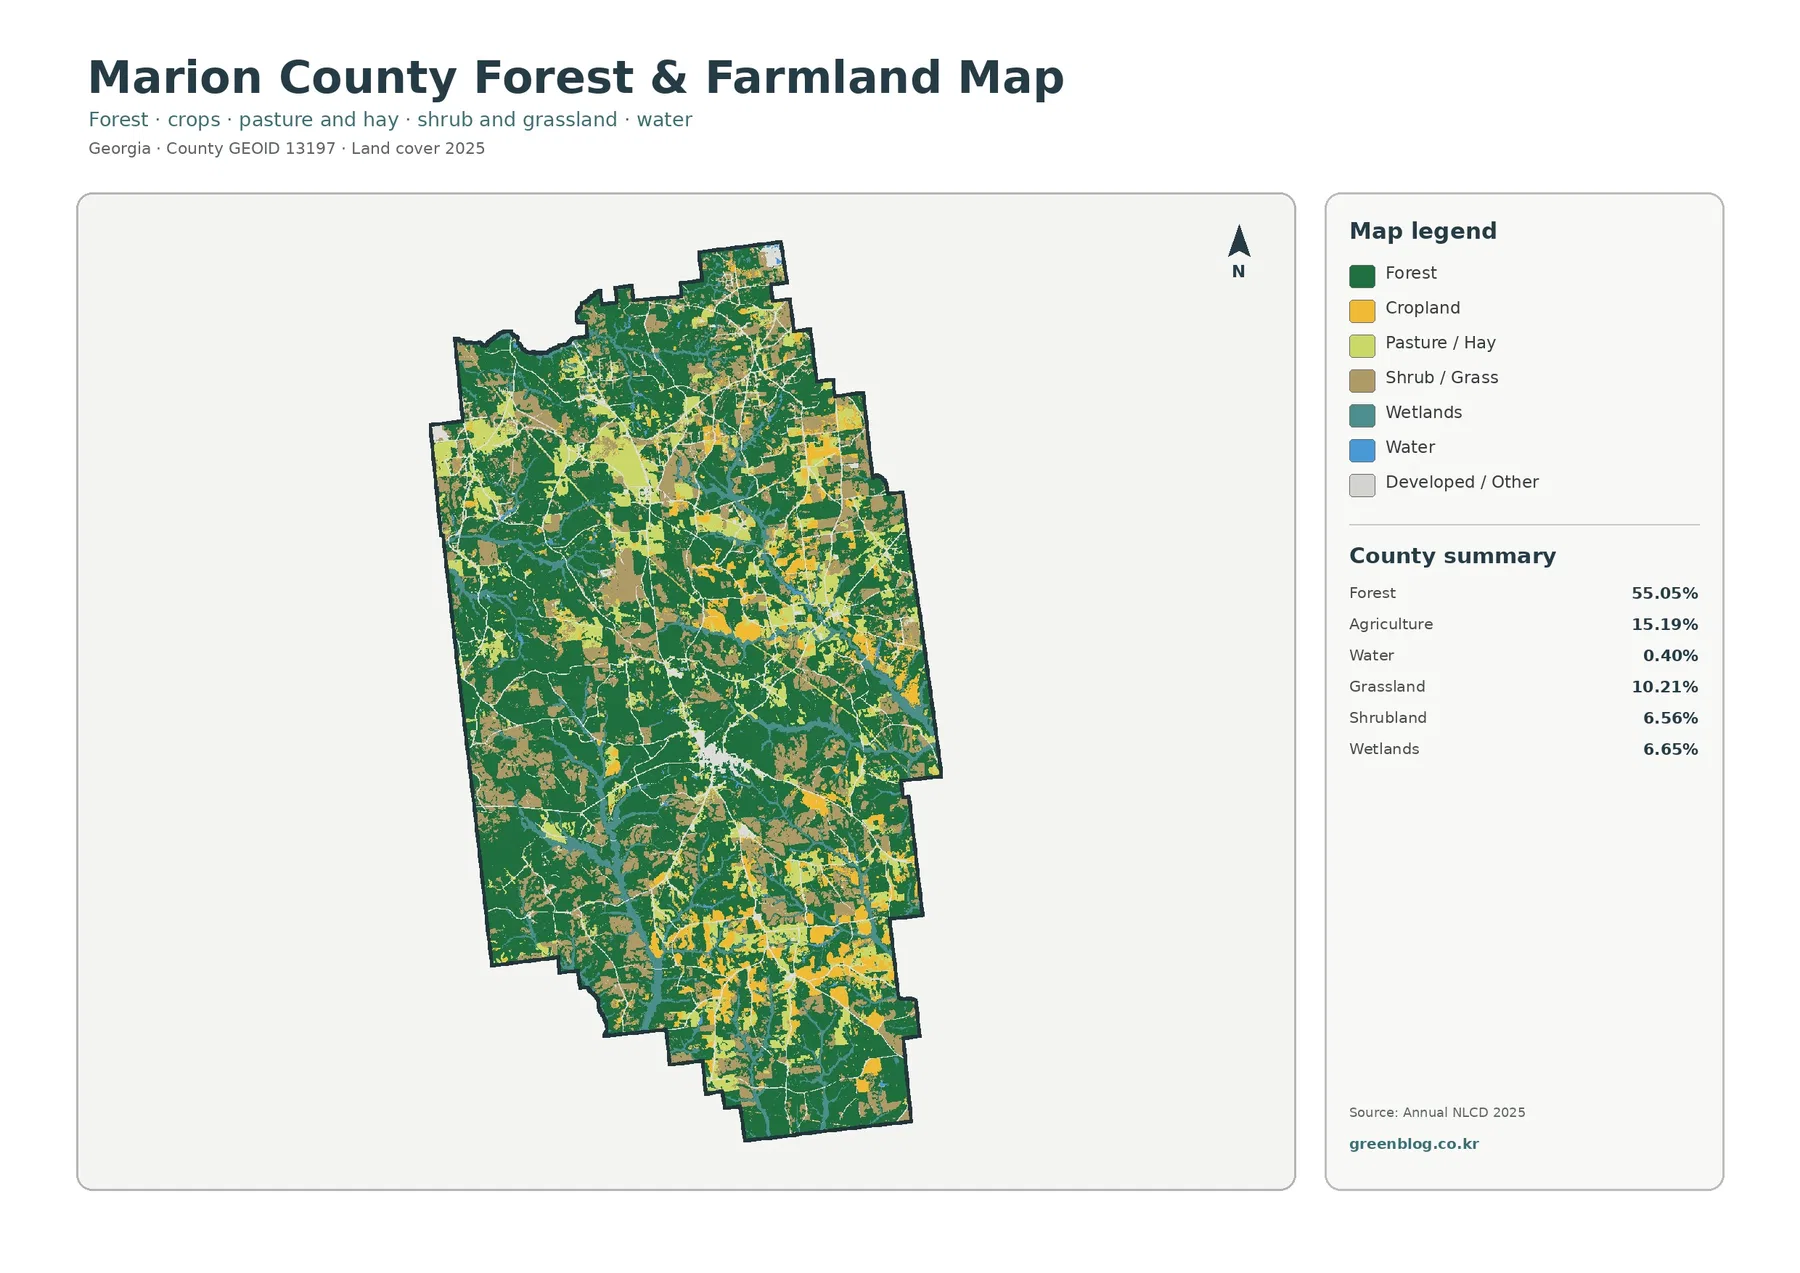
Removing the developed class makes the difference between the western forest blocks and the more open east much easier to see. Cropland appears in yellow, while pasture and hay are shown separately in a lighter green. The two kinds of open agricultural surface often sit beside one another, but forest repeatedly cuts through them. There is no single uninterrupted farm belt.
UGA Extension’s recent Marion County impact report gives this pattern a useful local context. It describes corn, cotton, and peanut production, including roughly 900 acres of corn, about 1,400 acres of cotton, and more than 800 acres of peanuts in the cited production year. Those figures confirm that row-crop farming matters locally, but the land-cover colors do not identify which crop occupies any particular field.
Grassland at 10.21% is also too large to treat as a minor leftover category. Some of those open cells may occur in pasture, hay, or other grass-dominated land, but the raster does not document management or ownership. A broad surface class is useful for county pattern comparison and should not be converted into a parcel-level land-use statement.
The 1985–2025 comparison is visually busy because nearly half the cells have different endpoint labels
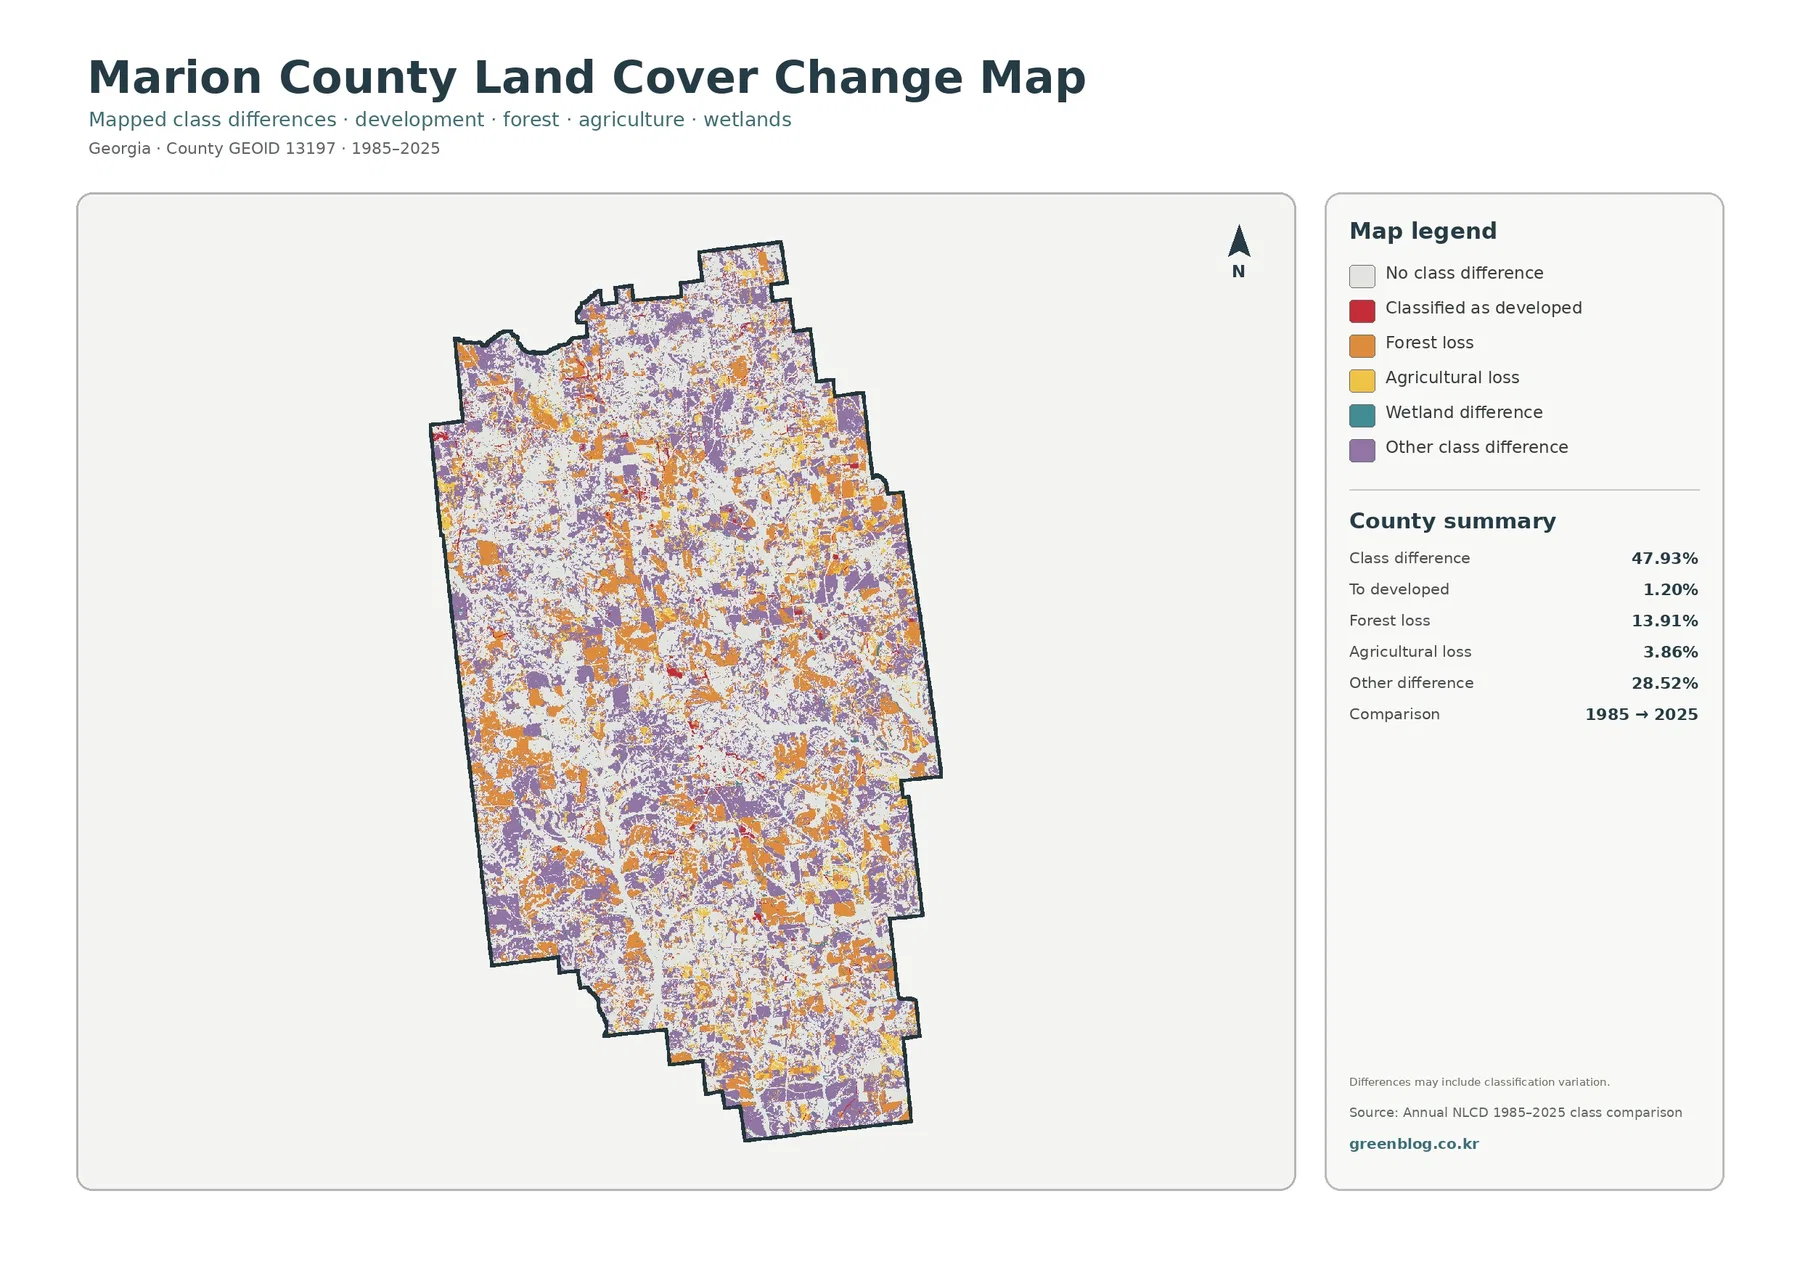
The total class difference is 47.93%, which makes this map much more colorful than the current land-cover view. That number is the share of raster cells whose category differs between 1985 and 2025. It is not a claim that nearly half of Marion County was cleared, degraded, or urbanized. The map itself warns that classification variation can be part of the result.
The printed summary assigns 1.20% to developed, 13.91% to forest loss, 3.86% to agricultural loss, and 28.52% to other difference. Red developed-change cells remain concentrated near the small settlement centers. Orange forest-loss and purple other-difference cells are scattered far more widely, including broad sections of the west, north, east, and south.
Wetland difference is included in the legend without its own printed percentage. The missing rate should not be invented by subtracting the listed categories from the total. The labels also do not establish a cause. A forest cell can receive another classification for many reasons, and intermediate imagery or local records are needed before attributing a change to harvesting, development, agriculture, storms, or classification variation.
Small towns, farm production, and land-cover classes describe different parts of the county story
Annual NLCD uses 30-meter raster cells. A single cell can contain trees, a field edge, grass, a building, and a road even though it receives one predominant class. Narrow streams, small ponds, thin tree rows, and isolated structures may therefore be generalized when viewed at county scale.
A simple map order works well for a report or classroom presentation
Begin with the 2025 countywide map to establish the forest majority and the eastern farm-and-grass pattern. Use the vegetation view when the distinction among forest, cropland, pasture, and wetlands is the main subject. The impervious map is the clearest option for discussing Buena Vista’s compact hard-surface center, while the endpoint map belongs in a separate discussion of long-term classification differences.
Frequently Asked Questions
What is the largest land-cover class in Marion County?
Forest is the largest class in the supplied 2025 summary at 55.05%. Agriculture follows at 15.19% and grassland at 10.21%, giving the county a forest-majority landscape with substantial open rural land.
Why is developed land 5.58% while mean impervious cover is only 0.95%?
Developed classes can include lawns, trees, yards, and bare soil around buildings and roads. The impervious layer focuses only on harder surfaces such as roofs, pavement, and parking areas, so its countywide average is much lower.
Does the 47.93% endpoint difference mean almost half the county was damaged?
No. It is the share of cells with different classifications in 1985 and 2025. The summary separately lists 1.20% classified to developed, 13.91% forest loss, 3.86% agricultural loss, and 28.52% other difference.
Sources and Reference Data
- MRLC Annual NLCD Data – official access to annual land-cover and comparison products
- USGS Annual NLCD Land Cover Classification – definitions for forest, agriculture, grassland, developed land, wetlands, and related classes
- U.S. Census Bureau TIGER/Line Shapefiles – authoritative county, place, and transportation layers for comparison
- Marion County – About Marion County – official county background identifying Buena Vista as the county seat
- Marion County & Buena Vista Comprehensive Plan – local planning context describing Buena Vista as the community’s civic, geographic, and economic center
- UGA Extension – Marion County Impact – recent local context for corn, cotton, peanut production, irrigation, and harvest management
Map File Information
The ZIP contains four original JPG maps for comparing Marion County's 55.05% forest cover, agricultural and grassland openings, Buena Vista-area development, impervious surfaces, and 1985–2025 class differences.
- Included Files: Four original JPG land-cover maps
- File Type: JPG files in one ZIP archive
- Intended Use: Printing, education, presentations, and map-based projects
Related Maps
- Appling County Georgia Land Cover Map
- Atkinson County Georgia Land Cover Map
- Bacon County Georgia Land Cover Map
Green Map creates custom-edited map images using open geographic data sources such as geoBoundaries, Natural Earth, OpenStreetMap, and government open data. These maps are edited visual materials, not raw data files, and are provided for education, documents, presentations, and graphic reference.