McDuffie County is more than half forest in the supplied 2025 data, yet its central built area is easy to pick out. Forest covers 50.88%, agriculture 15.62%, and developed land 10.68%. A broad cluster of development and hard surfaces sits near the center around Thomson, while fields, woods, wetlands, and smaller settlements fill the rest of the county. This McDuffie County Georgia Land Cover Map compares those contrasts across four related views.
The page includes a current land-cover map, a vegetation-focused version, an impervious-surface map, and a 1985–2025 endpoint comparison. The four original 2480 × 1754 JPG maps are available together in one ZIP for reports, lessons, county profiles, and presentation graphics.
Table of Contents
Thomson’s hard-surface footprint stands out before any other built area
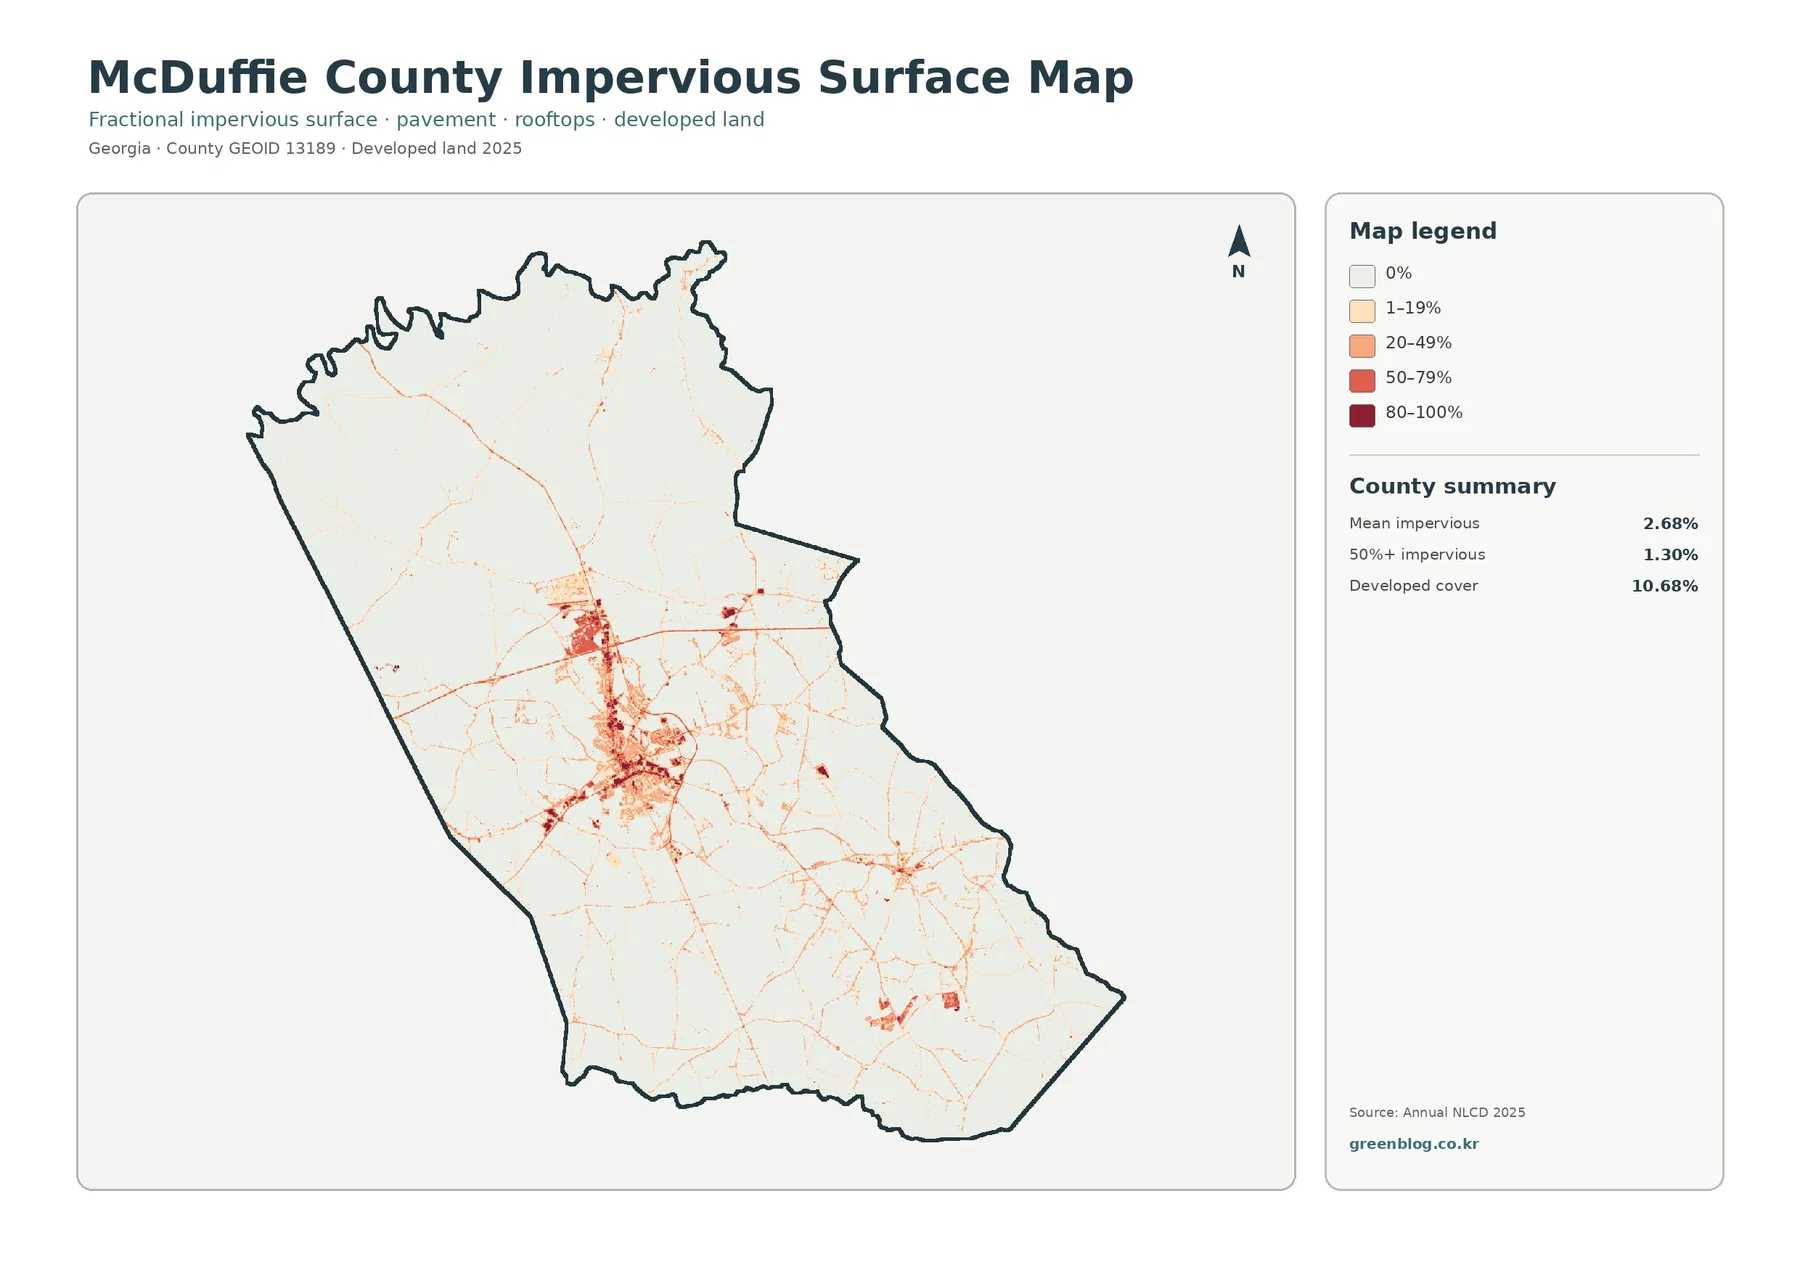
The darkest impervious values form a compact center in the middle of the county, with several branches extending away along road-shaped corridors. A second, smaller concentration appears east of the main cluster, and another built pocket is visible toward the southeast. Most of the north, west, and outer south remains pale, showing how quickly hard surfaces give way to rural land.
Thomson is the county seat, according to McDuffie County’s official materials, and county offices are located there. That makes the city a useful reference for the largest cluster. The image does not draw municipal limits, so the hard-surface footprint should not be treated as the legal boundary of Thomson.
The countywide mean impervious value is 2.68%, and 1.30% of McDuffie County is mapped at 50% impervious surface or higher. Developed land is 10.68%, which includes more than roofs and pavement. Yards, lawns, trees, and exposed soil can all occur inside developed classes, while the impervious layer narrows the view to surfaces that resist water infiltration.
Forest remains the dominant cover even around the county’s farm and settlement network
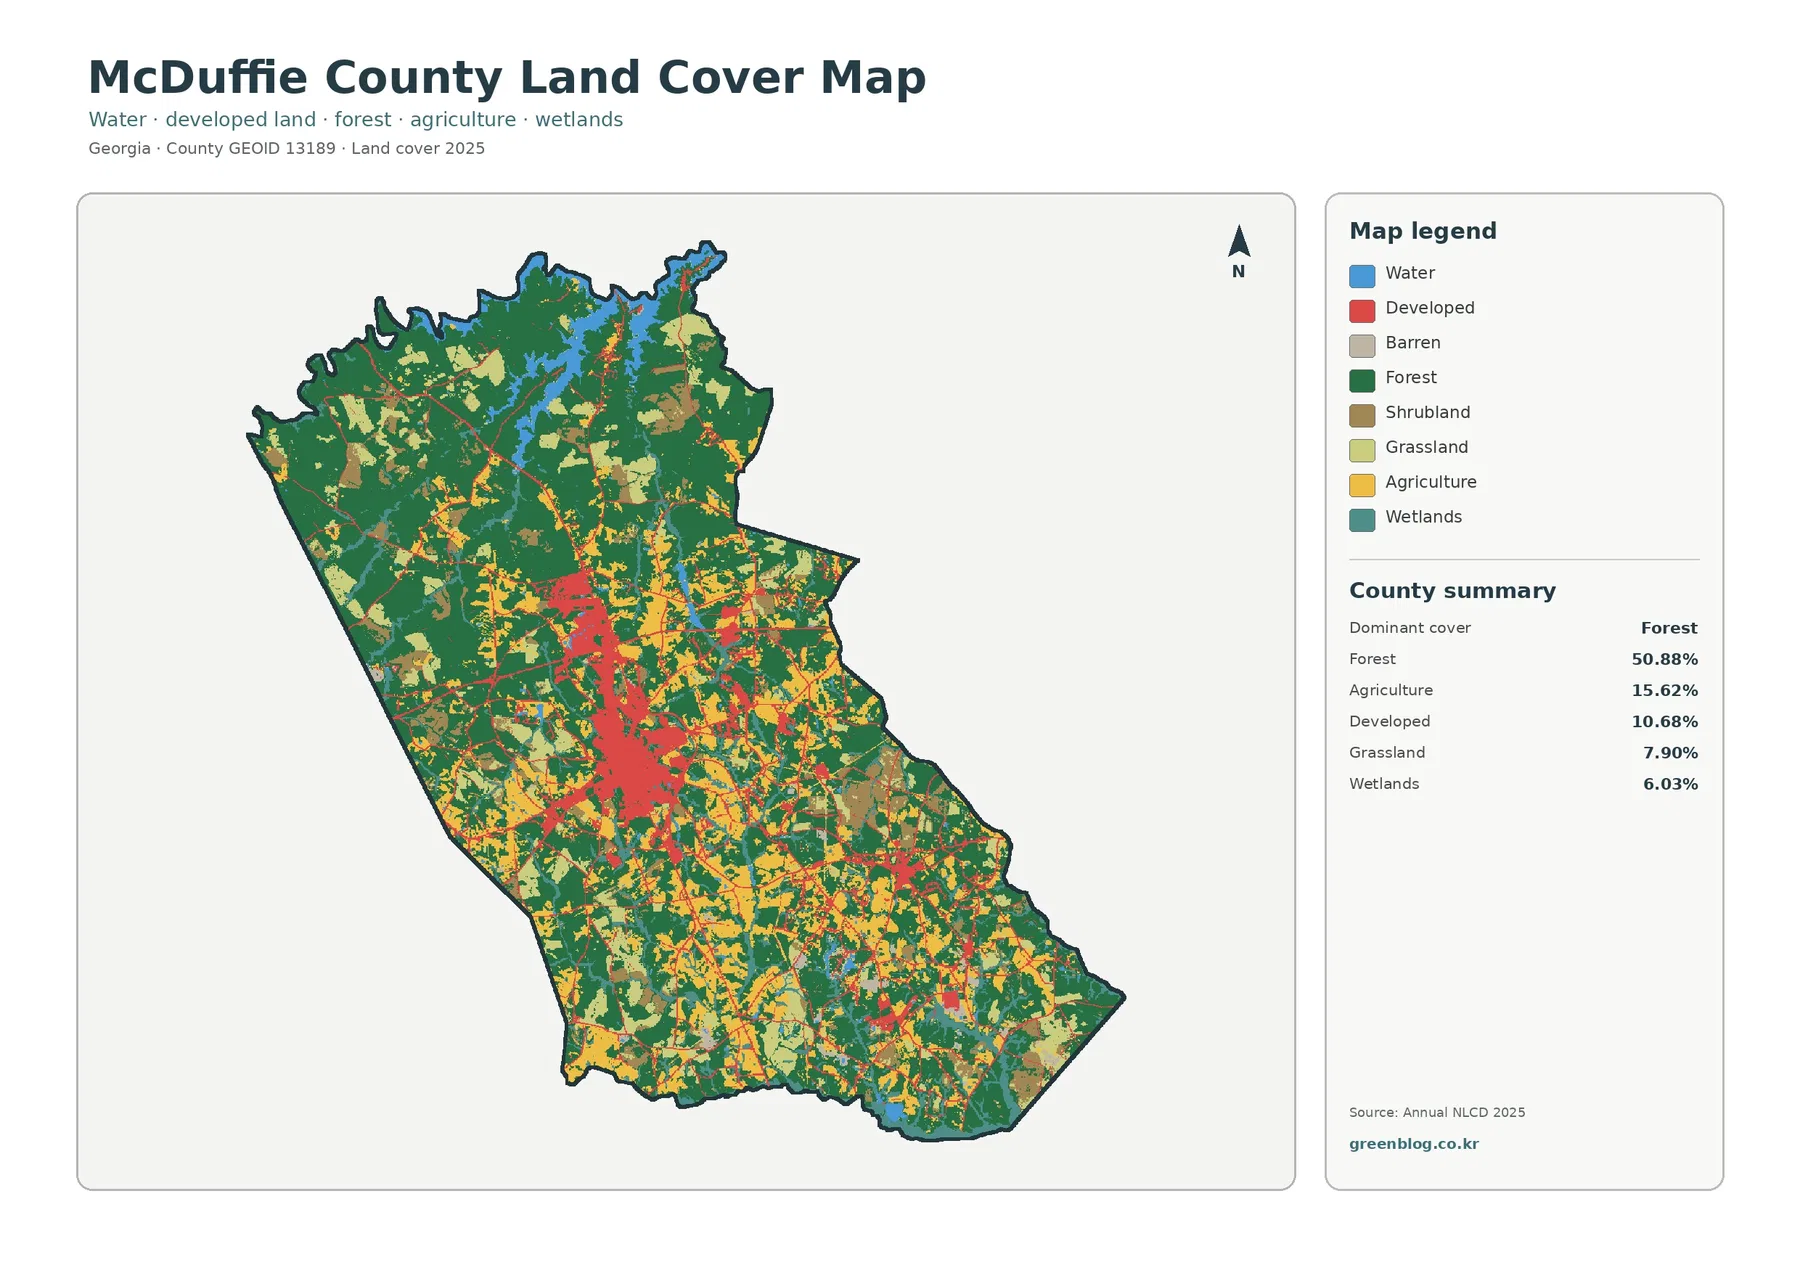
Forest covers 50.88%, and the map shows large green blocks across the northwest, north, east, and much of the outer county. The central section is more mixed because agriculture and development occupy a larger share there. Even so, woodland repeatedly appears between fields, homes, and road corridors, so the county does not separate cleanly into an urban center and a solid rural ring.
Agriculture accounts for 15.62%. Yellow farm areas are common in the center, south, and east, with smaller patches farther northwest. Grassland adds 7.90% and shrubland 5.40%, creating a variety of open rural surfaces around farms and forest edges. Developed land at 10.68% remains concentrated enough that its red color is visually stronger than its countywide percentage might suggest.
Wetlands cover 6.03%, while open water is 2.90% in the vegetation summary. The north-central portion contains one of the clearest water-and-wetland combinations, with smaller wet features elsewhere. Blue water and teal wetlands should be read separately: one represents exposed water, while the other can include wet soils and vegetation.
The vegetation map separates cropland from grassier open land around the central county
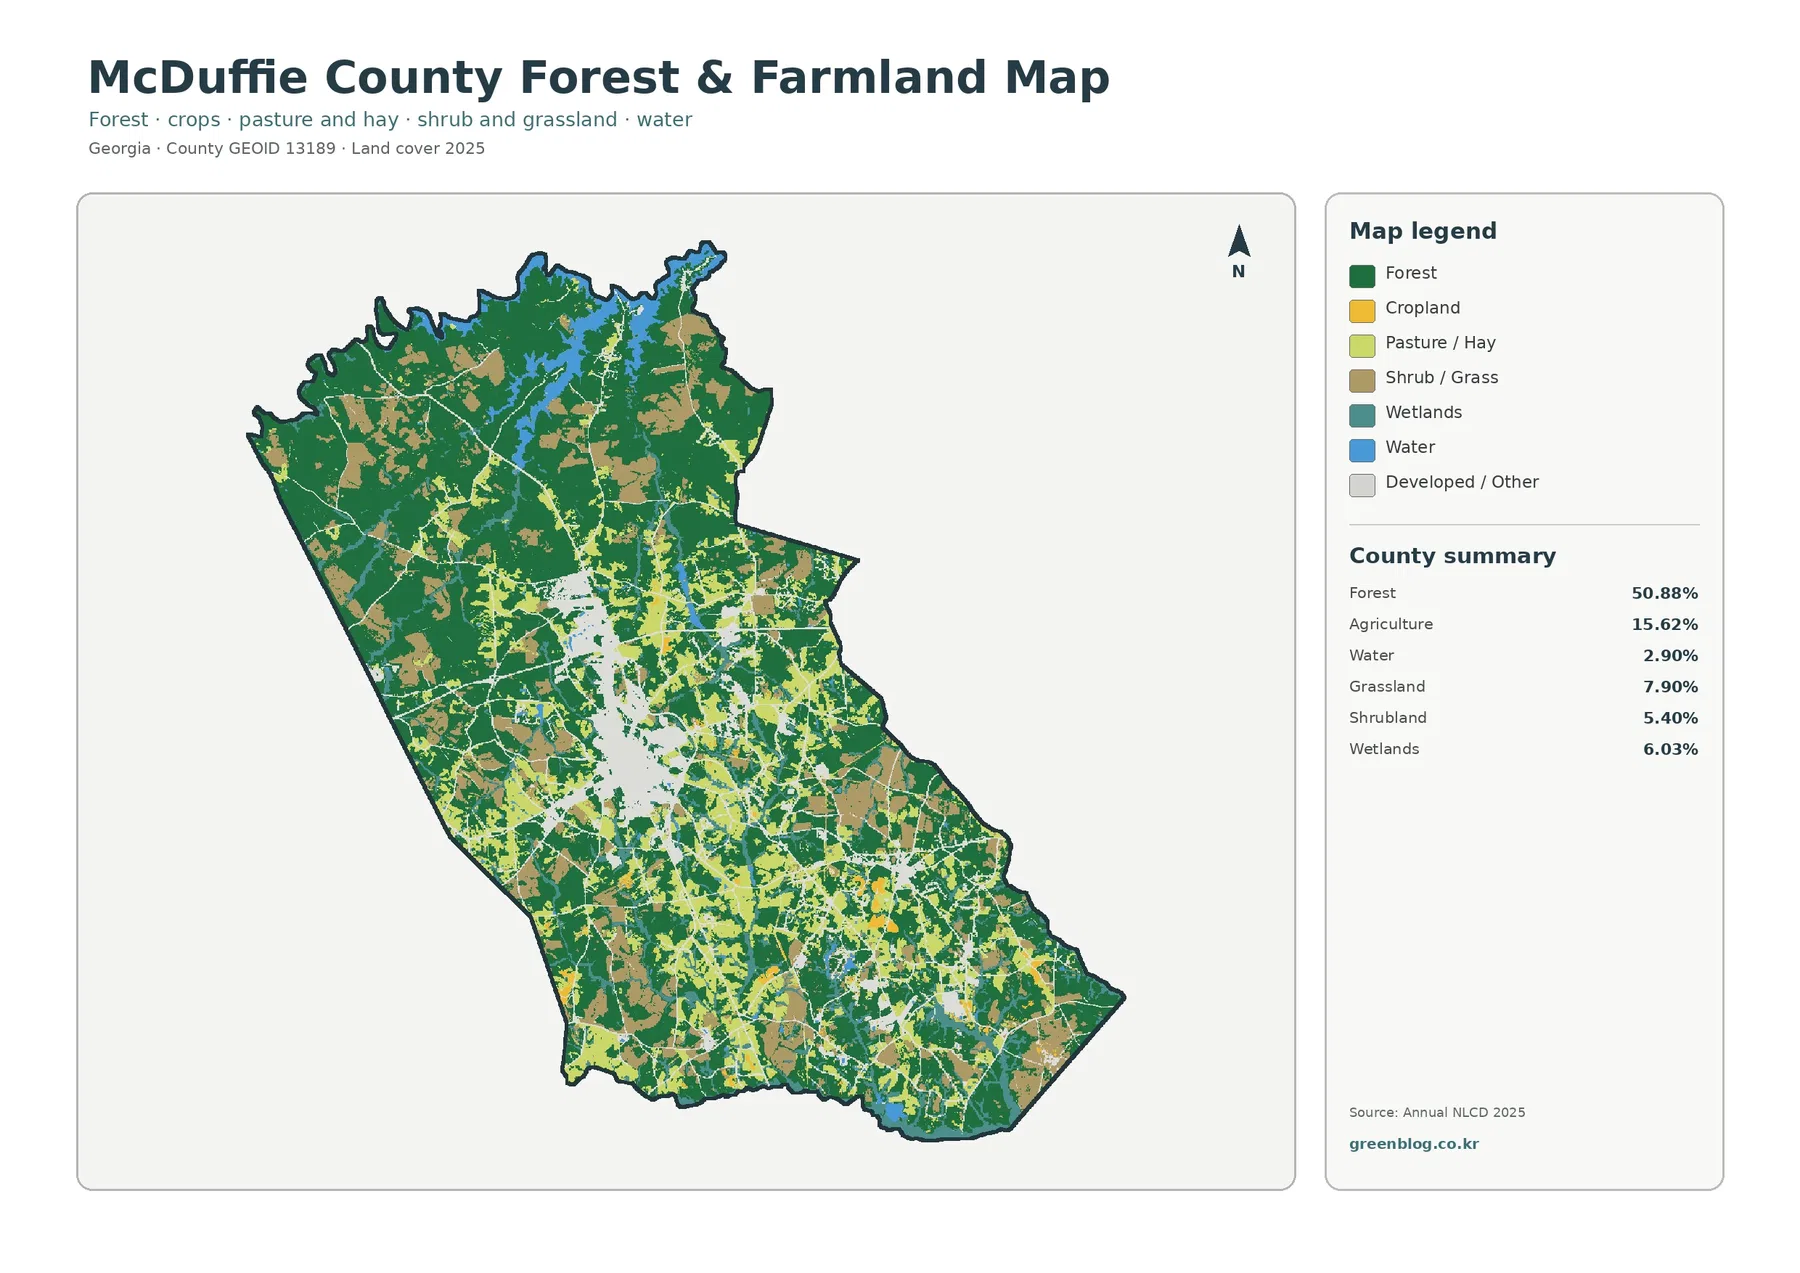
Removing the strong developed color makes the rural mix around Thomson much easier to see. Cropland is most frequent through the center and southern half, while pasture or hay and shrub-grass areas fill many of the gaps between fields and forest. The north and northwest remain more heavily wooded, although smaller open patches occur there as well.
UGA Extension’s McDuffie County office offers agriculture and natural-resource support covering soil health, forage management, pest control, production practices, and water-related topics. That local role supports the use of this map for broad farm and land-management context. It does not provide a basis for naming a yellow cell as a particular crop or a light-green area as a specific pasture.
Thomson and Dearing provide place context, but the raster does not draw town limits
Official county materials identify Thomson and Dearing as McDuffie County’s two incorporated municipalities. The central development concentration fits the Thomson context, while a smaller southeastern cluster can be compared with the broader Dearing area. Those place names help a reader orient to the map, but the surface classification does not identify where one municipality begins or ends.
The Georgia Department of Community Affairs maintains a joint comprehensive plan for McDuffie County, Dearing, and Thomson. Planning documents deal with land use, growth, community facilities, and development policy. The land-cover maps answer a different question: what kind of surface was classified at each raster cell in the observation year.
The 1985–2025 comparison spreads far beyond the developed core
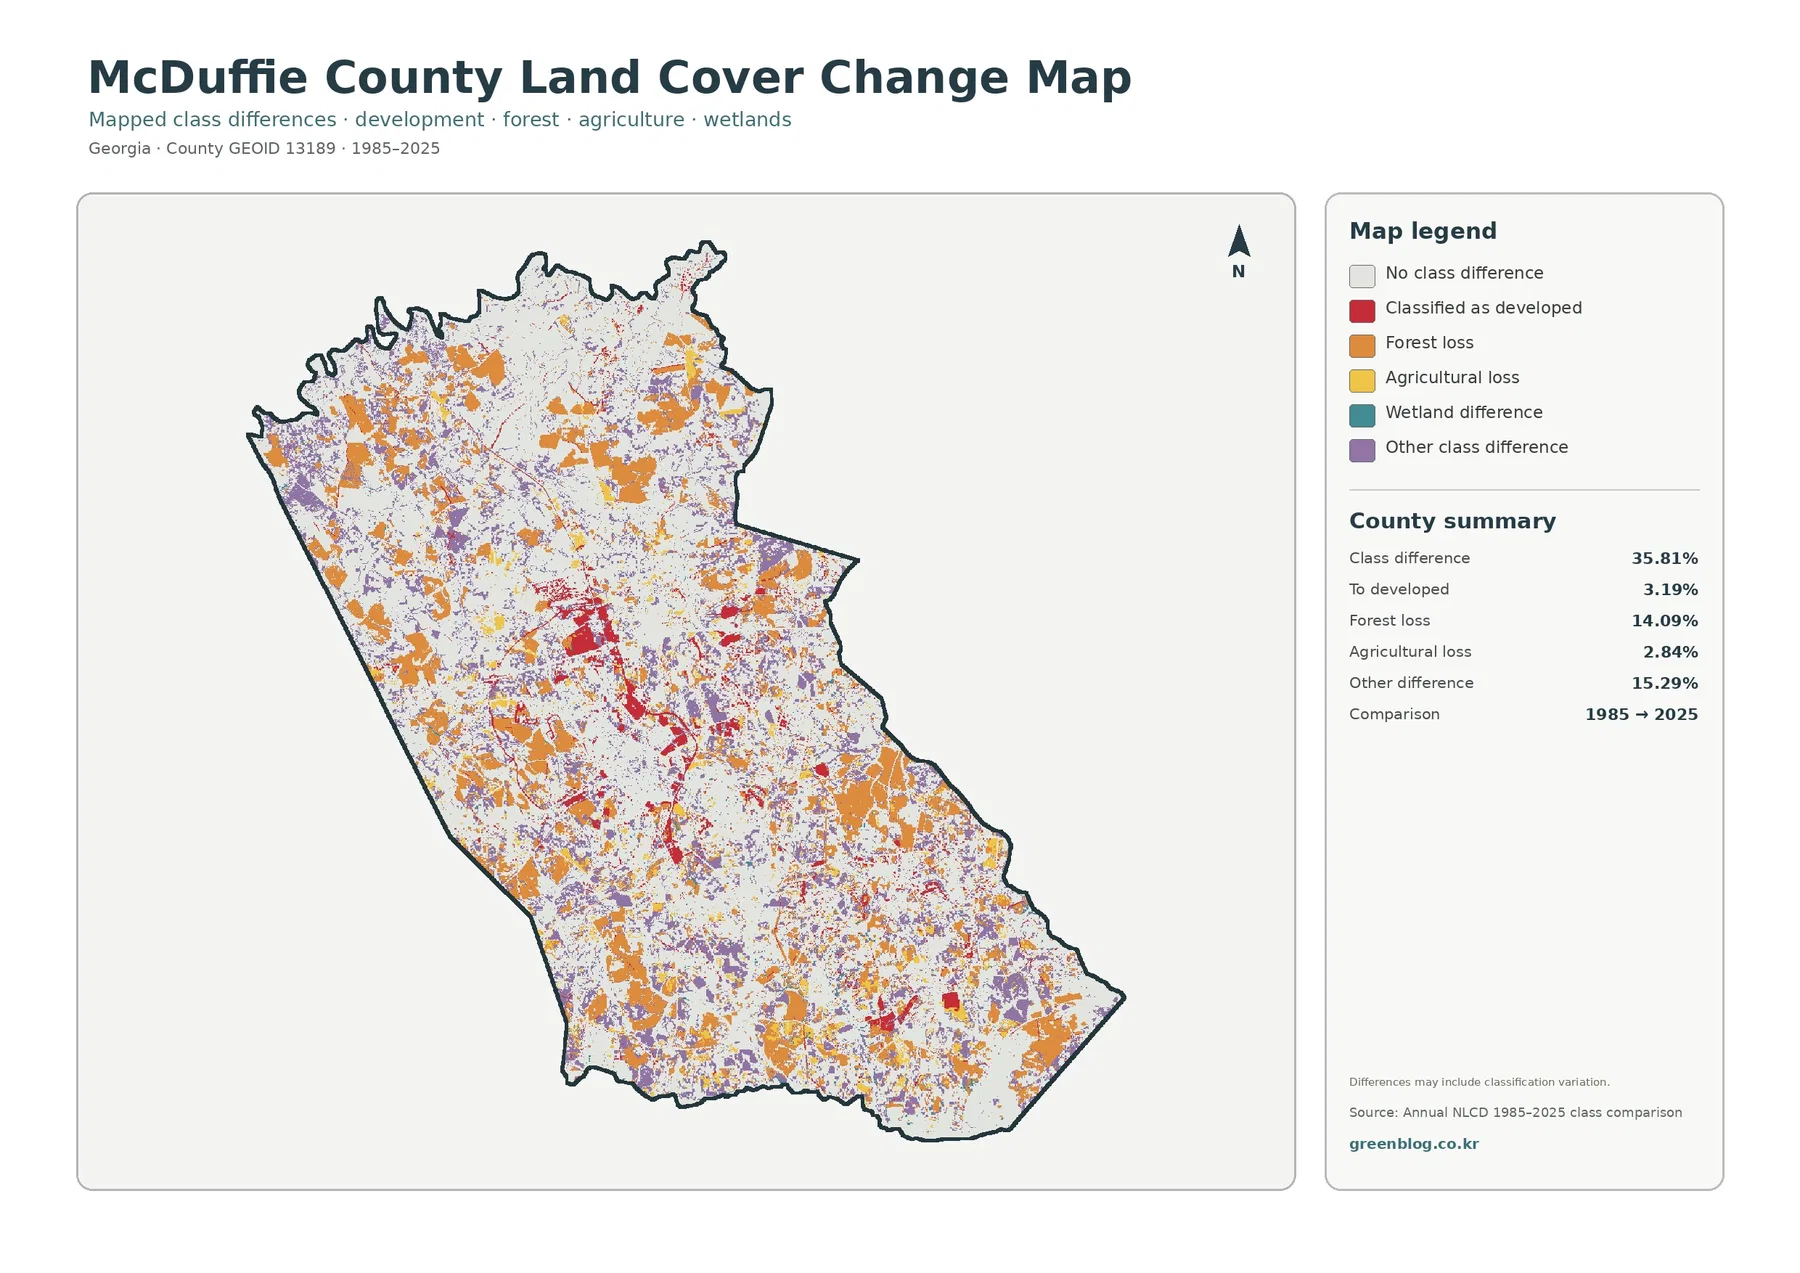
The total endpoint class difference is 35.81%. That figure counts raster cells assigned different categories in 1985 and 2025. It is not an urbanization rate and should not be interpreted as the share of McDuffie County that was damaged, cleared, or permanently converted. The map itself notes that classification variation may be part of the result.
The printed summary lists 3.19% classified to developed, 14.09% forest loss, 2.84% agricultural loss, and 15.29% other difference. Red developed-change cells cluster most strongly around the central settlement network. Orange forest-loss and purple other-difference cells are much more widespread, reaching the north, west, east, and south.
Wetland difference is shown in the legend without its own printed percentage. The missing rate should not be reconstructed by subtraction and presented as an official value. A forest-loss cell also does not identify cause; timber activity, development, storms, vegetation recovery, or classification variation require intermediate imagery or other evidence.
Thirty-meter pixels are strong for county patterns but weak for exact site decisions
Annual NLCD uses 30-meter raster cells. Small ponds, narrow streams, thin tree rows, isolated homes, and field edges may be generalized because several real surfaces can share one cell. The maps work best for comparing broad patterns rather than measuring precise boundaries.
When a decision depends on property lines, zoning, road rights-of-way, permits, or a regulatory wetland boundary, use current county or state records instead of the land-cover colors. These maps are a starting point for context, not a substitute for a survey or legal map.
Use the four-map set by starting broad and then narrowing the question
The countywide view is the best starting image for explaining McDuffie County’s 50.88% forest share and the location of farms, development, water, and wetlands. Move to the vegetation map when fields and open rural cover are the focus. The impervious map is better for Thomson-area roofs and pavement, while the endpoint map belongs in a separate discussion of 1985–2025 classification differences.
Each JPG measures 2480 × 1754 pixels and works well for reports, lessons, and presentations. Test a proof before large-format printing because the package does not mark the files as A3 high-resolution assets.
Frequently Asked Questions
What is the largest land-cover class in McDuffie County?
Forest is the largest class in the supplied 2025 summary at 50.88%. Agriculture follows at 15.62% and developed land at 10.68%, so woodland remains the dominant surface even around the county’s central settlement network.
Why is developed land 10.68% while mean impervious cover is only 2.68%?
Developed classes can include trees, lawns, yards, and exposed soil around roads and buildings. The impervious layer focuses on the harder portion of those areas, including roofs, pavement, and parking surfaces.
Does the 35.81% endpoint difference mean more than one-third of the county was damaged?
No. It is the share of cells with different classifications in 1985 and 2025. The summary separately lists 3.19% classified to developed, 14.09% forest loss, 2.84% agricultural loss, and 15.29% other difference.
Sources and Reference Data
- MRLC Annual NLCD Data – official access to annual land-cover and comparison products
- USGS Annual NLCD Land Cover Classification – definitions for forest, agriculture, developed land, wetlands, and related classes
- U.S. Census Bureau TIGER/Line Shapefiles – authoritative county, place, and transportation layers for comparison
- McDuffie County & City of Thomson – official local-government site for Thomson and McDuffie County
- Georgia DCA – McDuffie County, Dearing & Thomson Comprehensive Plan – official comprehensive-planning documents for the county and its two municipalities
- UGA Extension – McDuffie County Agriculture & Natural Resources – local soil, forage, pest-management, production, and natural-resource information
Map File Information
The ZIP contains four original JPG maps for comparing McDuffie County's 50.88% forest cover, agriculture, Thomson-area development, impervious surfaces, wetlands, and 1985–2025 class differences.
- Included Files: Four original JPG land-cover maps
- File Type: JPG files in one ZIP archive
- Intended Use: Printing, education, presentations, and map-based projects
Related Maps
- Appling County Georgia Land Cover Map
- Atkinson County Georgia Land Cover Map
- Bacon County Georgia Land Cover Map
Green Map creates custom-edited map images using open geographic data sources such as geoBoundaries, Natural Earth, OpenStreetMap, and government open data. These maps are edited visual materials, not raw data files, and are provided for education, documents, presentations, and graphic reference.