Leflore County sits in the Mississippi Delta, where low relief makes rivers, highways, and named communities especially useful for orientation. Greenwood is the county seat and the strongest reference point on the maps, while Itta Bena lies to the west, Schlater to the northwest, Sidon to the south, and Morgan City toward the southwest. This page brings those places together with the county boundary, major roads, waterways, and elevation so a visitor can understand the county before choosing a map file. The on-page previews use WebP images, and the original A3 high-resolution JPG maps are available together in the download ZIP below.
The most useful way to approach Leflore County is not to look for mountains or a single dominant ridge. Instead, start with Greenwood, US 82, US 49E, and the river junction beside the city. The Tallahatchie and Yalobusha rivers meet near Greenwood and the combined flow continues as the Yazoo River, giving the eastern-central part of the county a clear natural landmark. From that point, the maps spread across broad Delta farmland, scattered communities, curving channels, oxbow-like lakes, and a county boundary that changes shape several times between the northern and southern ends.
Each supplied map answers a different practical question without requiring GIS software. The county map is the best starting point for roads, towns, and neighboring counties; the city map makes the size and position of the five labeled communities easier to compare; the water map reveals many smaller lakes, bayous, and channels that disappear into the background on a general road map; and the elevation map shows that even this very low landscape has subtle differences in height. Used together, the four views explain why Greenwood is such a strong geographic anchor and why water remains important across the rest of the county.
Table of Contents
Greenwood anchors a county with an irregular Delta outline
Leflore County is not a simple rectangle. The map shows a long northern section, bends and recesses along the eastern side, and a narrower, changing outline toward the south. Neighboring counties help make sense of that shape: Tallahatchie County is to the north, Sunflower County is on the west, Carroll and Grenada counties lie to the east and northeast, Holmes County is toward the southeast, and Humphreys County is to the south and southwest. Keeping those names in view is useful when following a highway or waterway beyond the county line.
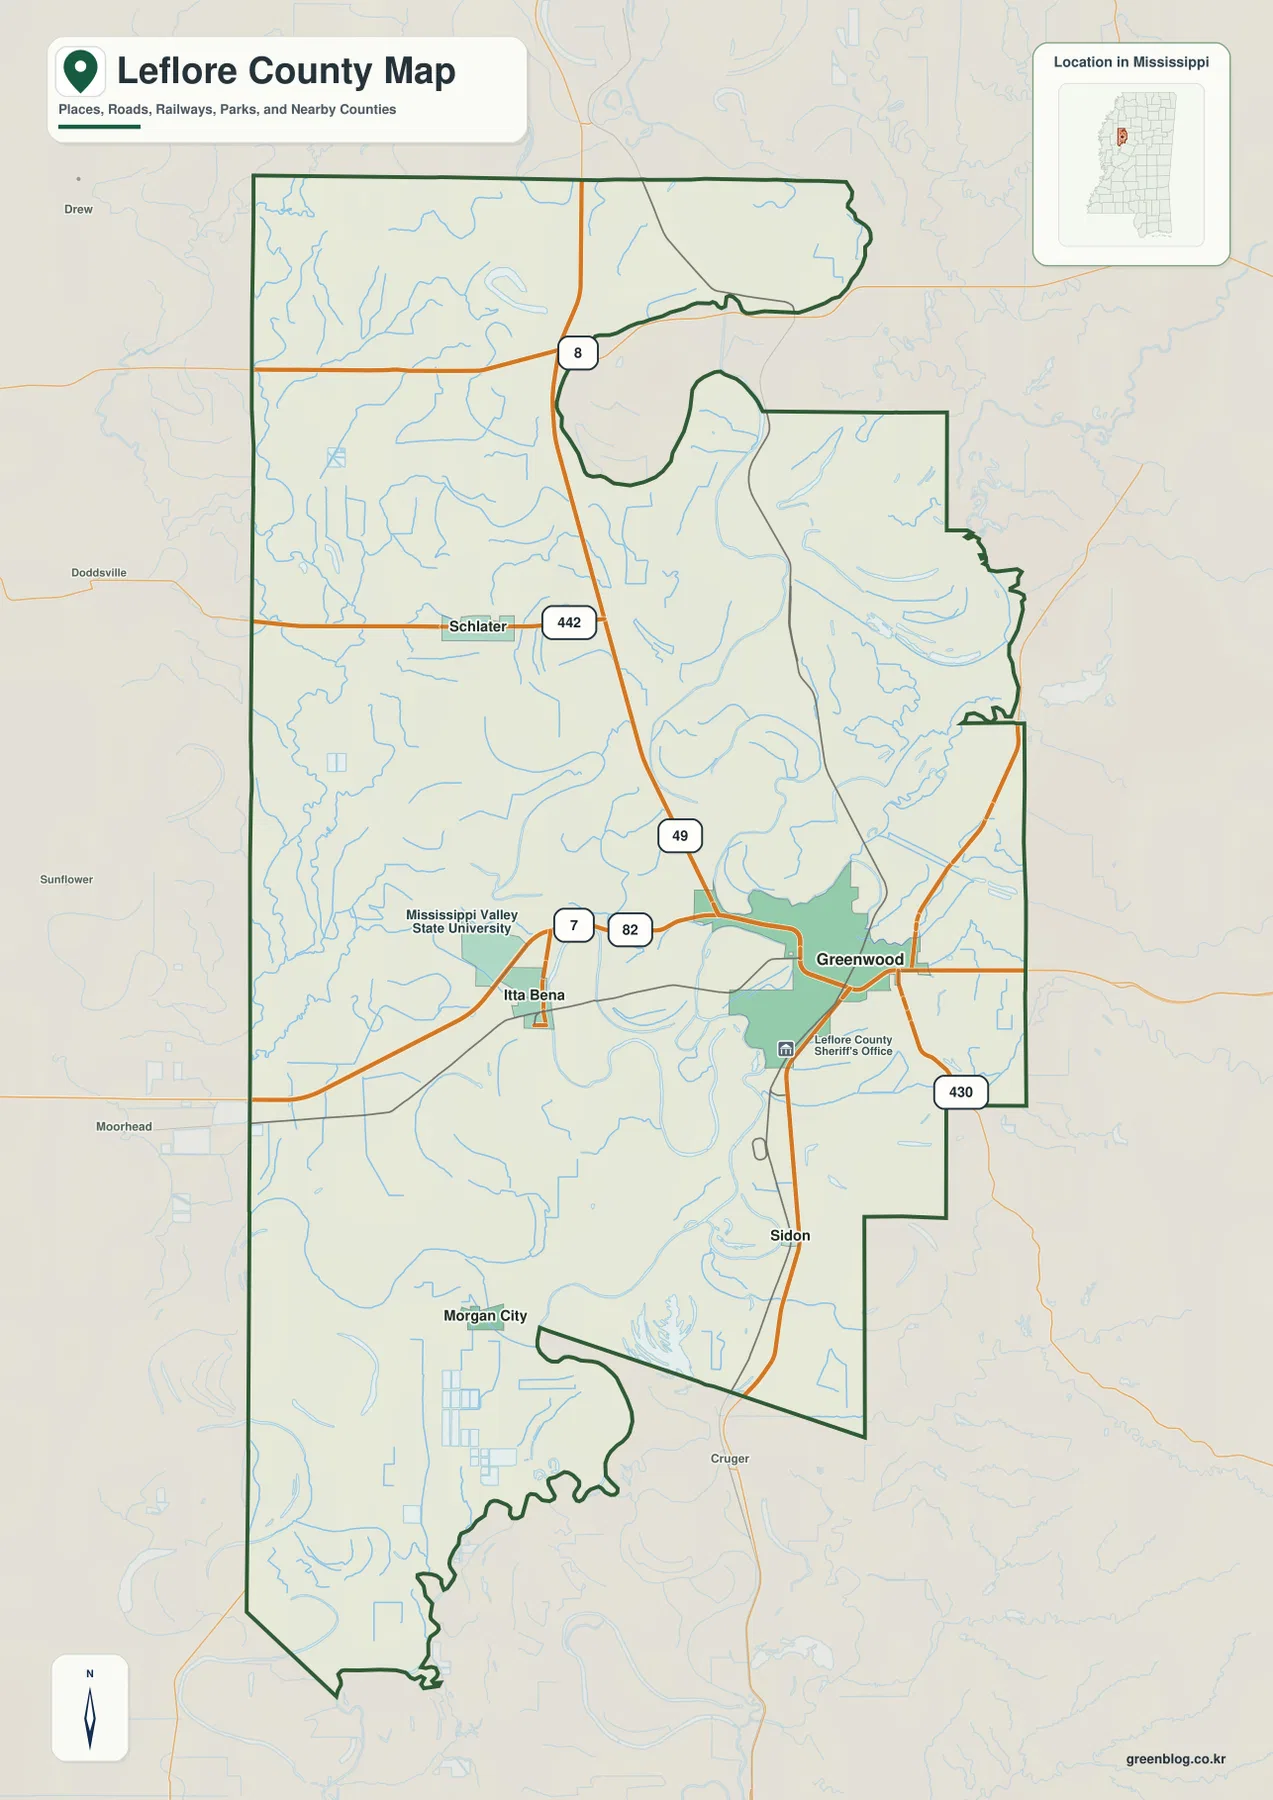
US 82 is the clearest east-west route on the map. It passes through Greenwood and runs west toward Itta Bena and the Sunflower County side of the Delta, while the eastern direction leads out toward Carroll County. US 49E gives a north-south reference through the county and continues south from Greenwood toward Sidon. The map also labels state routes including MS 7, MS 8, MS 442, and MS 430, which are helpful once the broader position of Greenwood and the two U.S. highways is established.
This is a county reference map rather than a turn-by-turn street map. Farm entrances, levee roads, drainage access roads, and the full network of local roads are too detailed to show at this scale. That limitation is useful to keep in mind when planning how to use the file: it works well for showing where a town or major route sits within Leflore County, but a driver who needs an exact address should pair it with a current navigation source.
The five labeled communities spread out from Greenwood rather than forming one urban belt
The city distribution map makes the settlement pattern much easier to see. Greenwood is ranked first and carries a map index value of 14,086, followed by Itta Bena at 1,967. Schlater, Sidon, and Morgan City are much smaller in the index, with values of 187, 186, and 130. Those figures are presented here as the values printed on the supplied CITY INDEX; the main point for map reading is the large difference between Greenwood and the other labeled communities, not to treat the index as a substitute for every current population source.
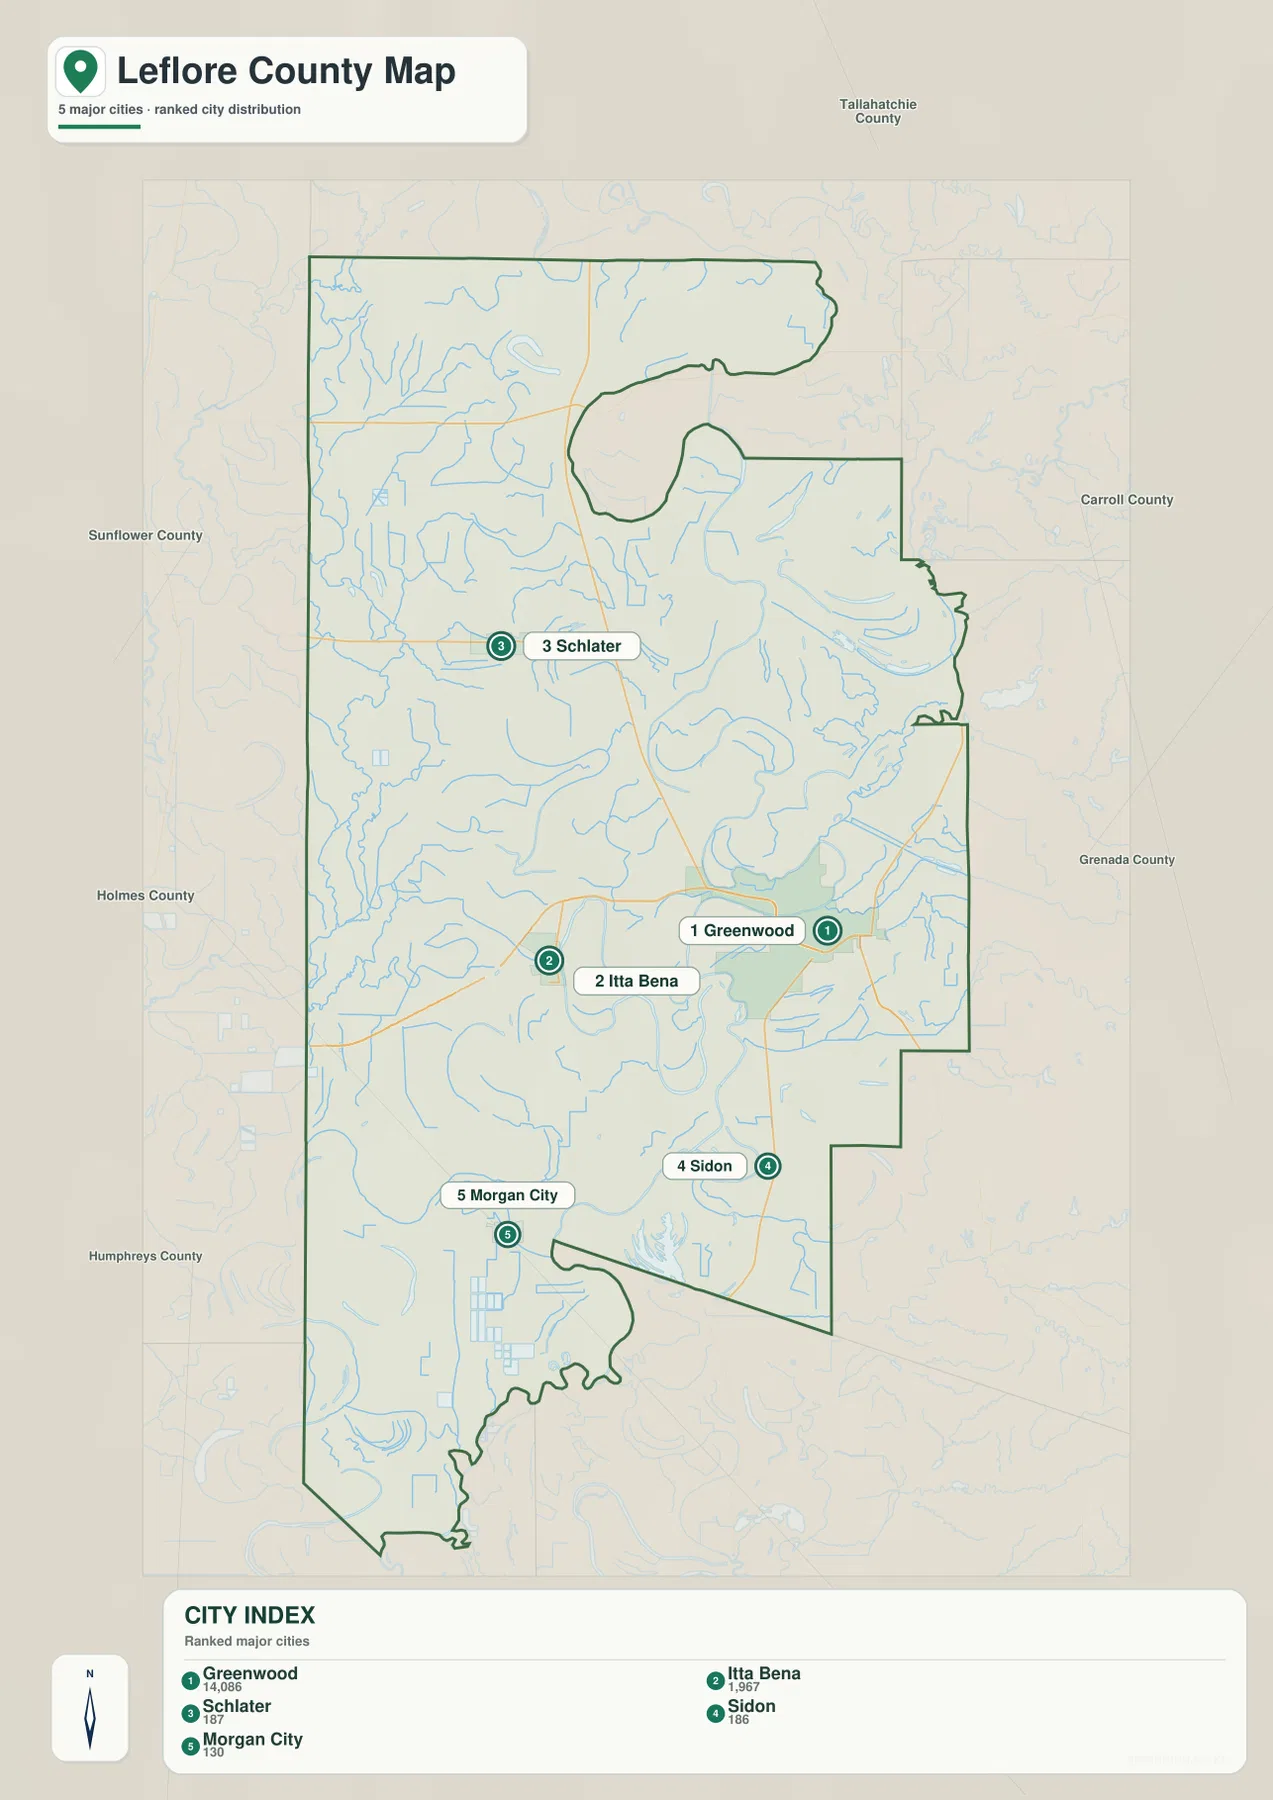
Itta Bena is the strongest western reference point because it lies along US 82, making the Greenwood-to-Itta Bena relationship easy to follow on both the county and city maps. Mississippi Valley State University is also labeled near Itta Bena, giving the western part of the county a recognizable institutional landmark. Schlater sits farther northwest, away from the main Greenwood-Itta Bena pair. Sidon lies south of Greenwood along the north-south route, while Morgan City is farther southwest near the Humphreys County side of the map.
The spacing between these places is as important as the names themselves. Much of the county between the labeled communities is rural Delta land crossed by channels, roads, and agricultural access routes. For a quick mental picture, US 82 works as the east-west line between Greenwood and Itta Bena, while US 49E provides the stronger north-south reference through Greenwood toward Sidon. Schlater and Morgan City then help divide the broad northwest and southwest parts of the county into recognizable areas.
Rivers and old channels explain more of the landscape than relief alone
Water is the defining physical feature of the Leflore County maps. The Tallahatchie and Yalobusha rivers approach Greenwood from different directions and meet near the city, with the joined river continuing as the Yazoo. On the water map, that well-known junction is only one part of a much denser network. Numerous smaller streams, bayous, lakes, and curved former channels appear across the county, especially where the Delta surface has been reshaped by shifting river courses over time.
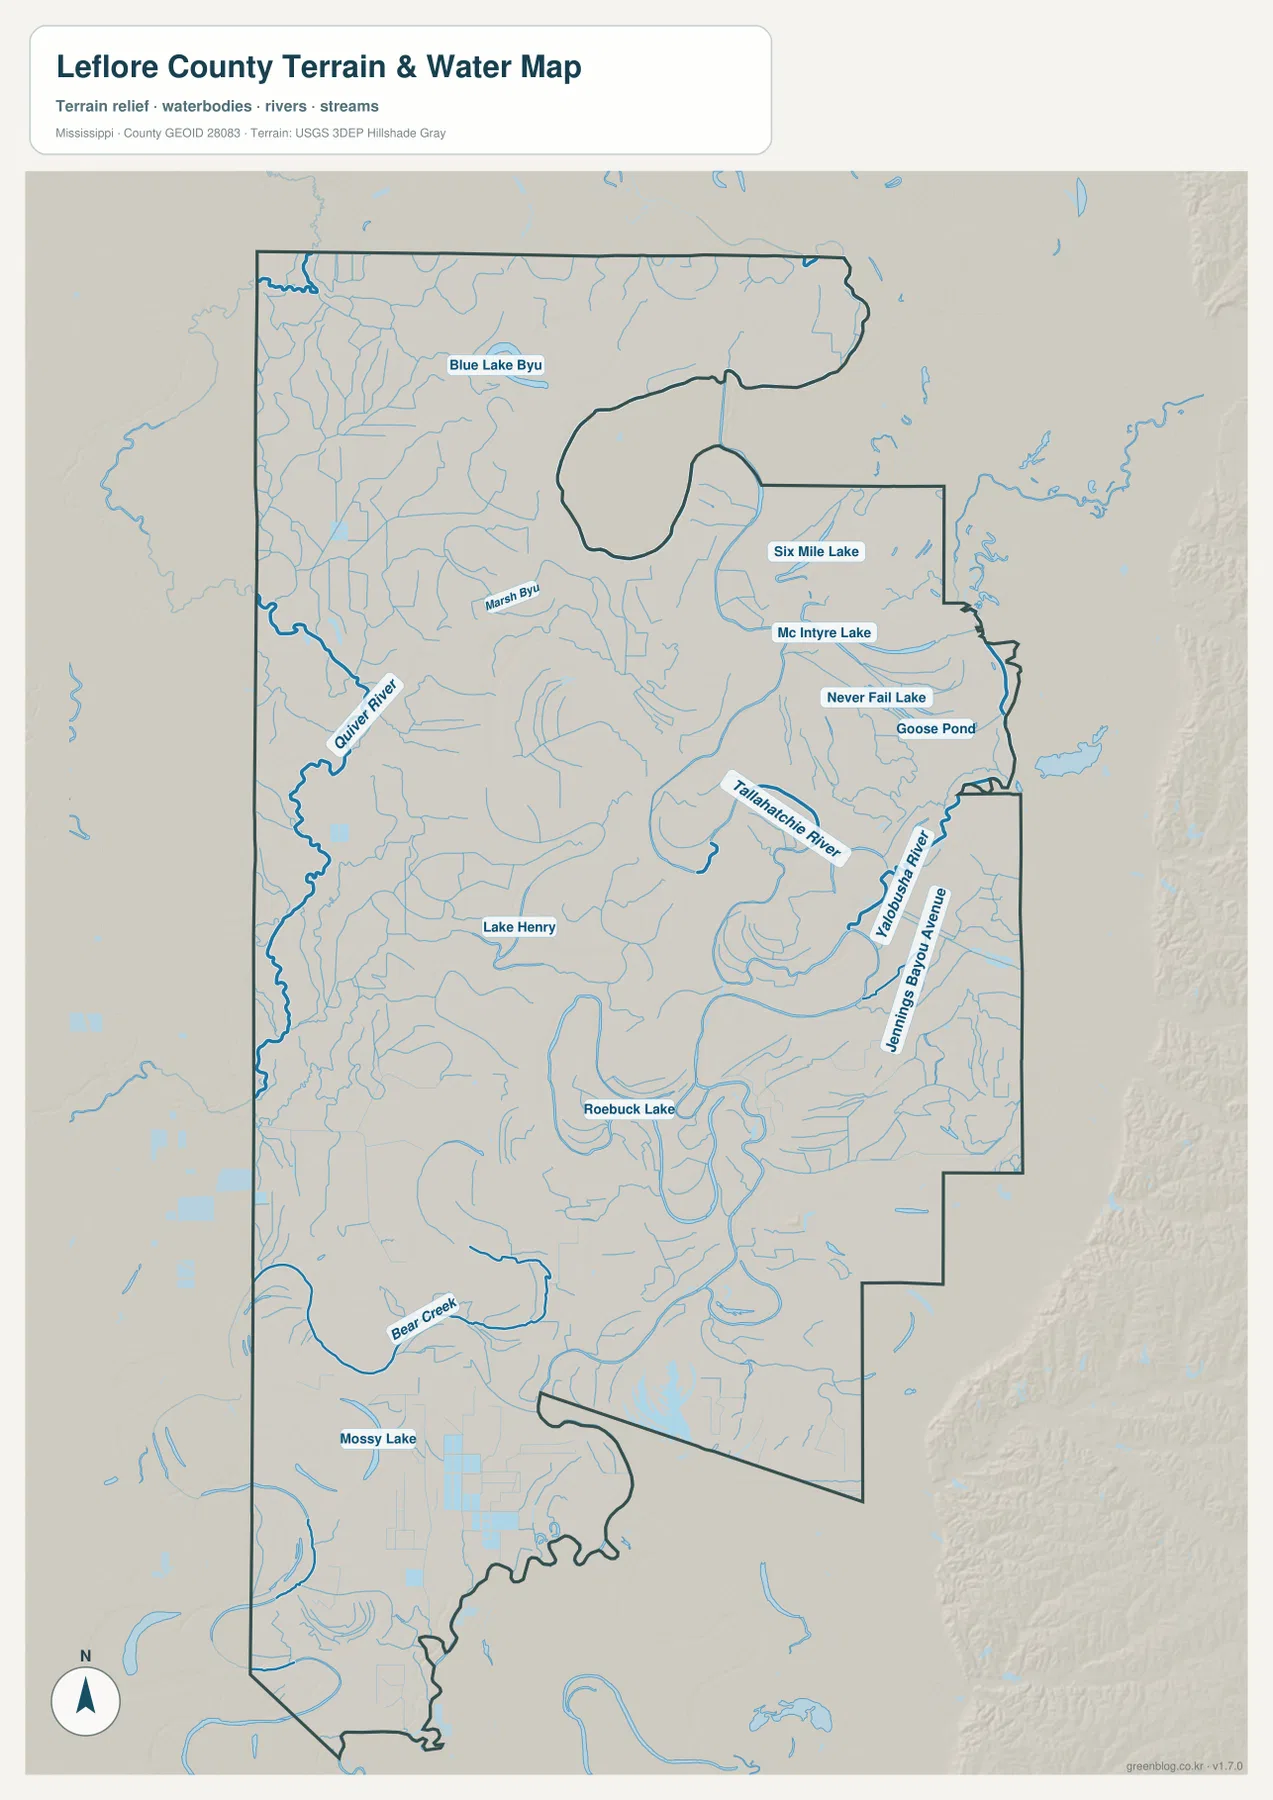
Several named features make the water map useful beyond the main river junction. Quiver River appears on the western side, while Blue Lake Bayou and Marsh Bayou are labeled farther north. The eastern and northeastern part of the county includes Six Mile Lake, McIntyre Lake, Never Fail Lake, and Goose Pond. Lake Henry is labeled west of the county center, Roebuck Lake appears farther south, and Bear Creek and Mossy Lake provide additional references toward the southern part of the map.
The shapes matter as much as the labels. Many channels bend sharply, loop around former courses, or sit beside elongated lakes that resemble pieces of abandoned river meanders. That visual texture is typical of a low alluvial plain and helps explain why a simple highway map can make the county look emptier than it really is. The water reference should not be treated as a flood-hazard map, a navigation chart, or a legal property-boundary product; it is designed to show where named water features and the larger drainage network sit in relation to the county.
A low county still has visible elevation differences
The elevation map puts numbers behind the impression of a flat Delta landscape. Its legend reports an actual elevation range of about 27 to 60 meters and a mean of about 38 meters. Those numbers are small compared with a mountain county, so the locally scaled colors are meant to reveal modest differences within Leflore County rather than suggest dramatic hills. The map is most useful when the colors are compared relative to one another.
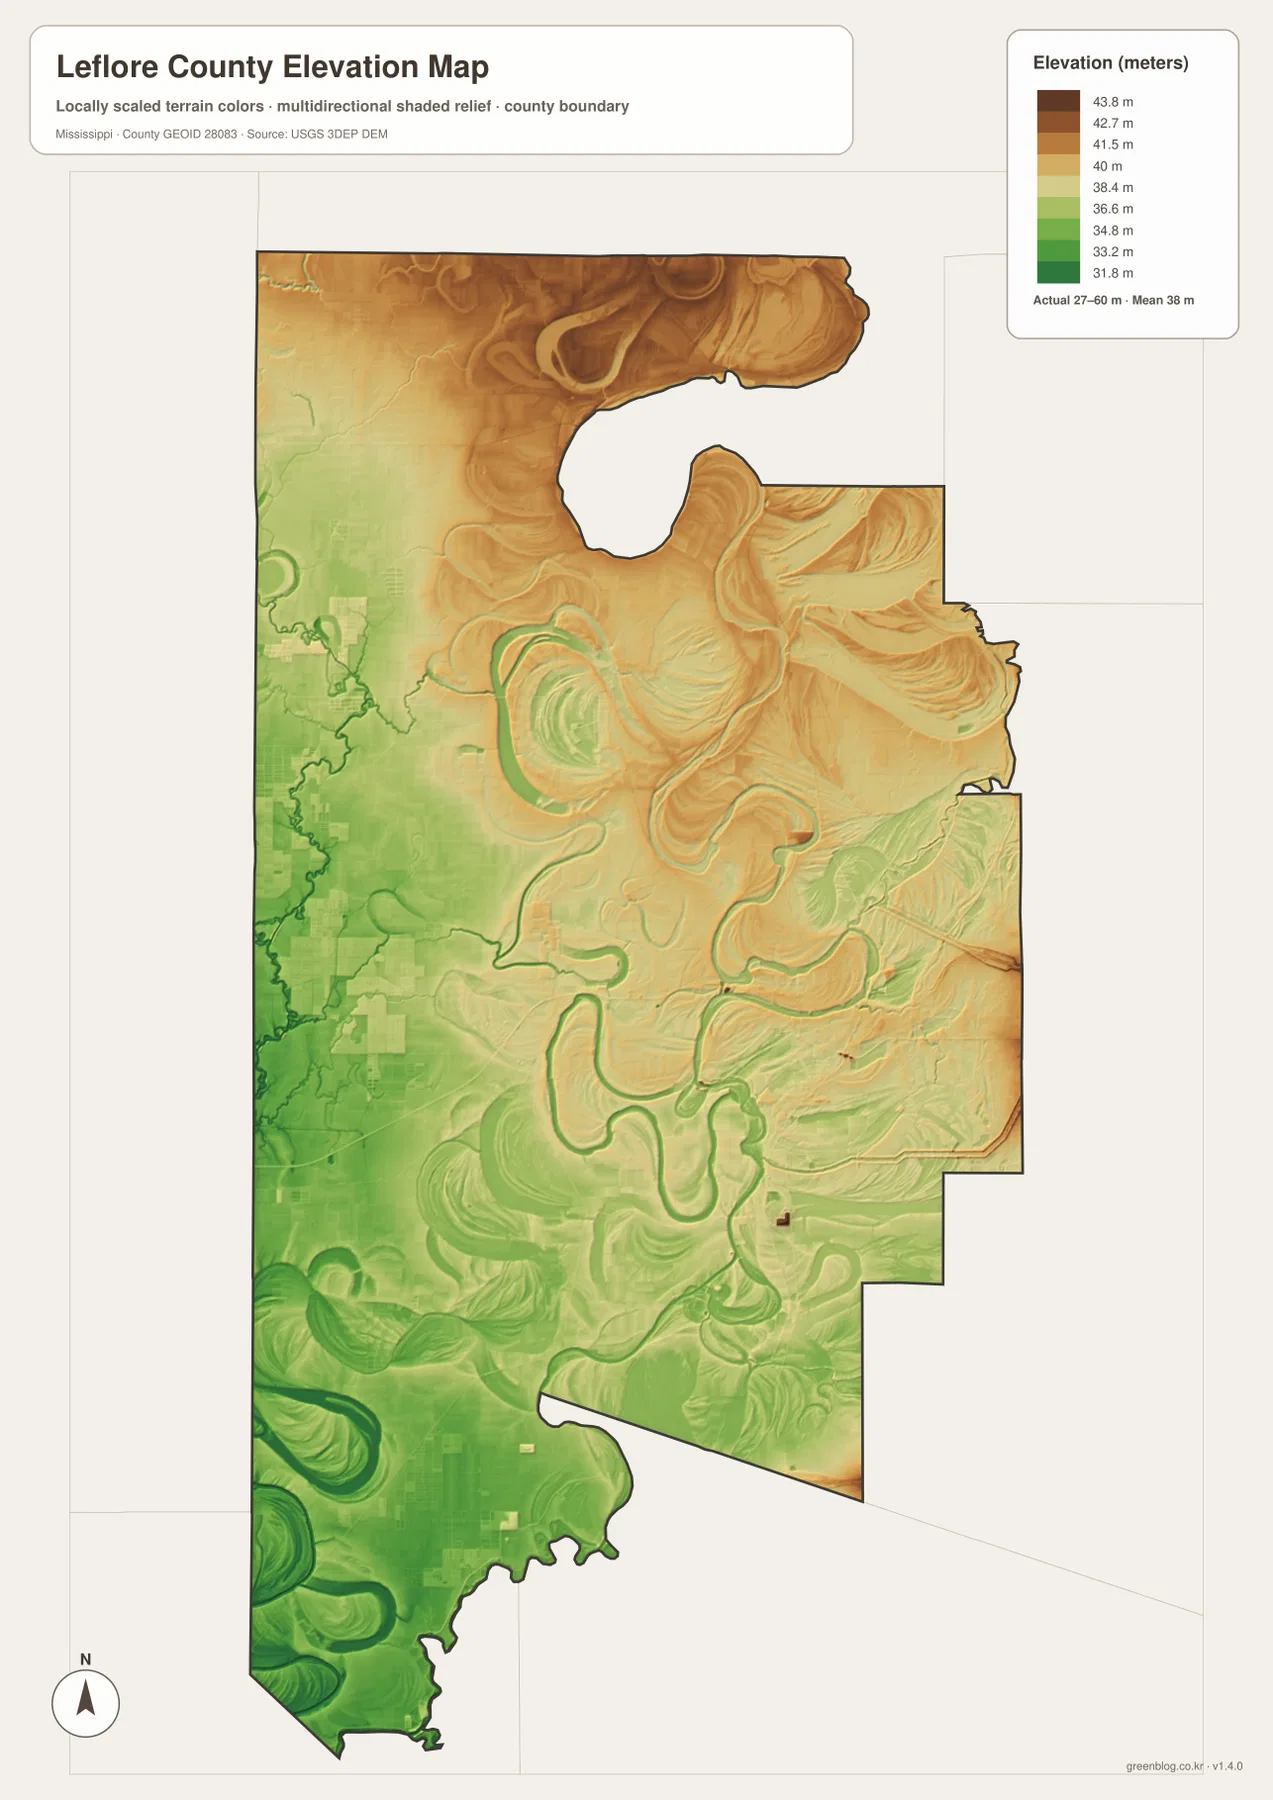
On the supplied map, higher local tones are more common in the north and in parts of the east, while lower green tones spread across much of the west and southwest. Narrow ridges and curving bands appear around former channels and river bends, showing that the surface is not perfectly level even where the county looks flat from a regional perspective. These small changes in height are much easier to notice on the elevation view than on the road or city maps.
The map also provides useful context for the eastern side of the county, where the Delta approaches higher ground toward Carroll and Holmes counties. That transition does not turn Leflore County into a hilly landscape, but it helps explain why the eastern margin can look different from the lower western and southwestern areas. Because the surface is generalized for county-scale viewing, the elevation image is not survey-grade and should not be used to determine a building pad, levee height, parcel drainage, or exact flood exposure.
Population and area add scale to what the maps show
| Measure | Value |
| FIPS code | 28083 |
| County seat | Greenwood |
| 2020 Census population | 28,339 |
| July 2025 population estimate | 25,686 |
| 2025 Gazetteer land area | 594.074 sq mi |
| 2025 Gazetteer water area | 12.304 sq mi |
| Density using 2020 population and 2025 land area | about 47.7 residents per sq mi |
The 2020 Census counted 28,339 residents in Leflore County, while the July 2025 estimate listed 25,686. The difference is 2,653 people, or roughly 9.4 percent, but the two figures come from different reference dates and different types of Census Bureau products. They are best used to provide demographic context rather than to imply that every community changed at the same rate.
The 2025 Gazetteer lists 594.074 square miles of land and 12.304 square miles of water, for about 606.378 square miles combined. Dividing the 2020 population by the later land-area figure gives an average of roughly 47.7 residents per square mile. That countywide average fits the visual pattern on the maps: a substantial share of the named population is concentrated around Greenwood, while large areas between the communities remain rural and are crossed by fields, channels, and transportation routes.
These statistics are especially helpful when the city map is viewed beside the county map. Greenwood stands out as the dominant labeled community, yet the county itself covers a broad area extending far north and south of the city. The result is a place where a visitor can move from the county seat into sparsely settled Delta land without encountering another comparably large town. That contrast is one reason roads and waterways are so important for orientation outside Greenwood.
Choose the map by the question you need to answer
If the goal is to locate Greenwood, Itta Bena, a major highway, or a neighboring county, begin with the general county map. It provides the broadest frame and makes it easy to follow US 82 and US 49E across the labeled communities. When the question is more specifically about the relative size and spacing of Greenwood, Itta Bena, Schlater, Sidon, and Morgan City, the city map removes some of the other detail and makes that settlement pattern the focus.
The water and elevation maps should be chosen for different reasons even though both describe the physical landscape. Use the water map to find named rivers, lakes, bayous, and the dense network of channels around the Delta. Use the elevation map when the question concerns relative high and low ground across the county. Looking at both can be informative, but a low elevation color does not by itself define a flood zone, and a mapped stream does not indicate whether a road crossing or boat route is currently usable.
- County orientation: roads, neighboring counties, Greenwood, Itta Bena, and the overall county outline
- Community comparison: the five ranked city labels and their positions across the county
- Water features: the Tallahatchie-Yalobusha junction, Quiver River, named lakes, bayous, and smaller channels
- Terrain: locally scaled elevation differences across a county with an actual range of about 27–60 meters
For printing, archiving, classroom use, or adding a map to a document, the original JPG files provide more detail than the WebP previews embedded in the article. The archive contains the same four map subjects shown on this page, so there is no need to download each preview separately. Pick the map that matches the task, or keep the full ZIP when you expect to compare roads, settlements, water, and terrain later.
Frequently Asked Questions
How is the Yazoo River connected to Greenwood?
The Tallahatchie and Yalobusha rivers meet near Greenwood, and the combined flow continues as the Yazoo River. That junction makes Greenwood a useful starting point on the water map because it connects the county seat to the larger river system while smaller lakes, bayous, and channels spread across the surrounding Delta.
Which map is best for comparing Greenwood and Itta Bena?
Use the general county map when road context matters, because US 82 provides a clear east-west link between the two places. Use the city map when the main question is settlement size and position; its CITY INDEX makes Greenwood’s larger role and Itta Bena’s western position easier to compare without the extra detail of the water and elevation layers.
Can the elevation map be used as a flood-risk map?
No. The supplied elevation map is a county-scale terrain reference with an actual range of about 27–60 meters and a mean near 38 meters. It can show relative high and low areas, but it does not contain official flood zones, levee certifications, parcel elevations, or engineering measurements. Those decisions require the appropriate official flood and survey sources.
Sources and reference links
- U.S. Census Bureau QuickFacts for Leflore County
- U.S. Census Bureau 2025 Gazetteer Files
- Mississippi Department of Transportation official highway map
- USGS National Hydrography
- USGS 3D Elevation Program
- Mississippi Valley State University
Map File Information
The ZIP contains the Leflore County reference, city, water, and elevation maps as A3 high-resolution JPG files. These originals are better suited to printing and reuse than the WebP previews shown in the article.
- File Type: ZIP containing 4 JPG files
Related Maps
Green Map creates custom-edited map images using open geographic data sources such as geoBoundaries, Natural Earth, OpenStreetMap, and government open data. These maps are edited visual materials, not raw data files, and are provided for education, documents, presentations, and graphic reference.