Lewis County occupies a long stretch of northeastern Kentucky where the Ohio River bends across the entire northern side of the county. Vanceburg sits near the middle of that riverfront, Concord lies to the west, and Garrison marks another important point farther east before the boundary narrows toward Kirkville. South of the river, the map changes quickly from a broad riverside reference to a maze of creeks, ridges, and winding numbered roads. The four maps on this page separate those layers so the county is easier to understand, and the original high-resolution JPG files can be downloaded from the map file box below.
Kentucky’s official local profile describes Lewis County as part of the northeastern Northern Kentucky River Region and notes that it has the longest Ohio River boundary among Kentucky counties that border the river. That fact is obvious in the supplied maps: the county’s top edge follows a series of large river bends rather than a straight line. The landscape to the south is very different. Streams cut back into the interior, roads bend through narrow valleys, and the elevation surface rises from low river corridors to a much rougher belt of hills.
Table of Contents
The Ohio River shapes the county’s long northern edge
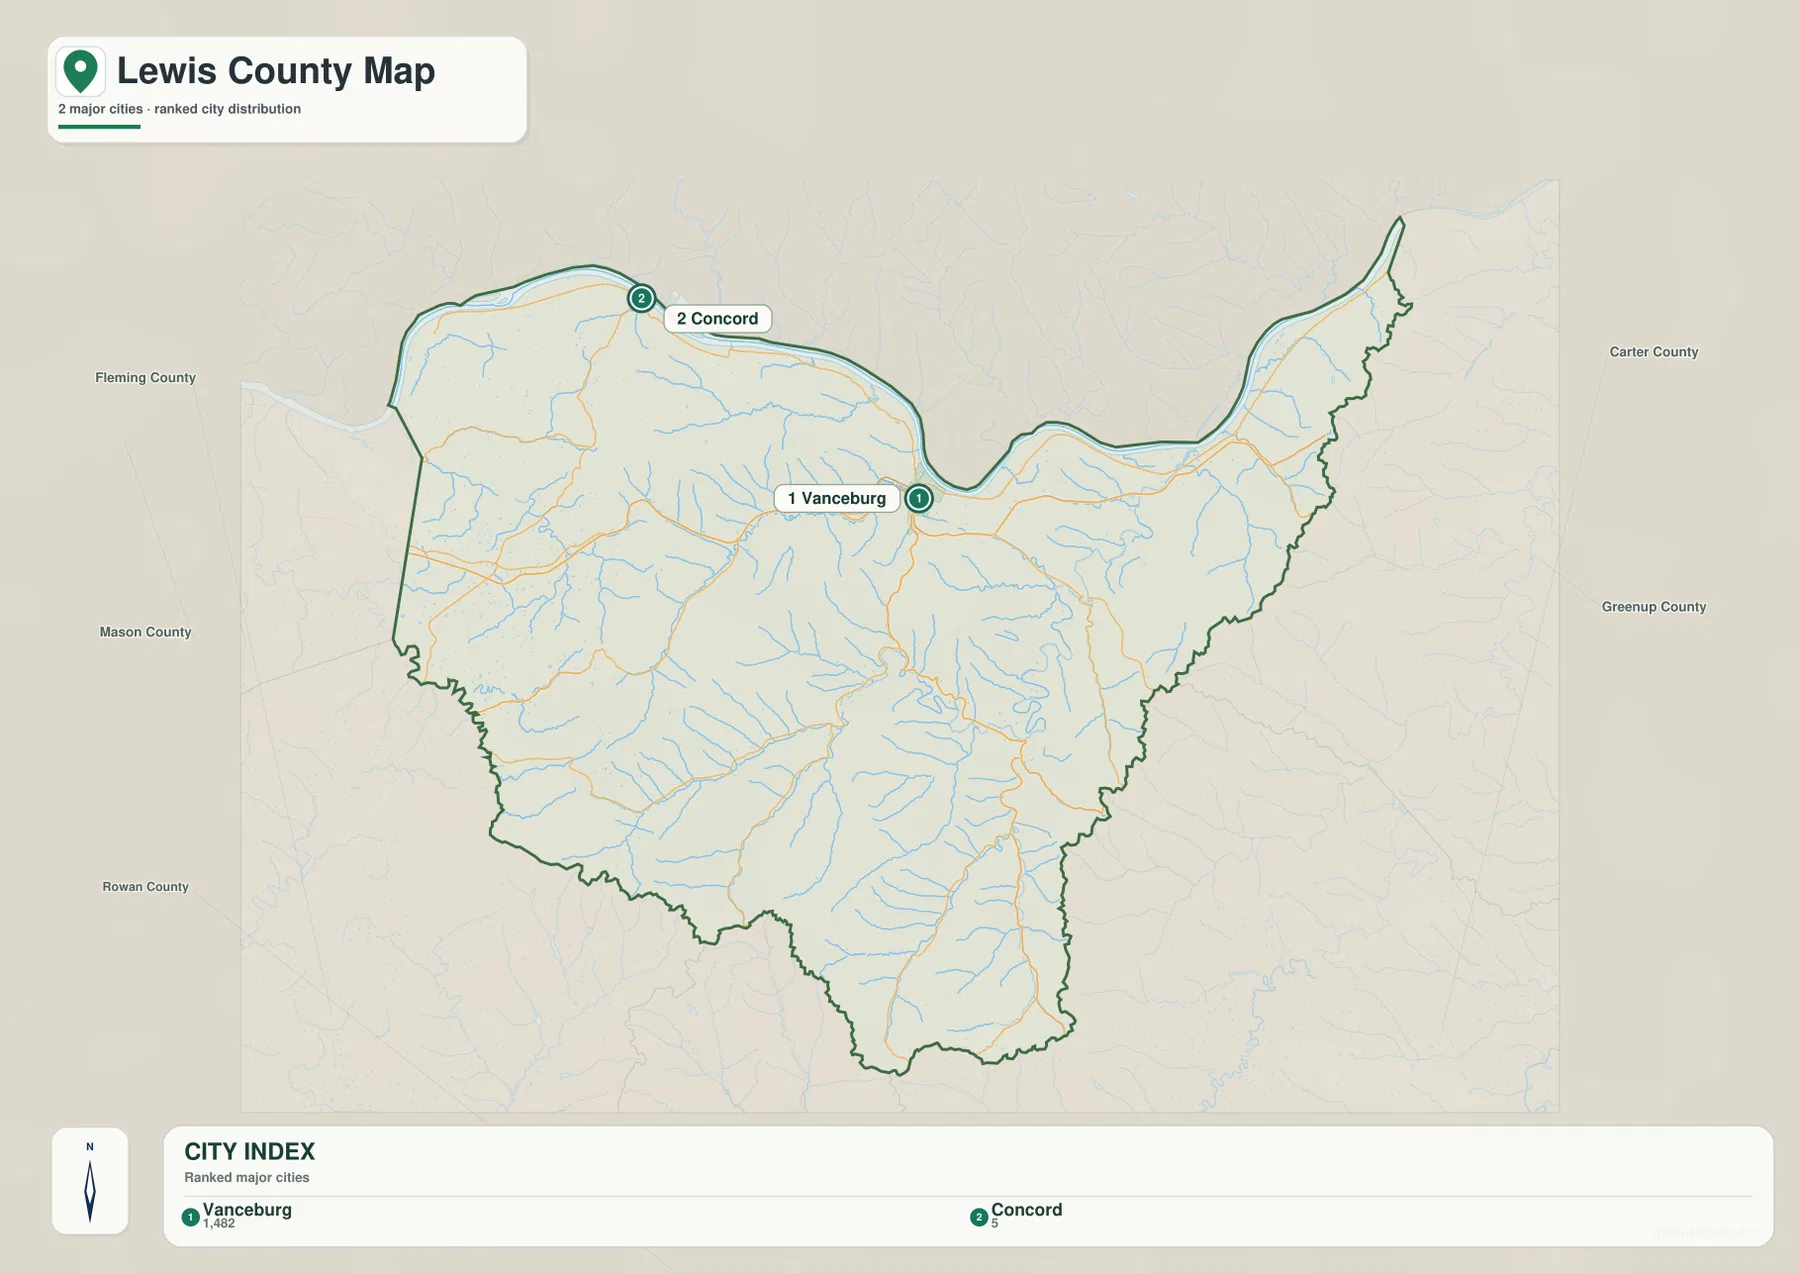
On the general county map, the Ohio River is more than a water feature. It is the organizing line for the northern half of Lewis County. Vanceburg sits on a deep bend near the center, Concord appears along the northwestern reach, and Garrison lies east of Vanceburg where the river corridor tightens against the county boundary. The far northeastern tip extends toward Kirkville, creating a narrow projection that looks quite different from the broader western and southern interior.
The road pattern reinforces that riverfront structure. KY 8 follows the northern side west of Vanceburg toward Concord, while KY 10 provides an eastward connection through Garrison. Farther inland, the map shows routes such as 9, 57, 344, 377, 474, and 59 bending through separate valleys rather than forming a regular grid. A reader can therefore use the Ohio River as the first orientation line, then trace individual roads southward to see how the interior is divided into smaller corridors.
This map works best as a geographic overview. It combines the county outline, several place names, neighboring roads, and the river in one frame, making it useful before looking at the more specialized water or elevation views. It should not be treated as a parcel map, a legal boundary survey, or a real-time navigation product. Road construction, closures, private access, and exact property lines require current information from the responsible agencies.
Vanceburg and Concord provide two simple settlement anchors
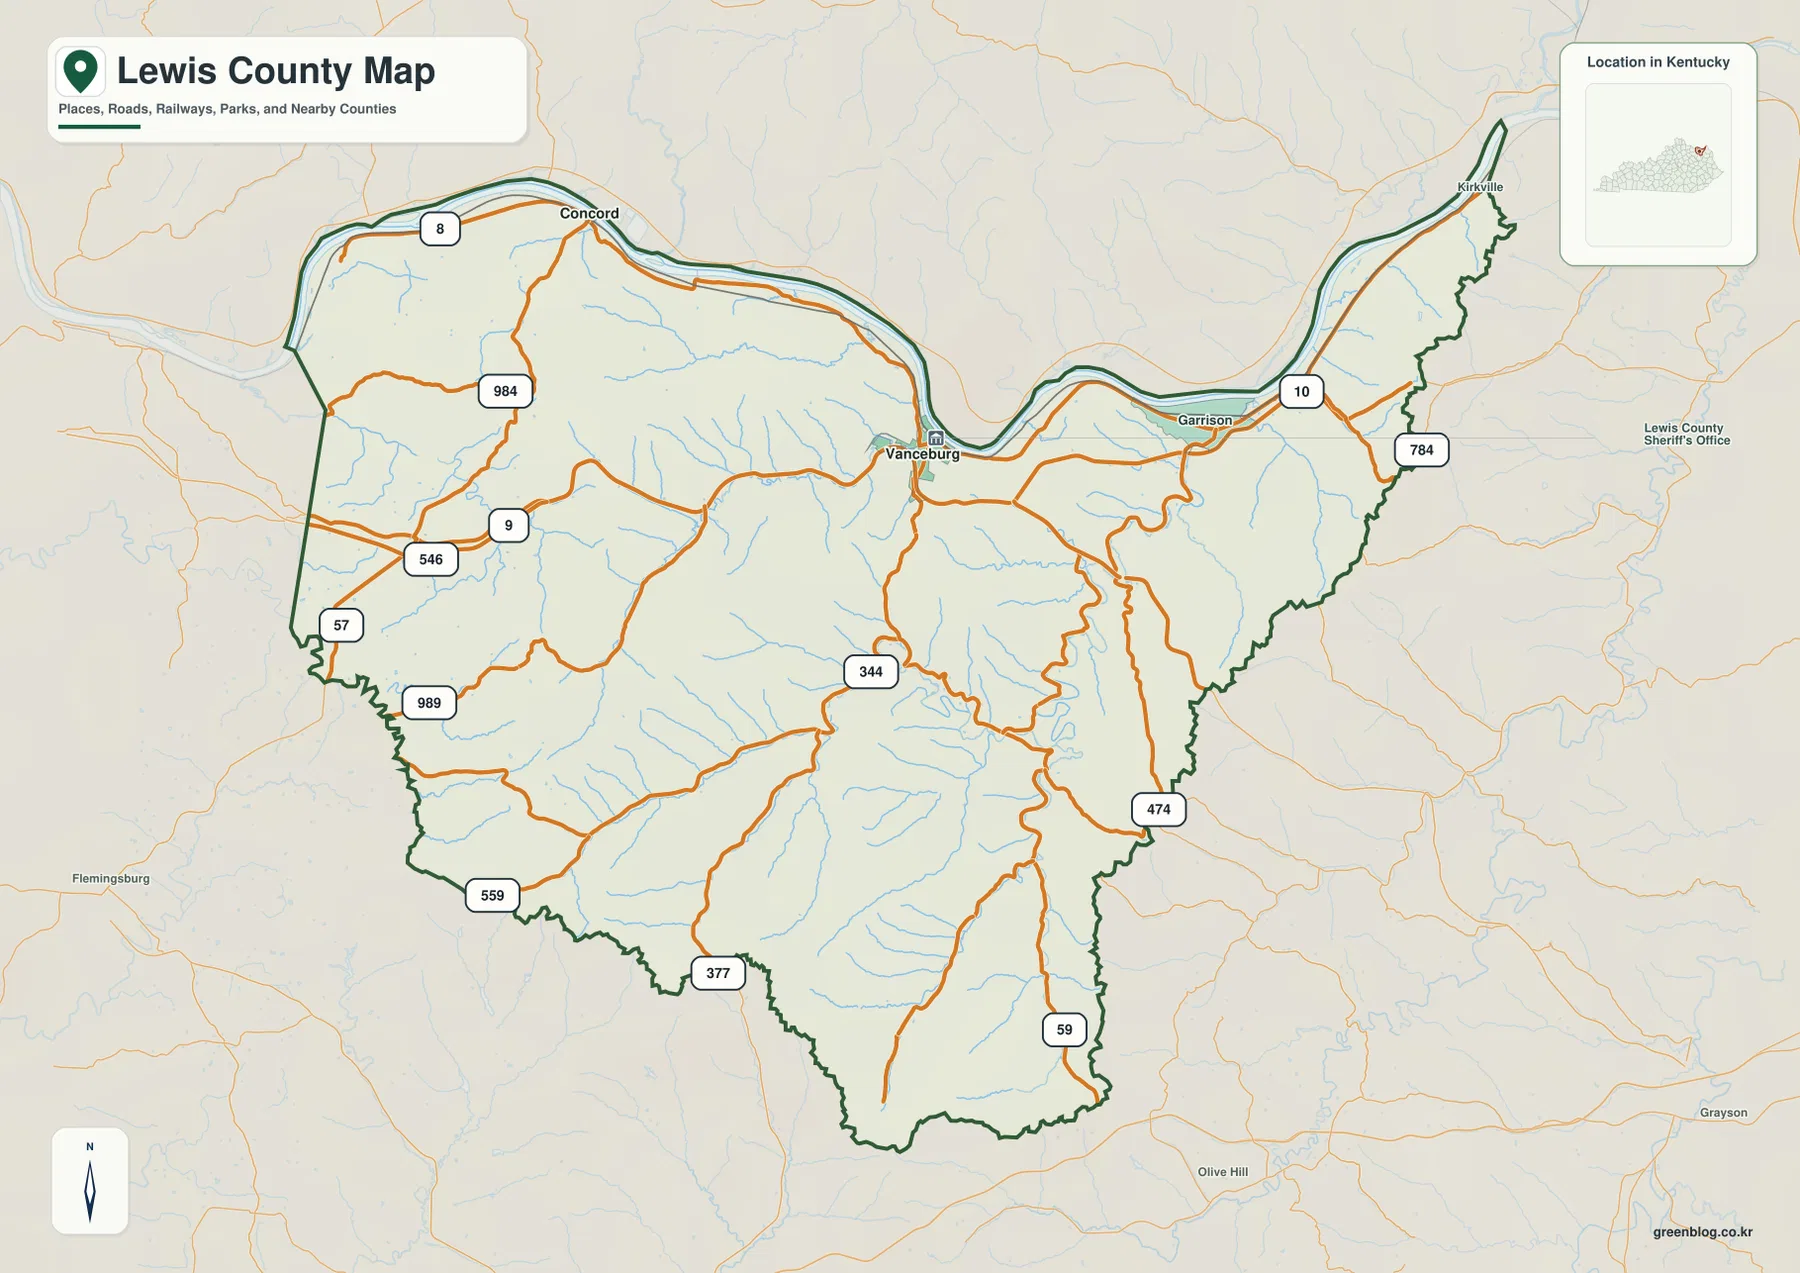
The city-index map deliberately removes much of the road detail and highlights two ranked city markers: Vanceburg first and Concord second. That simplified presentation is helpful when a lesson, report, or slide needs a quick sense of where the county’s principal mapped settlements sit without the visual noise of every numbered road. Vanceburg is positioned on the central river bend, while Concord lies to the northwest, also close to the Ohio River.
The same view makes Lewis County’s Kentucky neighbors easy to place. Mason County is to the west, Fleming County to the northwest, and Rowan County to the southwest. Carter County and Greenup County lie on the eastern side. The northern boundary is different from all of those land borders because it follows the Ohio River. This combination gives Lewis County a long riverfront on one side and a fan of inland county boundaries on the others.
The two city markers should not be read as a complete list of communities. The general map also labels Garrison and Kirkville, and the official county clerk’s precinct information includes places such as Tollesboro, Burtonville, Petersville, Black Oak, Quincy, Laurel, and Firebrick. The city-index view is therefore best used for broad orientation, while the boundary map and current local records are better when a project needs smaller communities or exact addresses.
Roads leave the river and split into separate valley corridors
The county’s transportation pattern is easiest to read as a set of river and valley routes rather than as a network of straight cross-county lines. Along the north, KY 8 and KY 10 have long stretches that parallel the Ohio River. Once a route turns inland, its shape becomes much more irregular. Routes 344, 474, and 59 descend through the central and southeastern interior, while roads in the west connect toward the Mason and Fleming county sides through a different group of valleys.
That difference matters when comparing straight-line positions with actual travel. Two points may appear close across a ridge, but the road between them can follow a creek valley for several miles before reaching a suitable crossing. The map’s many bends are not decorative; they correspond to a landscape where low ground is narrow and higher ridges repeatedly separate one drainage from the next. The water and elevation maps make that connection much clearer than the road map can on its own.
For practical map reading, begin with Vanceburg and the Ohio River, then follow either the western or eastern river corridor. After that, trace one numbered road south into the interior and compare its path with the nearby creeks. This approach avoids trying to memorize every route number at once. Because the map is a reference graphic rather than a live traffic service, drivers should still consult current Kentucky transportation information for closures, construction, weather impacts, and travel times.
Kinniconick Creek and smaller streams cut through the southern hills
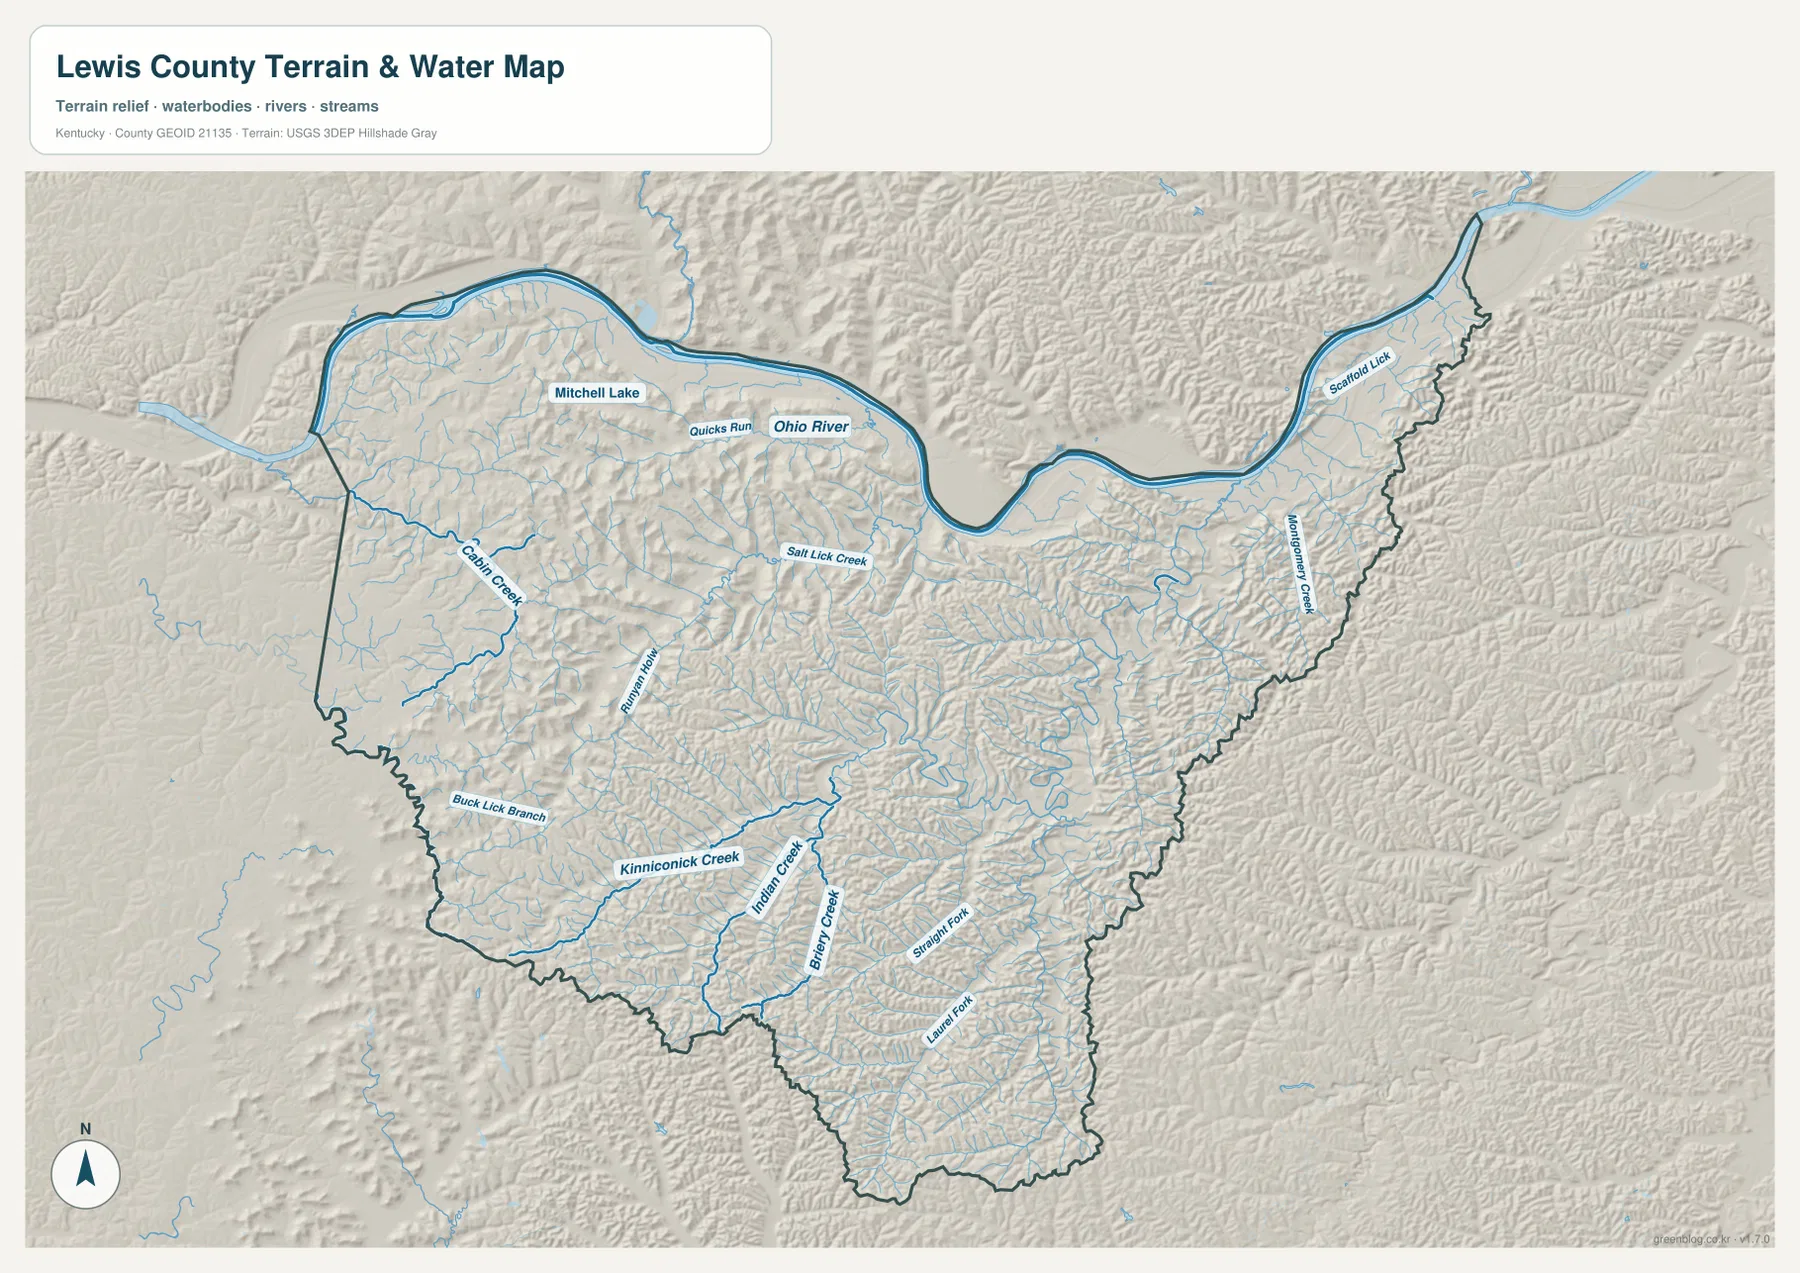
The terrain-and-water map puts the Ohio River at the top of a much denser drainage system. Its blue line forms the county’s dominant northern edge, while dozens of smaller streams descend from the interior. Instead of one central river running through the middle of Lewis County, the map shows many creek valleys converging northward. This pattern helps explain why the county has so many separate road corridors and why the interior looks more fragmented than the riverfront.
Kinniconick Creek is one of the clearest named streams in the southwestern part of the map. Indian Creek appears farther east, and Salt Lick Creek reaches toward the Ohio River from the central interior. Straight Fork and Laurel Fork add named references in the southern half. These waterways are useful landmarks because they provide a simple way to organize a drainage network that would otherwise look like an indistinguishable web of blue lines.
Mitchell Lake is labeled near the northwestern part of the county, giving the map a small inland waterbody in addition to the huge Ohio River. Its scale is very different from the main river, but its inclusion is useful when discussing how lakes, creeks, and the river all occupy the same hilly landscape. The map does not provide water depth, discharge, flood frequency, public access, or boating conditions, so those questions should be checked with current specialized sources rather than inferred from line thickness or color.
Water and settlement geography also meet around Vanceburg. The city sits where the Ohio River bends along the northern margin, while smaller valleys approach from the south. East toward Garrison, the river remains the main orientation feature; farther inland, creeks become more useful guides. When the terrain-and-water view is placed beside the road map, it becomes much easier to see why many routes stay in one valley for a long distance before turning or climbing toward another corridor.
Relief rises from about 147 meters to 422 meters
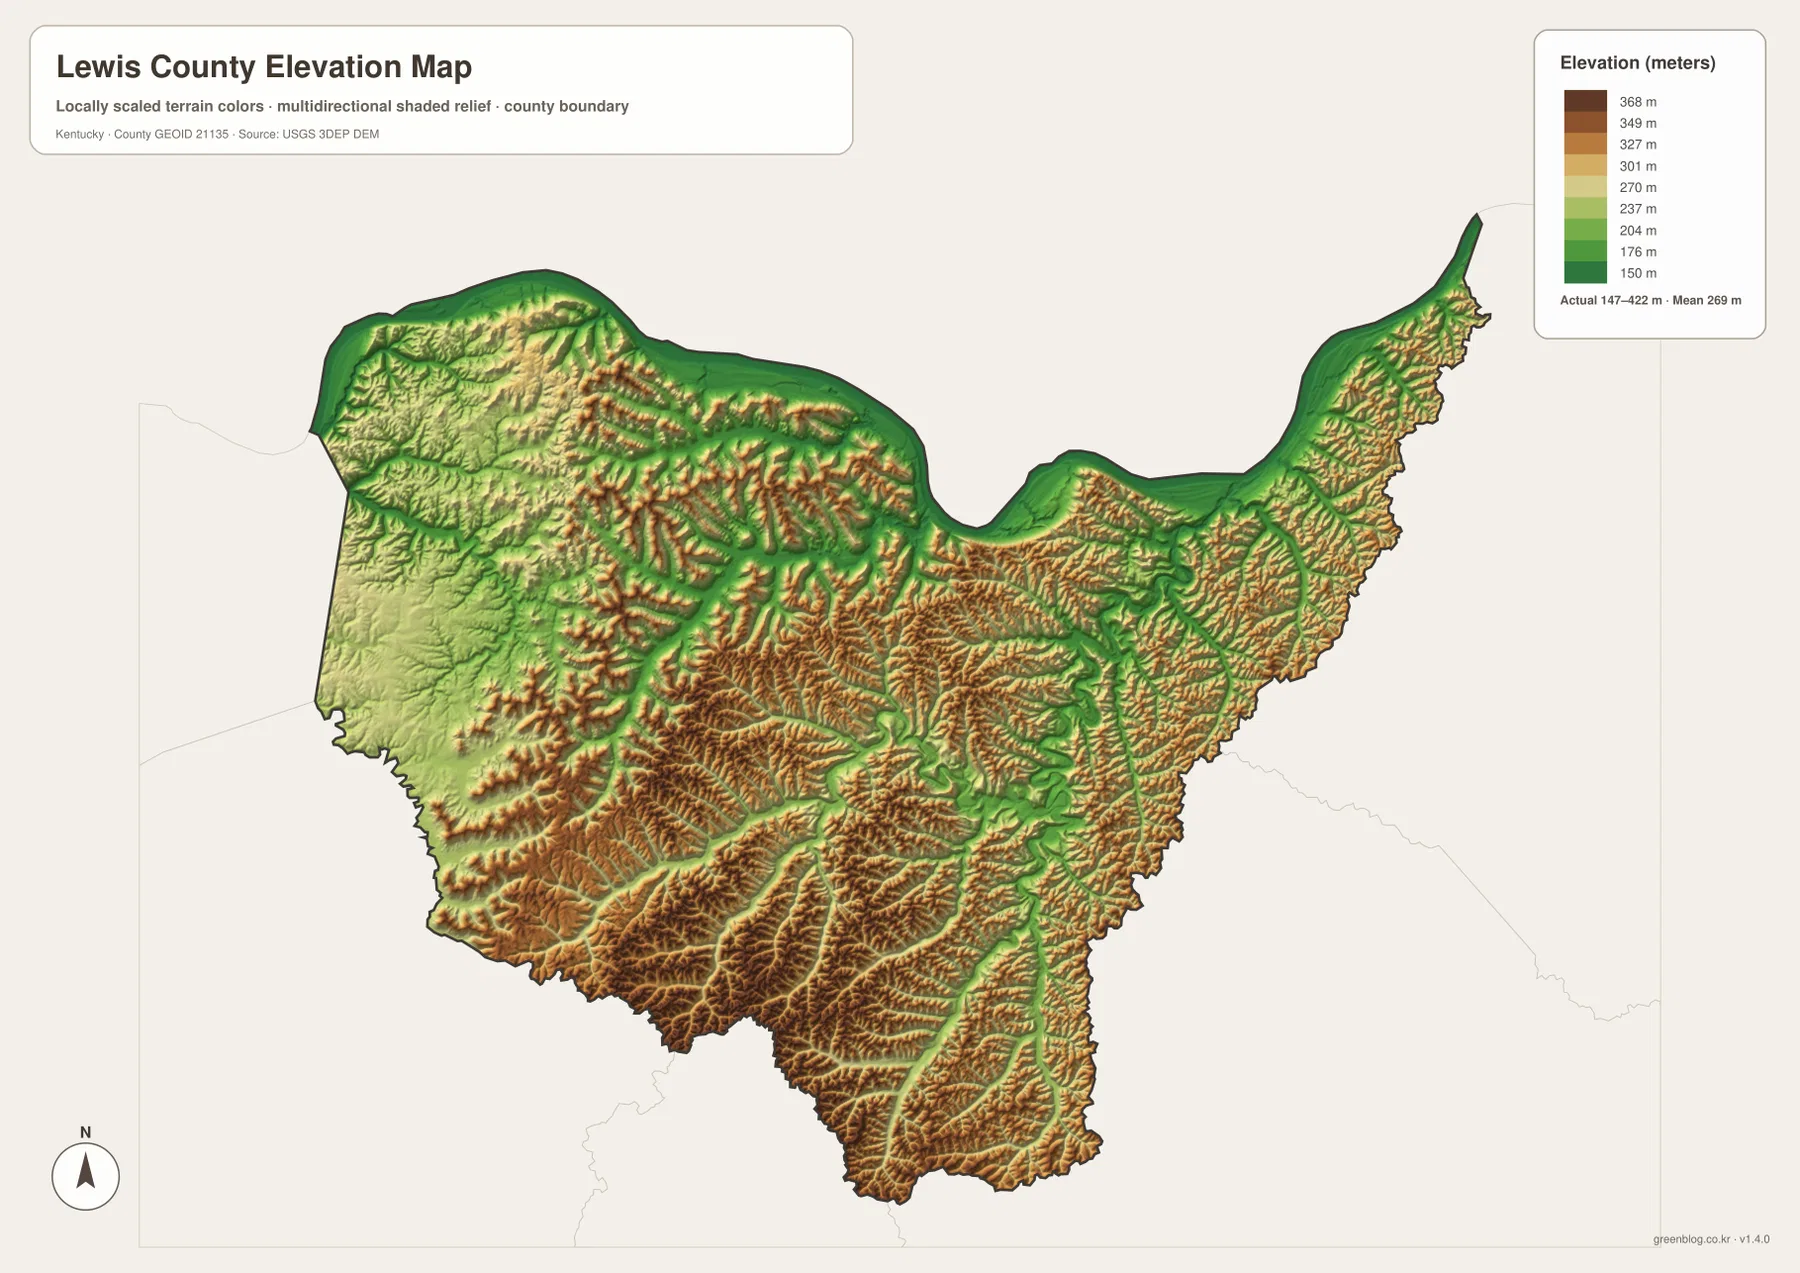
The elevation map reports an actual county range of roughly 147–422 meters with a mean near 269 meters. The lowest green tones follow the Ohio River and other major valley floors, while yellow, tan, and brown colors become more common across the southern interior. The result is not a simple north-to-south slope. Higher ridges are cut by long low corridors, creating a repeated pattern of narrow valleys between uplands.
The western interior shows a gradual transition away from the low river margin into a more strongly dissected hill landscape. In the central south, bands of higher ground become broader and more continuous, but green valley lines still penetrate far between them. The eastern side has a similar contrast: the immediate Ohio River corridor is low, then the land rises quickly into closely spaced ridges before narrowing toward the northeastern tip.
This relief pattern helps explain several features on the other maps. Vanceburg and Concord sit along relatively low northern ground, while inland roads weave between higher slopes. Creeks occupy many of the same green corridors visible on the elevation map. A reader can therefore use the water map to identify the drainage line and the elevation map to see the surrounding ridge walls, giving a much more complete picture than either map alone.
The colored surface is generalized for regional comparison and should not be treated as a survey. A point that appears in one elevation color still covers an area with local variation, and the displayed maximum or minimum does not provide a construction-grade height for a house, road, bridge, or property corner. Exact site elevations should come from current source DEM data or professional surveying. For classroom or print use, however, the contrast between the Ohio River lowlands and the southern ridges is clear and easy to explain.
Reading the riverfront and the southern interior as one landscape
A useful way to read Lewis County is to move from the river inward. Start at Vanceburg and follow the Ohio River west toward Concord or east toward Garrison. Then choose one inland road and trace it south, noting where it begins to bend more sharply. The water map will usually show a creek in the same general corridor, and the elevation map will reveal higher ridges on either side. Repeating that sequence at several locations turns a complicated map into a set of understandable valley systems.
Concord provides a good western example. On the city map it is simply a marker near the river. On the general map it is connected to the river road and nearby inland routes. The water view adds tributaries descending toward the Ohio, and the elevation view shows that the low northern margin is backed by progressively higher hill country. Those layers explain why a small place on the river can be geographically close to rugged terrain only a short distance inland.
The eastern projection tells a different story. Garrison sits along the river before the county narrows toward Kirkville, and the available land between the river and eastern boundary becomes tighter. Ridges and stream corridors are packed into a smaller space than in the broad western interior. Treating that northeastern extension separately from the rest of the county produces a more accurate mental picture than describing all of Lewis County as though it had one uniform shape or one type of terrain.
Which Lewis County map fits the task?
Choose the county map when the main question is where a place or road sits inside the county. It is the strongest all-purpose view for locating Vanceburg, Concord, Garrison, Kirkville, the Ohio River edge, and the major numbered routes in one frame. The city-index map is cleaner when only the broad settlement pattern matters, especially in a presentation where detailed roads would distract from the location of Vanceburg and Concord.
Use the terrain-and-water map for questions about creeks, river drainage, and the relationship between waterways and the hills. Kinniconick Creek, Indian Creek, Salt Lick Creek, and the Ohio River provide clear reference lines. The elevation map is the better choice for showing how low the river margin is compared with the southern and eastern ridges. Putting those two physical-geography maps side by side is particularly useful when explaining why roads and streams so often occupy the same narrow valleys.
The download archive contains the original JPG versions rather than the smaller WebP images used in the article body. Each file measures 3,638×2,572 pixels, which provides more detail for printing, classroom worksheets, presentations, and offline reference. These maps are explanatory graphics, not replacements for legal boundary records, flood studies, navigation charts, engineering drawings, or parcel surveys. The source links below point to authoritative boundary, hydrography, and elevation datasets when a project requires the underlying current data.
Frequently Asked Questions
Why does the northern boundary have so many large bends?
Most of the northern boundary follows the Ohio River, so the county outline mirrors the river’s curves rather than a straight surveyed line. Kentucky’s official Lewis County profile also notes that the county has the longest Ohio River boundary among Kentucky counties bordering the river. Vanceburg, Concord, and Garrison all sit along that same northern river corridor.
Does the city-index map show every community in Lewis County?
No. The supplied city-index map simplifies the county by emphasizing Vanceburg and Concord as its two ranked city markers. The general map also labels Garrison and Kirkville, while official local records include additional communities and precinct names. Use the city view for quick orientation and a more detailed or official source when a project needs smaller places.
Can the 147–422 meter elevation range be used for surveying?
No. The elevation surface is intended to compare the county’s low river corridors with its higher ridges. It reports an overall range of about 147–422 meters and a mean near 269 meters, but exact site elevations for engineering, construction, property work, or surveying should come from current source elevation data or professional field measurements.
Map File Information
The ZIP archive contains the original high-resolution JPG versions of the Lewis County boundary-and-road map, city-index map, terrain-and-water map, and elevation map. Each image is 3,638×2,572 pixels for printing, classroom work, presentations, and offline reference.
- File Type: 4 JPG files inside one ZIP archive
Related Maps
Sources and references
Local government information is available from the official Lewis County government website and the Kentucky.gov Lewis County profile. County formation information can be checked through the Kentucky Department for Libraries and Archives county formation chart, while the Kentucky Historical Society marker page provides historical context for the Lewis County name in Vanceburg.
For underlying geographic data, use the U.S. Census Bureau TIGER/Line Shapefiles for boundaries and transportation features, USGS National Hydrography for water features, and the USGS 3D Elevation Program for elevation data. The maps on this page are designed for geographic explanation and printing; legal, engineering, navigation, and field decisions should use the latest authoritative source data.
Green Map creates custom-edited map images using open geographic data sources such as geoBoundaries, Natural Earth, OpenStreetMap, and government open data. These maps are edited visual materials, not raw data files, and are provided for education, documents, presentations, and graphic reference.